Collect data from your workloads with the Log Analytics agent
Configure the Log Analytics agent and workspaces
When the Log Analytics agent is on, Defender for Cloud deploys the agent on all supported Azure VMs and any new ones created. For the list of supported platforms, see Supported platforms in Microsoft Defender for Cloud.
To configure integration with the Log Analytics agent:
From Defender for Cloud's menu, open Environment settings.
Select the relevant subscription.
In the Monitoring Coverage column of the Defender plans, select Settings.
From the configuration options pane, define the workspace to use.

Connect Azure VMs to the default workspaces created by Defender for Cloud - Defender for Cloud creates a new resource group and default workspace in the same geolocation, and connects the agent to that workspace. If a subscription contains VMs from multiple geolocations, Defender for Cloud creates multiple workspaces to ensure compliance with data privacy requirements.
The naming convention for the workspace and resource group is:
- Workspace: DefaultWorkspace-[subscription-ID]-[geo]
- Resource Group: DefaultResourceGroup-[geo]
A Defender for Cloud solution is automatically enabled on the workspace per the pricing tier set for the subscription.
Tip
For questions regarding default workspaces, see:
Connect Azure VMs to a different workspace - From the dropdown list, select the workspace to store collected data. The dropdown list includes all workspaces across all of your subscriptions. You can use this option to collect data from virtual machines running in different subscriptions and store it all in your selected workspace.
If you already have an existing Log Analytics workspace, you might want to use the same workspace (requires read and write permissions on the workspace). This option is useful if you're using a centralized workspace in your organization and want to use it for security data collection. Learn more in Manage access to log data and workspaces in Azure Monitor.
If your selected workspace already has a "Security" or "SecurityCenterFree" solution enabled, the pricing will be set automatically. If not, install a Defender for Cloud solution on the workspace:
- From Defender for Cloud's menu, open Environment settings.
- Select the workspace to which you'll be connecting the agents.
- Set Security posture management to on or select Enable all to turn all Microsoft Defender plans on.
From the Windows security events configuration, select the amount of raw event data to store:
- None – Disable security event storage. (Default)
- Minimal – A small set of events for when you want to minimize the event volume.
- Common – A set of events that satisfies most customers and provides a full audit trail.
- All events – For customers who want to make sure all events are stored.
Tip
To set these options at the workspace level, see Setting the security event option at the workspace level.
For more information of these options, see Windows security event options for the Log Analytics agent.
Select Apply in the configuration pane.

Windows security event options for the Log Analytics agent
When you select a data collection tier in Microsoft Defender for Cloud, the security events of the selected tier are stored in your Log Analytics workspace so that you can investigate, search, and audit the events in your workspace. The Log Analytics agent also collects and analyzes the security events required for Defender for Cloud’s threat protection.
Requirements
The enhanced security protections of Defender for Cloud are required for storing Windows security event data. Learn more about the enhanced protection plans.
You might be charged for storing data in Log Analytics. For more information, see the pricing page.
Information for Microsoft Sentinel users
Security events collection within the context of a single workspace can be configured from either Microsoft Defender for Cloud or Microsoft Sentinel, but not both. If you want to add Microsoft Sentinel to a workspace that already gets alerts from Microsoft Defender for Cloud and to collect Security Events, you can either:
- Leave the Security Events collection in Microsoft Defender for Cloud as is. You'll be able to query and analyze these events in both Microsoft Sentinel and Defender for Cloud. If you want to monitor the connector's connectivity status or change its configuration in Microsoft Sentinel, consider the second option.
- Disable Security Events collection in Microsoft Defender for Cloud and then add the Security Events connector in Microsoft Sentinel. You'll be able to query and analyze events in both Microsoft Sentinel, and Defender for Cloud, but you'll also be able to monitor the connector's connectivity status or change its configuration in - and only in - Microsoft Sentinel. To disable Security Events collection in Defender for Cloud, set Windows security events to None in the configuration of your Log Analytics agent.
What event types are stored for "Common" and "Minimal"?
The Common and Minimal event sets were designed to address typical scenarios based on customer and industry standards for the unfiltered frequency of each event and their usage.
- Minimal - This set is intended to cover only events that might indicate a successful breach and important events with low volume. Most of the data volume of this set is successful user logon (event ID 4624), failed user logon events (event ID 4625), and process creation events (event ID 4688). Sign out events are important for auditing only and have relatively high volume, so they aren't included in this event set.
- Common - This set is intended to provide a full user audit trail, including events with low volume. For example, this set contains both user logon events (event ID 4624) and user logoff events (event ID 4634). We include auditing actions like security group changes, key domain controller Kerberos operations, and other events that are recommended by industry organizations.
Here's a complete breakdown of the Security and App Locker event IDs for each set:
| Data tier | Collected event indicators |
|---|---|
| Minimal | 1102,4624,4625,4657,4663,4688,4700,4702,4719,4720,4722,4723,4724,4727,4728,4732,4735,4737,4739,4740,4754,4755, |
| 4756,4767,4799,4825,4946,4948,4956,5024,5033,8001,8002,8003,8004,8005,8006,8007,8222 | |
| Common | 1,299,300,324,340,403,404,410,411,412,413,431,500,501,1100,1102,1107,1108,4608,4610,4611,4614,4622, |
| 4624,4625,4634,4647,4648,4649,4657,4661,4662,4663,4665,4666,4667,4688,4670,4672,4673,4674,4675,4689,4697, | |
| 4700,4702,4704,4705,4716,4717,4718,4719,4720,4722,4723,4724,4725,4726,4727,4728,4729,4733,4732,4735,4737, | |
| 4738,4739,4740,4742,4744,4745,4746,4750,4751,4752,4754,4755,4756,4757,4760,4761,4762,4764,4767,4768,4771, | |
| 4774,4778,4779,4781,4793,4797,4798,4799,4800,4801,4802,4803,4825,4826,4870,4886,4887,4888,4893,4898,4902, | |
| 4904,4905,4907,4931,4932,4933,4946,4948,4956,4985,5024,5033,5059,5136,5137,5140,5145,5632,6144,6145,6272, | |
| 6273,6278,6416,6423,6424,8001,8002,8003,8004,8005,8006,8007,8222,26401,30004 |
Note
- If you are using Group Policy Object (GPO), it is recommended that you enable audit policies Process Creation Event 4688 and the CommandLine field inside event 4688. For more information about Process Creation Event 4688, see Defender for Cloud's common questions. For more information about these audit policies, see Audit Policy Recommendations.
- To enable data collection for Adaptive application controls, Defender for Cloud configures a local AppLocker policy in Audit mode to allow all applications. This will cause AppLocker to generate events which are then collected and leveraged by Defender for Cloud. It is important to note that this policy will not be configured on any machines on which there is already a configured AppLocker policy.
- To collect Windows Filtering Platform Event ID 5156, you need to enable Audit Filtering Platform Connection (Auditpol /set /subcategory:"Filtering Platform Connection" /Success:Enable)
Setting the security event option at the workspace level
You can define the level of security event data to store at the workspace level.
From Defender for Cloud's menu in the Azure portal, select Environment settings.
Select the relevant workspace. The only data collection events for a workspace are the Windows security events described on this page.

Select the amount of raw event data to store and select Save.

Manual agent provisioning
To manually install the Log Analytics agent:
In the Azure portal, navigate to the Defender for Cloud's Environment Settings page.
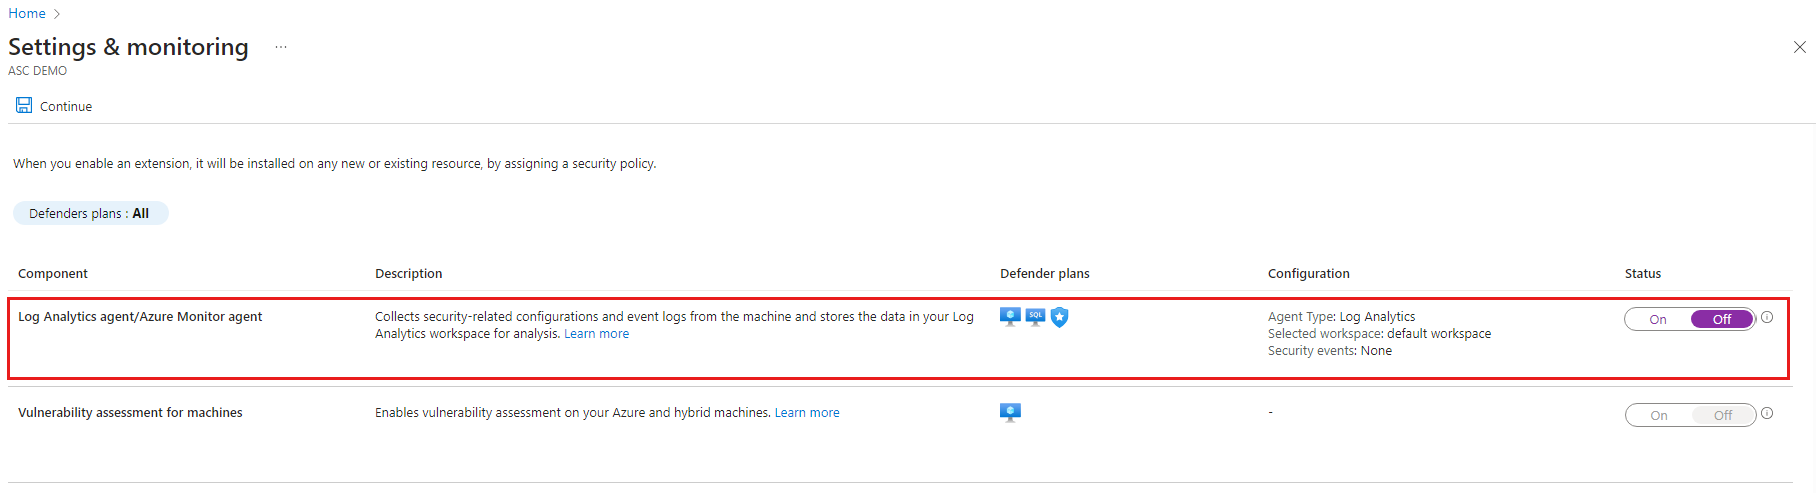
Select the relevant subscription and then select Settings & monitoring.
Turn Log Analytics agent/Azure Monitor Agent Off.
Optionally, create a workspace.
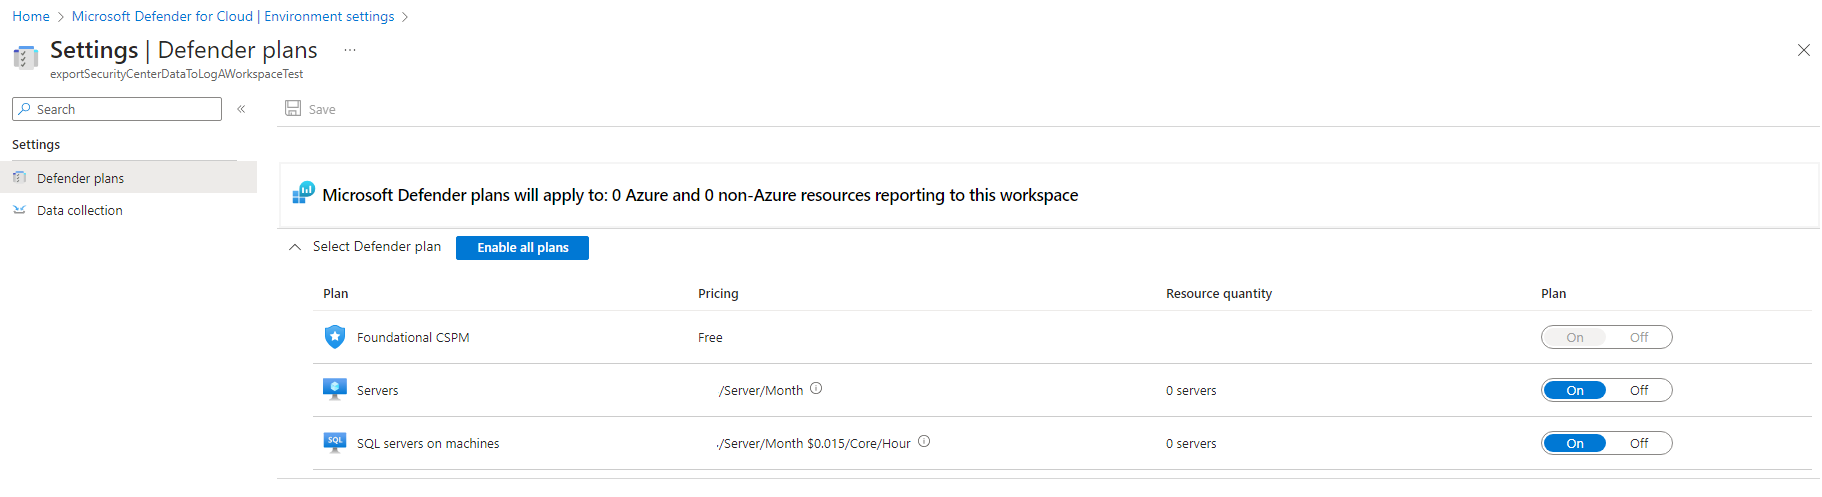
Enable Microsoft Defender for Cloud on the workspace on which you're installing the Log Analytics agent:
From Defender for Cloud's menu, open Environment settings.
Set the workspace on which you're installing the agent. Make sure the workspace is in the same subscription you use in Defender for Cloud and that you have read/write permissions for the workspace.
Select one or both "Servers" or "SQL servers on machines"(Foundational CSPM is the free default), and then select Save.
Note
If the workspace already has a Security or SecurityCenterFree solution enabled, the pricing will be set automatically.
To deploy agents on new VMs using a Resource Manager template, install the Log Analytics agent:
To deploy agents on your existing VMs, follow the instructions in Collect data about Azure Virtual Machines (the section Collect event and performance data is optional).
To use PowerShell to deploy the agents, use the instructions from the virtual machines documentation:


Tip
For more information about onboarding, see Automate onboarding of Microsoft Defender for Cloud using PowerShell.
To turn off monitoring components:
- Go to the Defender plans and turn off the plan that uses the extension and select Save.
- For Defender plans that have monitoring settings, go to the settings of the Defender plan, turn off the extension, and select Save.
Note
- Disabling extensions does not remove the extensions from the effected workloads.
- For information on removing the OMS extension, see How do I remove OMS extensions installed by Defender for Cloud.
Feedback
Coming soon: Throughout 2024 we will be phasing out GitHub Issues as the feedback mechanism for content and replacing it with a new feedback system. For more information see: https://aka.ms/ContentUserFeedback.
Submit and view feedback for