Note
Access to this page requires authorization. You can try signing in or changing directories.
Access to this page requires authorization. You can try changing directories.
Azure DevOps Services | Azure DevOps Server | Azure DevOps Server 2022
Pipeline logs provide a powerful tool for determining the cause of pipeline failures, and verbose logs can be configured to provide more diagnostic information.
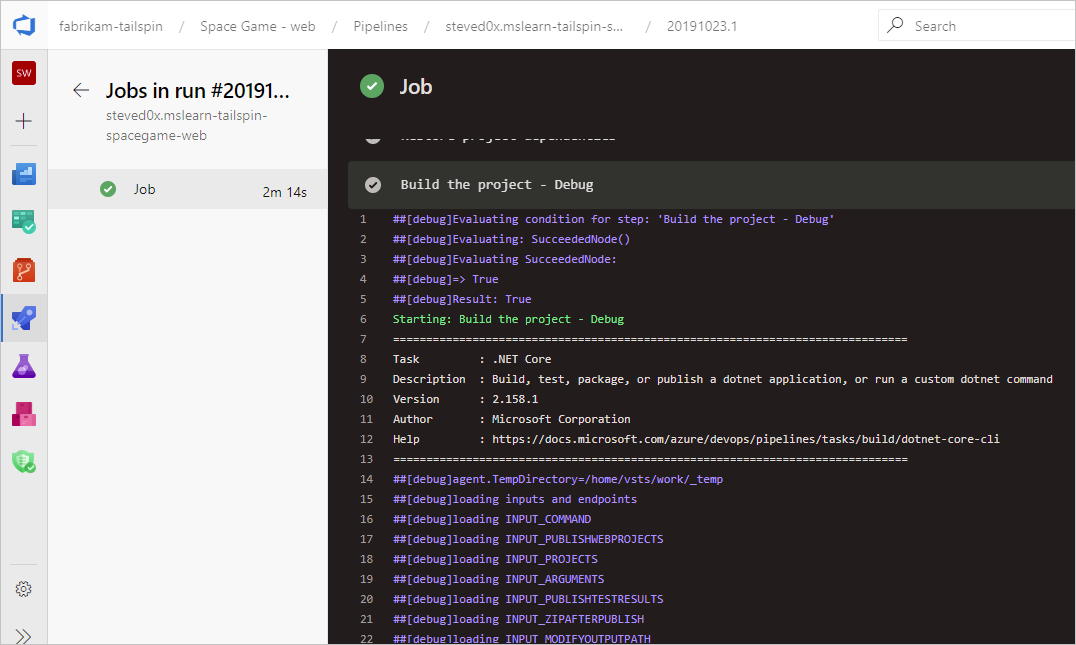
A typical starting point is to review the logs in your completed build or release. You can view logs by navigating to the pipeline run summary and selecting the job and task. If a certain task is failing, check the logs for that task. Configure verbose logs to include more diagnostic information.
Configure verbose logs
To assist with troubleshooting, you can configure your logs to be more verbose.
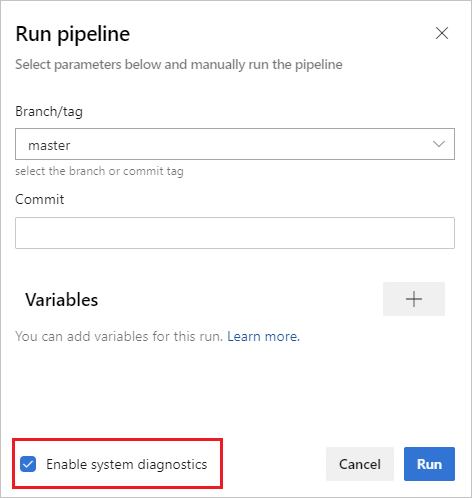
To configure verbose logs for a single run, you can start a new build by choosing Run pipeline and selecting Enable system diagnostics, Run.
To configure verbose logs for all runs, you can add a variable named
system.debugand set its value totrue.
Azure pipeline logs can now capture resource utilization metrics such as memory, CPU usage and available disk space. The logs also include resources used by the pipeline agent and child processes including tasks run in a job. If you suspect your pipeline job may run into resource constraints, enable verbose logs to have resource utilization information injected into pipeline logs. Resource utilization metrics are available on any agent, independent from hosting model.
To view the captured resource utilization metrics, search the logs for Agent environment resources entries for each step.
2024-02-28T17:41:15.1315148Z ##[debug]Agent environment resources - Disk: D:\ Available 12342.00 MB out of 14333.00 MB, Memory: Used 1907.00 MB out of 7167.00 MB, CPU: Usage 17.23%
View and download logs
To view individual logs for each step, navigate to the build results for the run, and select the job and step.
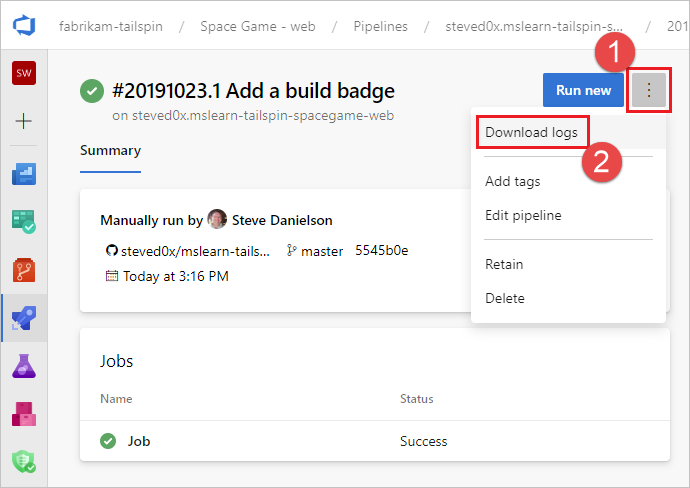
To download all logs, navigate to the build results for the run, select ..., and choose Download logs.
In addition to the pipeline diagnostic logs, the following specialized log types are available, and may contain information to help you troubleshoot.
Worker diagnostic logs
You can get the diagnostic log of the completed build generated by the worker process on the build agent. Look for the worker log file that has the date and time stamp of your completed build. For example, worker_20160623-192022-utc_6172.log.
Agent diagnostic logs
Agent diagnostic logs provide a record of how the agent was configured and what happened when it ran. Look for the agent log files. For example, agent_20160624-144630-utc.log. There are two kinds of agent log files:
The log file generated when you ran
config.cmd. This log:Includes this line near the top:
Adding Command: configureShows the configuration choices made.
The log file generated when you ran
run.cmd. This log:Cannot be opened until the process is terminated.
Attempts to connect to your Azure DevOps organization or Team Foundation Server.
Shows when each job was run, and how it completed
Both logs show how the agent capabilities were detected and set.
Network diagnostics for self-hosted agents
Set the value of Agent.Diagnostic to true to collect additional logs that can be used for troubleshooting network issues for self-hosted agents.
| File | Information | Applies to |
|---|---|---|
cloudinit.* |
Cloud-init completed successfully (if used) | Linux |
BrokenPackages.* |
Packages are in a consistent state | Linux |
Agent.* |
Environment variables | Linux, Windows |
waagentConf.txt |
Azure VM agent (waagent.conf) | Azure: Linux, Windows |
environment.txt / agent.* |
Account group membership list | Windows |
Note
Agent.Diagnostic is set to true automatically when System.Debug is set to true.
The Agent.Diagnostic variable and logs described in this section are available with Agent v2.200.0 and higher.
For more information, see agent troubleshooting in the microsoft/azure-pipelines-agent Azure Pipelines agent open-source agent repository.
Other logs
Inside the diagnostic logs you will find environment.txt and capabilities.txt.
The environment.txt file has various information about the environment within which your build ran. This includes information like what tasks are run, whether or not the firewall is enabled, PowerShell version info, and some other items. We continually add to this data to make it more useful.
The capabilities.txt file provides a clean way to see all capabilities installed on the build machine
that ran your build.
HTTP trace logs
Important
HTTP traces and trace files can contain passwords and other secrets. Do not post them on a public sites.
Use built-in HTTP tracing
If your agent is version 2.114.0 or newer, you can trace the HTTP traffic headers and write them into the diagnostic log. Set the VSTS_AGENT_HTTPTRACE environment variable before you launch the agent.listener.
Windows:
    set VSTS_AGENT_HTTPTRACE=true

macOS/Linux:
    export VSTS_AGENT_HTTPTRACE=true
Use full HTTP tracing - Windows
Start Fiddler.
We recommend you listen only to agent traffic. File > Capture Traffic off (F12)
Enable decrypting HTTPS traffic. Tools > Fiddler Options > HTTPS tab. Decrypt HTTPS traffic
Let the agent know to use the proxy:
set VSTS_HTTP_PROXY=http://127.0.0.1:8888Run the agent interactively. If you're running as a service, you can set as the environment variable in control panel for the account the service is running as.
Restart the agent.
Use full HTTP tracing - macOS and Linux
Use Charles Proxy (similar to Fiddler on Windows) to capture the HTTP trace of the agent.
Start Charles Proxy.
Charles: Proxy > Proxy Settings > SSL Tab. Enable. Add URL.
Charles: Proxy > Mac OSX Proxy. Recommend disabling to only see agent traffic.
export VSTS_HTTP_PROXY=http://127.0.0.1:8888Run the agent interactively. If it's running as a service, you can set in the .env file. See nix service
Restart the agent.
Capture custom logs
In addition to the built-in logs, you can use tasks and scripts to capture custom logs in your pipeline. The following examples show how to capture resource utilization, network traces, memory dumps, and perfview traces. If you are working with customer support, you may be asked to capture logs such as these.
- Capture resource utilization details
- Capture a dotnet process memory dump using ProcDump
- Capture ETW traces for a hosted agent
- Capture perfview traces for Visual Studio build
Retrieve custom logs
After capturing a custom log in your pipeline, you must upload it so that it can be retrieved for review. You can upload the custom log as part of the standard pipeline logs, or you can upload it as an artifact. The examples in the following sections show both ways of uploading custom logs.
Upload a log as part of the standard logs
To upload the custom log as part of the standard pipeline logs, use ##vso[task.uploadfile] to upload the desired file. To use this command, specify it as part of a script command as shown in the following example. The file can be downloaded and viewed as part of the standard pipeline logs. The ##vso[task.uploadfile] method is good for uploading a single log file. If you have more than one log file, you must use a separate ##vso[task.uploadfile] line for each file.
- pwsh: Write-Host "##vso[task.uploadfile]$(Agent.TempDirectory)\resource-usage.txt"
For more information, see Logging commands and UploadFile: Upload a file that can be downloaded with task logs.
Upload a log as a pipeline artifact
To upload a custom log as a pipeline artifact, use the PublishPipelineArtifact@1 task. PublishPipelineArtifact@1 can upload a single file or the files in a directory path, and is useful if you have many custom log files to upload.
- task: PublishPipelineArtifact@1
  inputs:
    targetPath: '$(Pipeline.Workspace)/s/trace'
    artifact: 'file_result.pcap'
    publishLocation: 'pipeline'
For more information, see Publish Pipeline Artifacts.
Capture resource utilization details
When using Azure DevOps Services, you can see resource utilization in the logs, including disk usage, memory usage, and CPU utilization, by enabling verbose logs. When the pipeline completes, search the logs for Agent environment resources entries for each step.
2024-02-28T17:41:15.1315148Z ##[debug]Agent environment resources - Disk: D:\ Available 12342.00 MB out of 14333.00 MB, Memory: Used 1907.00 MB out of 7167.00 MB, CPU: Usage 17.23%
If you are using Azure DevOps Server, or if you want to collect additional metrics, you can use PowerShell to capture resource utilization and upload it to the pipeline logs. When the pipeline run completes, you can download the pipeline logs and view the captured data. If the Upload resource usage from pipeline run step is the sixth step in the job, the filename in the logs will be 6_resource-usage.txt.
# Place this task in your pipeline to log the current resource utilization
# of the pipeline. This task appends the specified resource usage to a logfile
# which is uploaded at the end of the current pipeline job.
- pwsh: |
      $logFile = '$(Agent.TempDirectory)\resource-usage.txt'
      if (!(Test-Path $logFile))
      {
        New-Item $logFile
      }
      Get-Date | Out-File -FilePath $logFile -Append
      Get-Volume | Out-File -FilePath $logFile -Append
      Get-Counter '\Memory\Available MBytes' | Out-File -FilePath $logFile -Append
      Get-Counter '\Processor(_Total)\% Processor Time' | Out-File -FilePath $logFile -Append
      sleep 10
  displayName: 'Check resource utilization'

# Other tasks here, and you can repeat the "Check resource utilization"
# step if desired, and the results will be appended to the resource-usage.txt file

- pwsh: Write-Host "##vso[task.uploadfile]$(Agent.TempDirectory)\resource-usage.txt"
  displayName: 'Upload resource usage from pipeline run'
  condition: always()
Capture a dotnet process memory dump using ProcDump
If you have a test execution that crashes, customer support may ask you to capture a memory dump of the dotnet process after the failed test execution. Add the following task after your Visual Studio Test task with condition: always(). When the pipeline run completes, you can download the pipeline logs, including the memory dump.
# Run this task after your test execution crashes
# with a condition of alway() so that it always runs
- pwsh: |
    Invoke-WebRequest https://download.sysinternals.com/files/Procdump.zip -OutFile $(Agent.TempDirectory)\Procdump.zip
    mkdir $(Agent.TempDirectory)\Procdump
    unzip $(Agent.TempDirectory)\Procdump.zip -d Procdump
    cd $(Agent.TempDirectory)\Procdump
    Get-Process dotnet | % { $(Agent.TempDirectory)\procdump.exe -accepteula -ma $_.Id dotnet-$($_.Id).dmp }
    Compress-Archive *.dmp -DestinationPath $(Agent.TempDirectory)\dump_files.zip
    Write-Host "##vso[task.uploadfile]$(Agent.TempDirectory)\dump_files.zip"
  condition: always()
  displayName: 'Create and upload a dotnet process memory dump'
Capture ETW traces for a hosted agent
If you are troubleshooting network issues with Microsoft-hosted agents, customer support may ask you to collect ETW traces. When the pipeline run completes, you can download the pipeline logs, including the ETW traces.
# Add this task to start the ETW trace
- script: netsh trace start scenario=InternetClient capture=yes tracefile=$(Agent.TempDirectory)\networktrace.etl
  displayName: 'Start ETW trace'

# Other tasks here

# Add these 2 tasks to stop the trace and upload
# the trace to the pipeline logs
- script: netsh trace stop
  displayName: 'Stop ETW trace'

- pwsh: |
    Write-Host "##vso[task.uploadfile]$(Agent.TempDirectory)\networktrace.etl"
    Write-Host "##vso[task.uploadfile]$(Agent.TempDirectory)\networktrace.cab"
  displayName: 'Upload ETW trace logs'
Capture perfview traces for Visual Studio build
If customer support asks you to create a perfview trace of your Visual Studio build, add the following tasks to your pipeline before and after your Visual Studio build step.
After running the pipeline, you can download the PerfViewLog artifact from the pipeline run details and send that file customer support.
steps:
- task: PowerShell@2 # download the perfview exe
  inputs:
    targetType: 'inline'
    script: |
      invoke-webrequest https://github.com/microsoft/perfview/releases/download/v3.1.7/PerfView.exe -OutFile PerfView.exe

- task: PowerShell@2
  inputs:
    targetType: 'inline' # start perfview to capture the traces before build build task
    script: '$(System.DefaultWorkingDirectory)\PerfView.exe "/DataFile:PerfViewData.etl" /accepteula /BufferSizeMB:512 /StackCompression /CircularMB:5000 /Providers:"Microsoft-Windows-IIS" /logfile:"PerfView.log" /zip:true /norundown start'

- task: VSBuild@1
  displayName: '$(solution)' # build of the solution, note the msbuildargs might be different for your scenario
  inputs:
    solution: '$(solution)'
    clean: true
    msbuildArgs: '/p:DeployOnBuild=true /p:PrecompileBeforePublish=true /p:WebPublishMethod=Package /p:PackageAsSingleFile=true /p:SkipInvalidConfigurations=true /p:PackageLocation="$(Build.ArtifactStagingDirectory)" /p:TransformWebConfigEnabled=false /p:AutoParameterizationWebConfigConnectionStrings=false /p:MarkWebConfigAssistFilesAsExclude=false /p:ProfileTransformWebConfigEnabled=false /p:IsTransformWebConfigDisabled=true'
    platform: '$(buildPlatform)'
    configuration: '$(buildConfiguration)'

- task: PowerShell@2 # stop the perfview tracing
  inputs:
    targetType: 'inline'
    script: |
      $(System.DefaultWorkingDirectory)\perfview.exe /accepteula /logfile:"PerfView.log" stop

- task: PowerShell@2 # abort perfview, it seems required.
  inputs:
    targetType: 'inline'
    script: '$(System.DefaultWorkingDirectory)\perfview.exe /accepteula /logfile:"PerfView.log" abort'

- task: PowerShell@2 # add a sleep of 5 mins, to give it time for required traces to be complete
  inputs:
    targetType: 'inline'
    script: 'Start-Sleep -Seconds 300'

- task: PublishPipelineArtifact@1 # upload the traces
  displayName: 'Publish Pipeline Artifact'
  inputs:
    artifactName: webapp