Note
Access to this page requires authorization. You can try signing in or changing directories.
Access to this page requires authorization. You can try changing directories.
APPLIES TO:
 Azure CLI ml extension v2 (current)
Python SDK azure-ai-ml v2 (current)
Azure CLI ml extension v2 (current)
Python SDK azure-ai-ml v2 (current)
Learn how to use the Microsoft Visual Studio Code debugger to test and debug online endpoints locally before deploying them to Azure.
Azure Machine Learning local endpoints help you test and debug your scoring script, environment configuration, code configuration, and machine learning model locally.
Important
This feature is currently in public preview. This preview version is provided without a service-level agreement, and we don't recommend it for production workloads. Certain features might not be supported or might have constrained capabilities.
For more information, see Supplemental Terms of Use for Microsoft Azure Previews.
Debugging endpoints locally before deploying them to the cloud can help you catch errors in your code and configuration earlier. You have different options for debugging endpoints locally with Visual Studio Code.
- Azure Machine Learning inference HTTP server
- Local endpoint
This guide focuses on local endpoints.
The following table provides an overview of scenarios to help you choose what works best for you.
| Scenario | Inference HTTP server | Local endpoint |
|---|---|---|
| Update local Python environment, without Docker image rebuild | Yes | No |
| Update scoring script | Yes | Yes |
| Update deployment configurations (deployment, environment, code, model) | No | Yes |
| Visual Studio Code debugger integration | Yes | Yes |
Prerequisites
This guide assumes you have the following items installed locally on your PC.
For more information, see the guide on how to prepare your system to deploy online endpoints.
The examples in this article are based on code samples contained in the azureml-examples GitHub repository. To run the commands locally without having to copy/paste YAML and other files, clone the repo and then change directories to azureml-examples/cli:
git clone https://github.com/Azure/azureml-examples --depth 1
cd azureml-examples/cli
If you haven't already set the defaults for the Azure CLI, save your default settings. To avoid passing in the values for your subscription, workspace, and resource group multiple times, use the following commands. Replace the following parameters with values for your specific configuration:
- Replace
<subscription>with your Azure subscription ID. - Replace
<workspace>with your Azure Machine Learning workspace name. - Replace
<resource-group>with the Azure resource group that contains your workspace. - Replace
<location>with the Azure region that contains your workspace.
az account set --subscription <subscription>
az configure --defaults workspace=<workspace> group=<resource-group> location=<location>
Tip
You can see what your current defaults are by using the az configure -l command.
Launch development container
Azure Machine Learning local endpoints use Docker and Visual Studio Code development containers (dev containers) to build and configure a local debugging environment. With dev containers, you can take advantage of Visual Studio Code features from inside a Docker container. For more information on dev containers, see Create a development container.
To debug online endpoints locally in Visual Studio Code, use the --vscode-debug flag when creating or updating and Azure Machine Learning online deployment. The following command uses a deployment example from the examples repo:
az ml online-deployment create --file endpoints/online/managed/sample/blue-deployment.yml --local --vscode-debug
Important
On Windows Subsystem for Linux (WSL), you'll need to update your PATH environment variable to include the path to the Visual Studio Code executable or use WSL interop. For more information, see Windows interoperability with Linux.
A Docker image is built locally. Any environment configuration or model file errors are surfaced at this stage of the process.
Note
The first time you launch a new or updated dev container, it can take several minutes.
Once the image successfully builds, your dev container opens in a Visual Studio Code window.
You'll use a few Visual Studio Code extensions to debug your deployments in the dev container. Azure Machine Learning automatically installs these extensions in your dev container.
Important
Before starting your debug session, make sure that the Visual Studio Code extensions have finished installing in your dev container.
Start debug session
Once your environment is set up, use the Visual Studio Code debugger to test and debug your deployment locally.
Open your scoring script in Visual Studio Code.
Tip
The score.py script used by the endpoint deployed earlier is located at azureml-samples/cli/endpoints/online/managed/sample/score.py in the repository you cloned. However, the steps in this guide work with any scoring script.
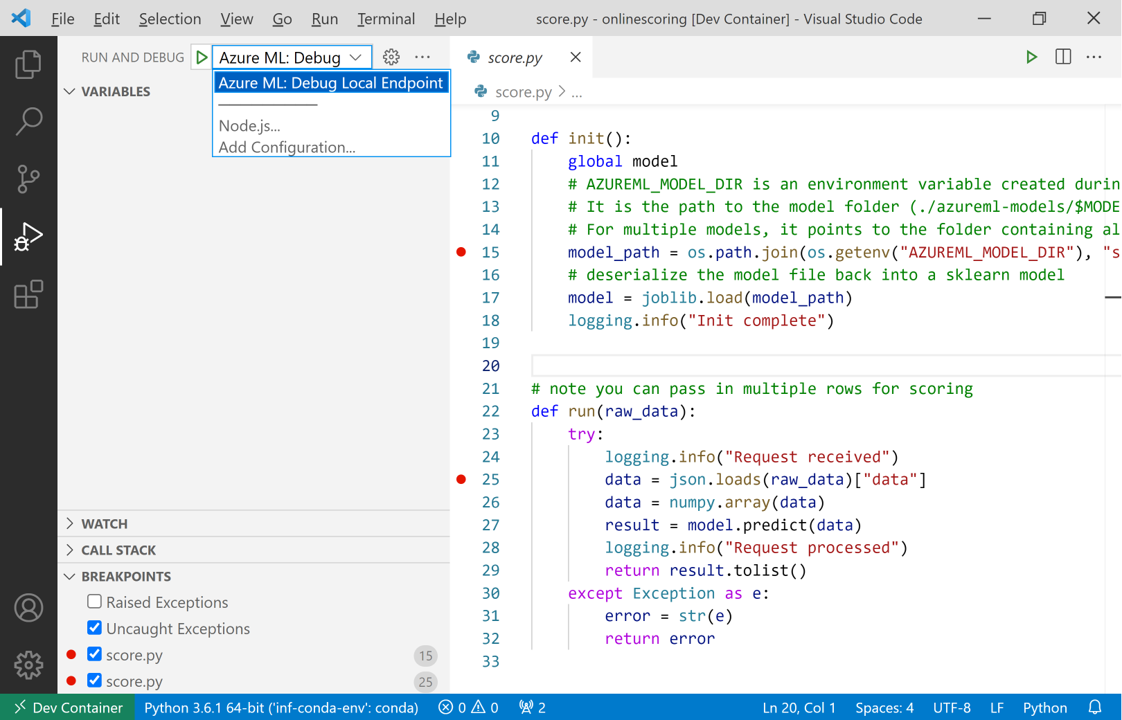
Set a breakpoint anywhere in your scoring script.
- To debug startup behavior, place your breakpoint(s) inside the
initfunction. - To debug scoring behavior, place your breakpoint(s) inside the
runfunction.
- To debug startup behavior, place your breakpoint(s) inside the
Select the Visual Studio Code Job view.
In the Run and Debug dropdown, select AzureML: Debug Local Endpoint to start debugging your endpoint locally.
In the Breakpoints section of the Run view, check that:
- Raised Exceptions is unchecked
- Uncaught Exceptions is checked
Select the play icon next to the Run and Debug dropdown to start your debugging session.
At this point, any breakpoints in your
initfunction are caught. Use the debug actions to step through your code. For more information on debug actions, see the debug actions guide.

For more information on the Visual Studio Code debugger, see Debugging.
Debug your endpoint
Now that your application is running in the debugger, try making a prediction to debug your scoring script.
Use the ml extension invoke command to make a request to your local endpoint.
az ml online-endpoint invoke --name <ENDPOINT-NAME> --request-file <REQUEST-FILE> --local
In this case, <REQUEST-FILE> is a JSON file that contains input data samples for the model to make predictions on similar to the following JSON:
{"data": [
    [1,2,3,4,5,6,7,8,9,10],
    [10,9,8,7,6,5,4,3,2,1]
]}
Tip
The scoring URI is the address where your endpoint listens for requests. Use the ml extension to get the scoring URI.
az ml online-endpoint show --name <ENDPOINT-NAME> --local
The output should look similar to the following:
{
 "auth_mode": "aml_token",
 "location": "local",
 "name": "my-new-endpoint",
 "properties": {},
 "provisioning_state": "Succeeded",
 "scoring_uri": "http://localhost:5001/score",
 "tags": {},
 "traffic": {},
 "type": "online"
}
The scoring URI can be found in the scoring_uri property.
At this point, any breakpoints in your run function are caught. Use the debug actions to step through your code. For more information on debug actions, see the debug actions guide.
Edit your endpoint
As you debug and troubleshoot your application, there are scenarios where you need to update your scoring script and configurations.
To apply changes to your code:
- Update your code.
- Restart your debug session using the
Developer: Reload Windowcommand in the command palette. For more information, see the command palette documentation.
Note
Since the directory containing your code and endpoint assets is mounted onto the dev container, any changes you make in the dev container are synced with your local file system.
For more extensive changes involving updates to your environment and endpoint configuration, use the ml extension update command. Doing so triggers a full image rebuild with your changes.
az ml online-deployment update --file <DEPLOYMENT-YAML-SPECIFICATION-FILE> --local --vscode-debug
Once the updated image is built and your development container launches, use the Visual Studio Code debugger to test and troubleshoot your updated endpoint.