Note
Access to this page requires authorization. You can try signing in or changing directories.
Access to this page requires authorization. You can try changing directories.
Azure Managed Instance for Apache Cassandra provides metrics and diagnostic logging through Azure Monitor.
Azure Managed Instance for Apache Cassandra metrics
You can visualize metrics for Azure Managed Instance for Apache Cassandra in the Azure portal by going to your cluster resource and selecting Metrics. You can then choose from the available metrics and aggregations.

Diagnostic settings in Azure
Azure Monitor uses diagnostic settings to collect resource logs, which are also called data plane logs. An Azure resource emits resource logs to provide rich, frequent data about its operations. Azure Monitor captures these logs per request. Examples of data plane operations include delete, insert, and readFeed. The content of these logs varies by resource type.
Platform metrics and activity logs are collected automatically. You must create a diagnostic setting to collect resource logs or to forward them outside Azure Monitor. You can turn on diagnostic settings for Azure Managed Instance for Apache Cassandra cluster resources and send resource logs to the following sources:
- Log Analytics workspace. Data sent to Log Analytics workspaces is written into Azure Diagnostics (legacy) or Resource-specific (preview) tables.
- Event hub.
- Storage account.
Note
We recommend that you create the diagnostic setting in resource-specific mode.
Create diagnostic settings by using the Azure portal
Sign in to the Azure portal.
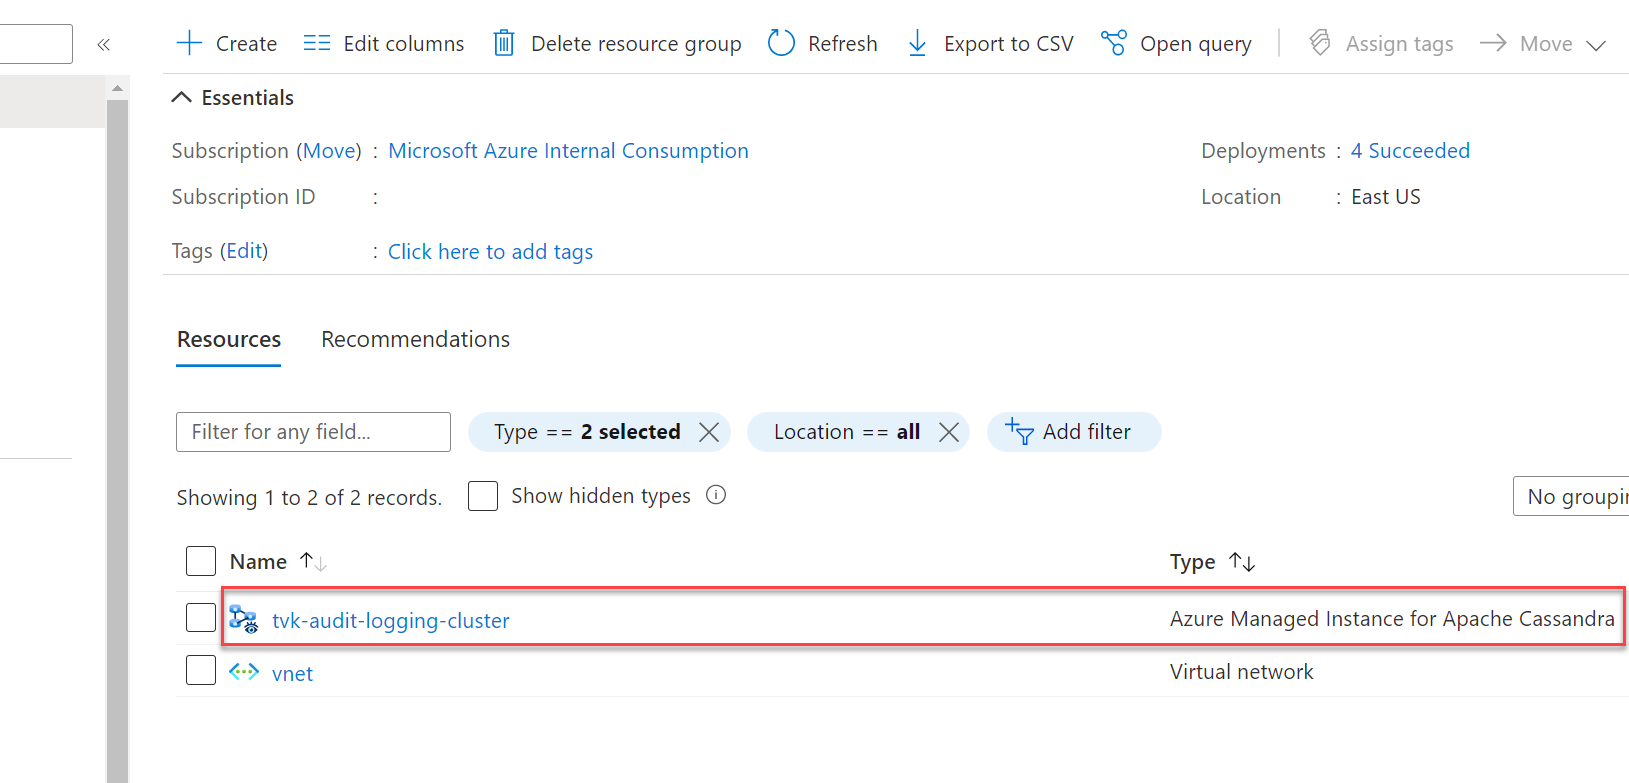
Go to your Azure Managed Instance for Apache Cassandra cluster resource.
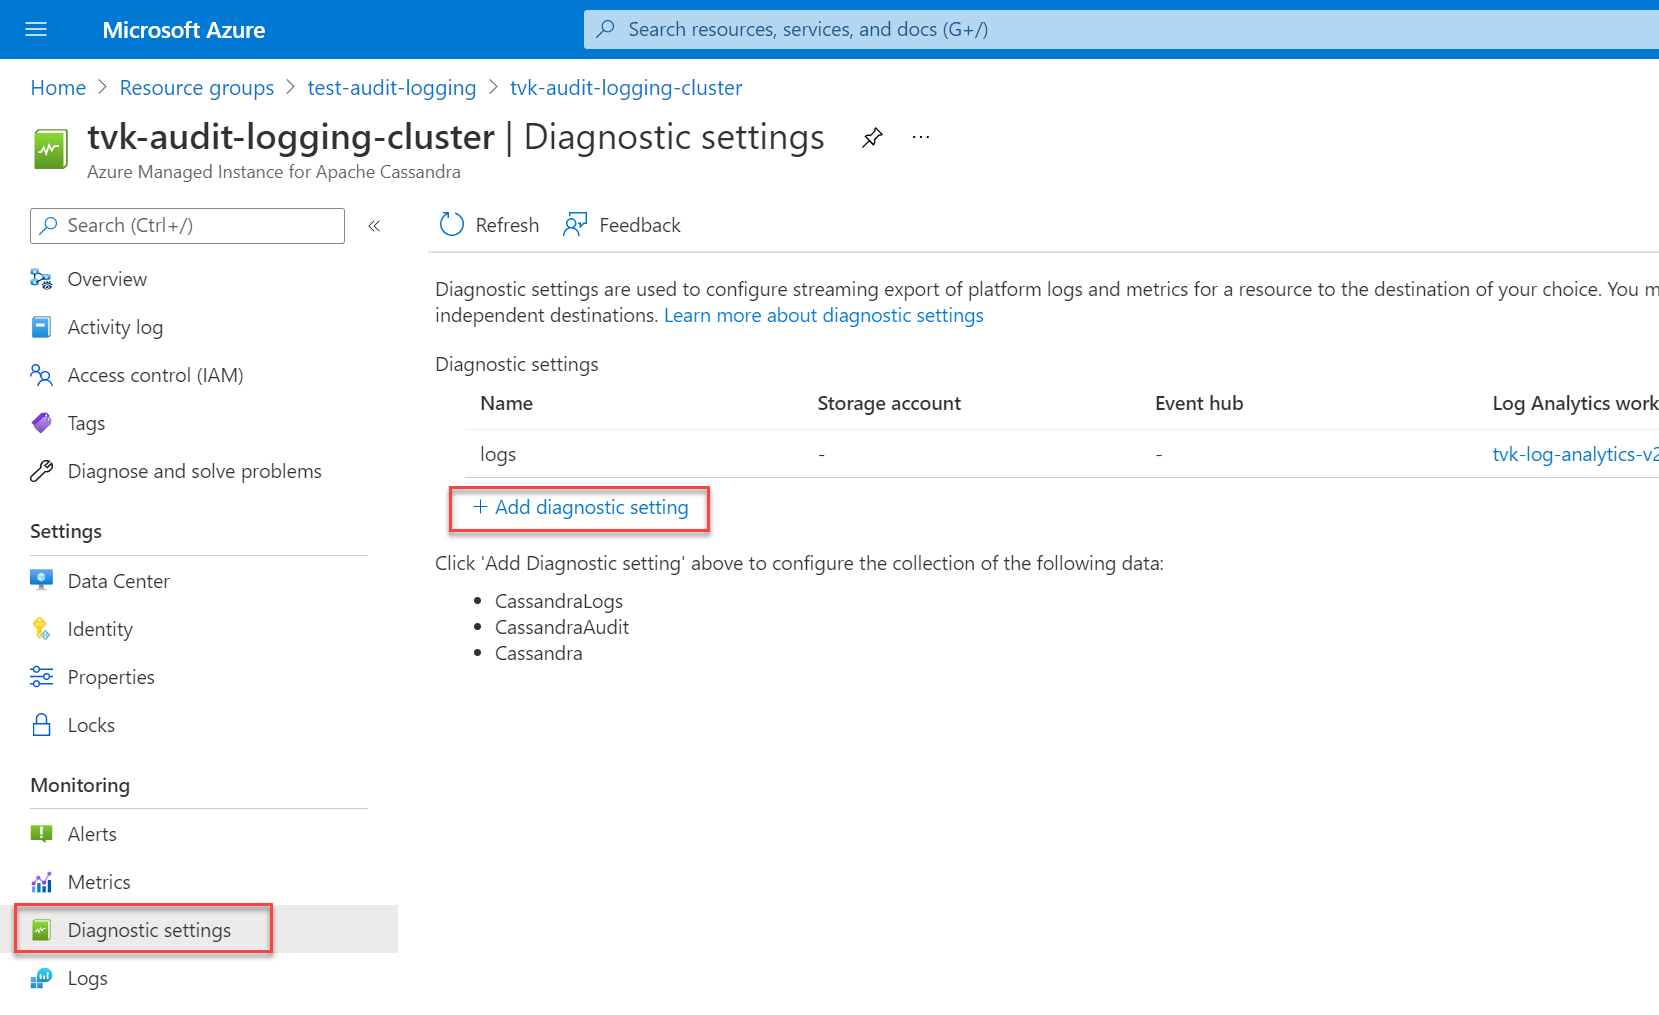
Select Diagnostic settings in the Monitoring section, and then select Add diagnostic setting.
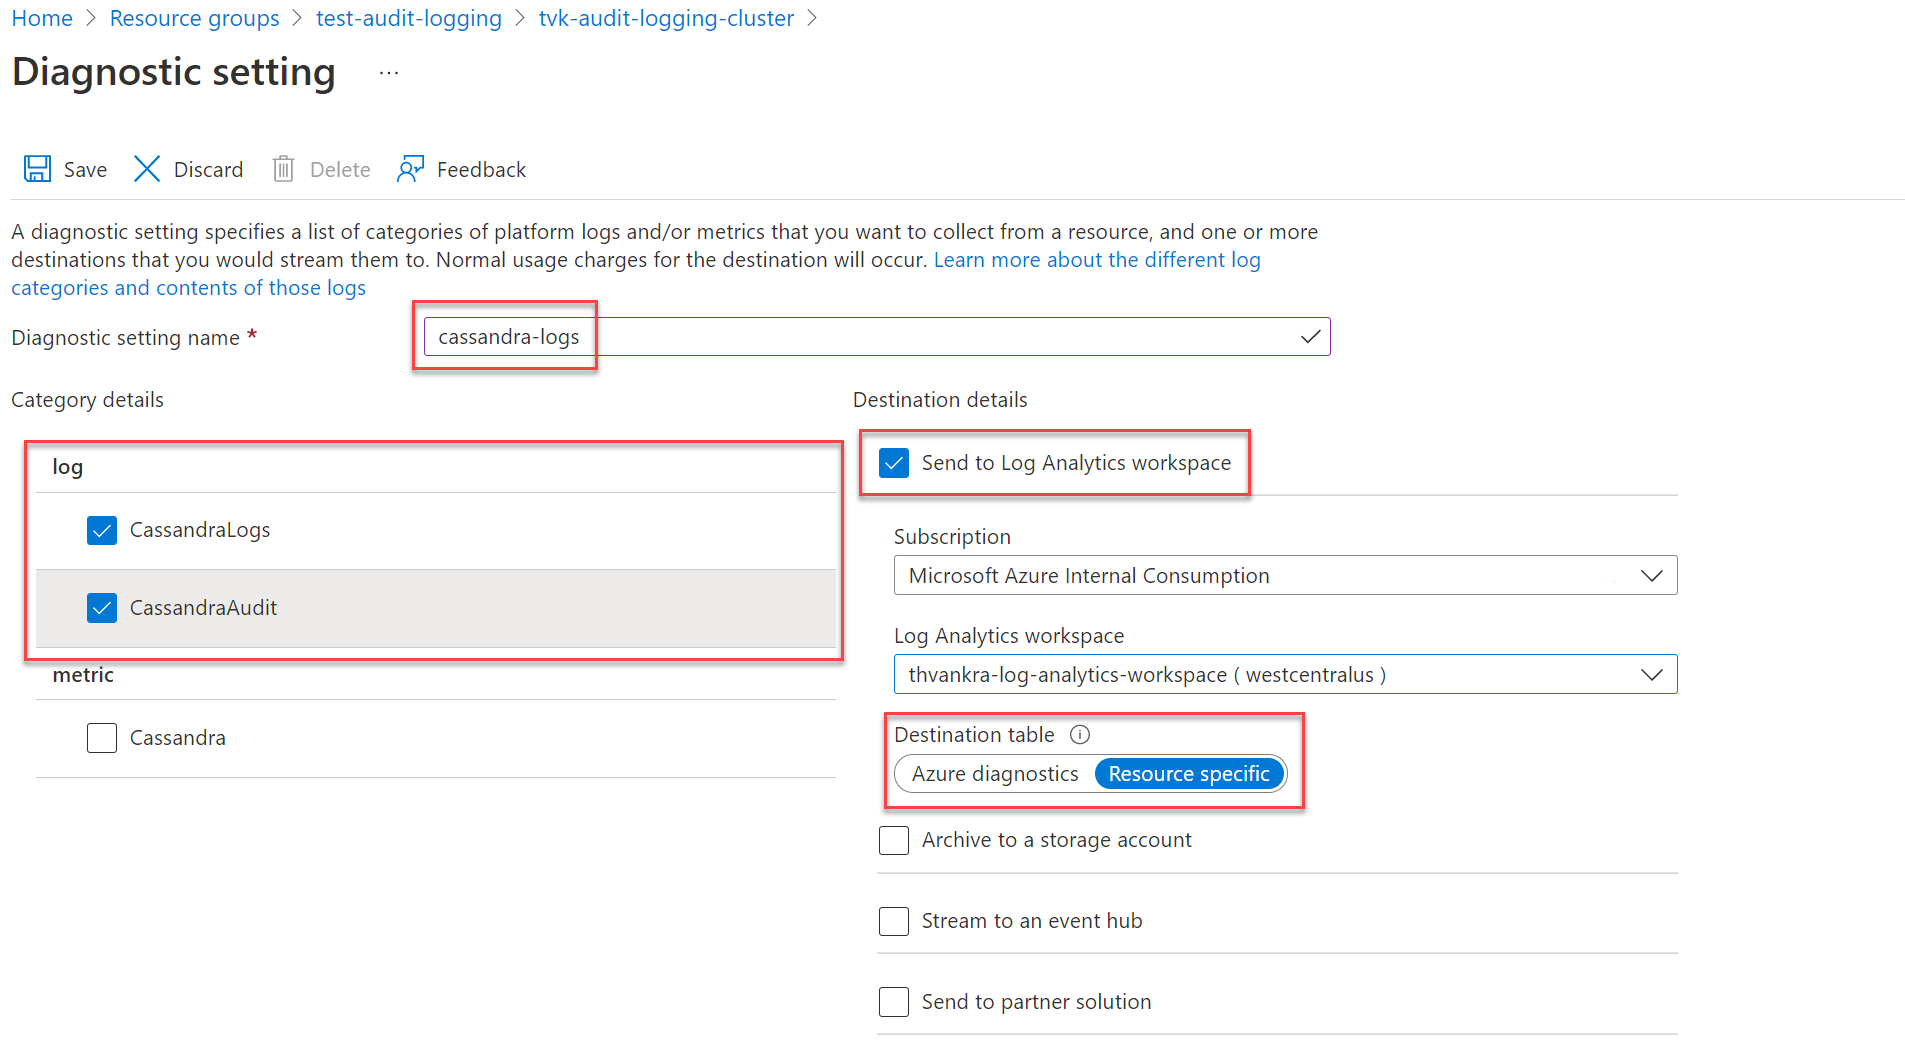
On the Diagnostic setting pane, choose a name for your setting.
Under Category details, select your categories. The CassandraLogs category records Cassandra server operations. The CassandraAudit category records audit and Cassandra Query Language (CQL) operations.
Under Destination details, choose your preferred destination for your logs. To send logs to a Log Analytics workspace, be sure to select Resource specific as the destination table.
Note
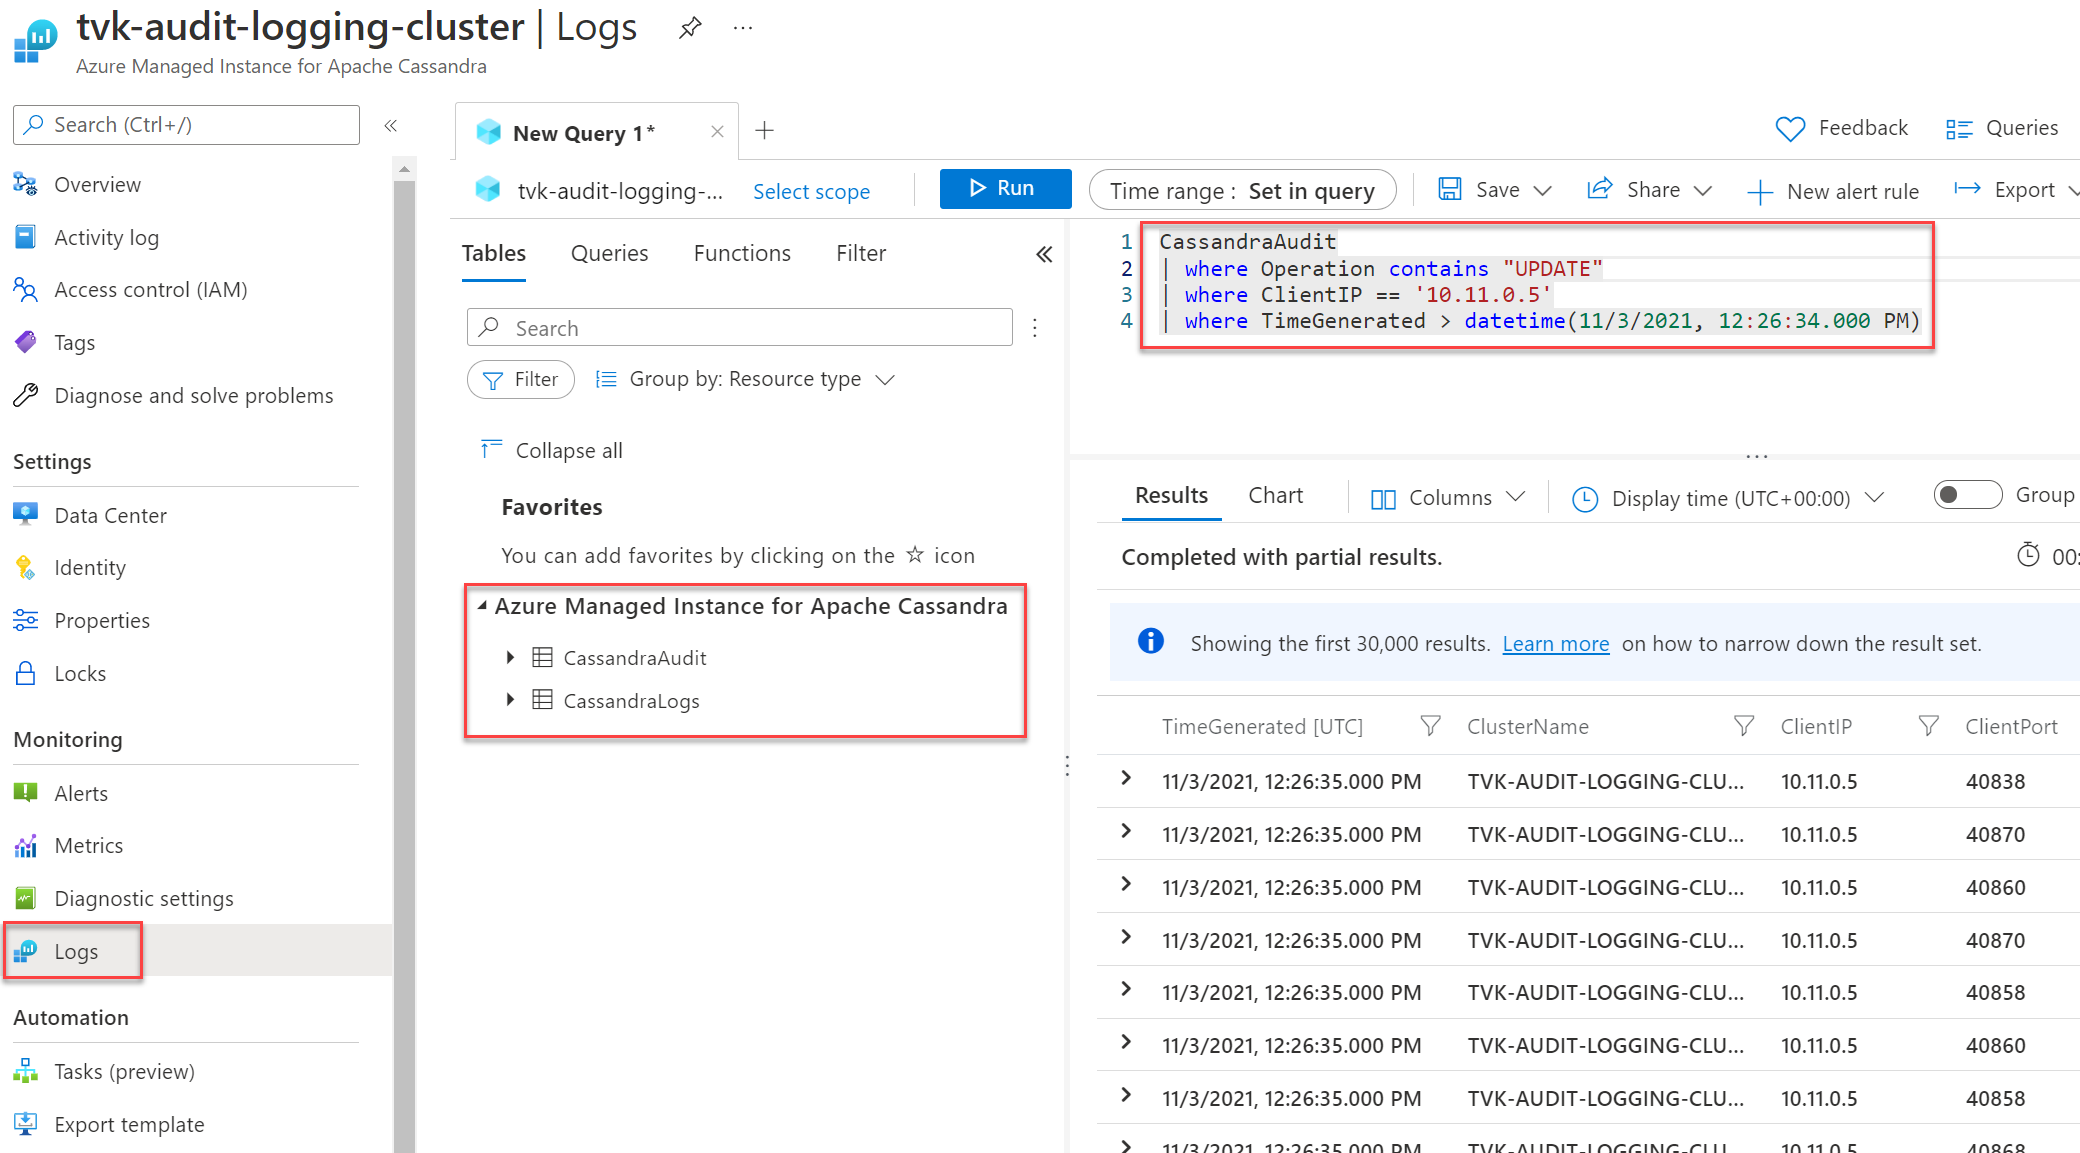
If you're sending logs to a Log Analytics workspace, they can take up to 20 minutes to appear. Until then, the resource-specific tables, shown under Azure Managed Instance for Apache Cassandra, aren't visible.
After you set up diagnostic logging and data is flowing, you can select Logs and query the available diagnostic logs by using Azure Data Explorer. For more information on Azure Monitor and Kusto Query Language, see Log queries in Azure Monitor.


Create a diagnostic setting by using the Azure CLI
To create a diagnostic setting by using the Azure CLI, use the az monitor diagnostic-settings create command:
logs='[{"category":"CassandraAudit","enabled":true,"retentionPolicy":{"enabled":true,"days":3}},{"category":"CassandraLogs","enabled":true,"retentionPolicy":{"enabled":true,"days":3}}]'
resourceId='/subscriptions/{SUBSCRIPTION_ID}/resourceGroups/{RESOURCE_GROUP}/providers/Microsoft.DocumentDB/cassandraClusters/{CLUSTER_NAME}'
workspace='/subscriptions/{SUBSCRIPTION_ID}/resourcegroups/{RESOURCE_GROUP}/providers/microsoft.operationalinsights/workspaces/{WORKSPACE_NAME}'

az monitor diagnostic-settings create  --name tvk-diagnostic-logs-cassandra --resource $resourceId --logs  $logs --workspace $workspace --export-to-resource-specific true
Create a diagnostic setting by using the REST API
Use the Azure Monitor REST API for creating a diagnostic setting by using the interactive console. For more information, see Diagnostic Settings.
Note
We recommend setting the logAnalyticsDestinationType property to Dedicated for enabling resource-specific tables.
Request
PUT
https://management.azure.com/{resource-id}/providers/microsoft.insights/diagnosticSettings/service?api-version={api-version}
Headers
| Parameters/Headers | Value/Description |
|---|---|
name |
The name of your diagnostic setting |
resourceUri |
subscriptions/{SUBSCRIPTION_ID}/resourceGroups/{RESOURCE_GROUP}/providers/Microsoft.DocumentDb/databaseAccounts/{ACCOUNT_NAME}/providers/microsoft.insights/diagnosticSettings/{DIAGNOSTIC_SETTING_NAME} |
api-version |
2017-05-01-preview |
Content-Type |
application/json |
Body
{
    "id": "/subscriptions/{SUBSCRIPTION_ID}/resourceGroups/{RESOURCE_GROUP}/providers/Microsoft.DocumentDb/databaseAccounts/{ACCOUNT_NAME}/providers/microsoft.insights/diagnosticSettings/{DIAGNOSTIC_SETTING_NAME}",
    "type": "Microsoft.Insights/diagnosticSettings",
    "name": "name",
    "location": null,
    "kind": null,
    "tags": null,
    "properties": {
        "storageAccountId": null,
        "serviceBusRuleId": null,
        "workspaceId": "/subscriptions/{SUBSCRIPTION_ID}/resourcegroups/{RESOURCE_GROUP}/providers/microsoft.operationalinsights/workspaces/{WORKSPACE_NAME}",
        "eventHubAuthorizationRuleId": null,
        "eventHubName": null,
        "logs": [
            {
                "category": "CassandraAudit",
                "categoryGroup": null,
                "enabled": true,
                "retentionPolicy": {
                    "enabled": false,
                    "days": 0
                }
            },
            {
                "category": "CassandraLogs",
                "categoryGroup": null,
                "enabled": true,
                "retentionPolicy": {
                    "enabled": false,
                    "days": 0
                }
            }
        ],
        "logAnalyticsDestinationType": "Dedicated"
    },
    "identity": null
}
Audit whitelist
Note
This article contains references to the term whitelist, which Microsoft no longer uses. When the term is removed from the software, we'll remove it from this article.
By default, audit logging creates a record for every sign-in attempt and CQL query. The result can be overwhelming and increase overhead. To manage this situation, you can use a whitelist to selectively include or exclude specific audit records.
Cassandra 3.11
In Cassandra 3.11, you can use the audit whitelist feature to set what operations don't create an audit record. The audit whitelist feature is enabled by default in Cassandra 3.11. To learn how to configure your whitelist, see Role-based whitelist management.
Examples:
To filter out all
SELECTandMODIFYoperations for the userbobfrom the audit log, run the following statements:cassandra@cqlsh> ALTER ROLE bob WITH OPTIONS = { 'GRANT AUDIT WHITELIST FOR SELECT' : 'data' }; cassandra@cqlsh> ALTER ROLE bob WITH OPTIONS = { 'GRANT AUDIT WHITELIST FOR MODIFY' : 'data' };To filter out all
SELECToperations on thedecisionstable in thedesignkeyspace for userjimfrom the audit log, run the following statement:cassandra@cqlsh> ALTER ROLE jim WITH OPTIONS = { 'GRANT AUDIT WHITELIST FOR SELECT' : 'data/design/decisions' };To revoke the whitelist for user
bobon all the user'sSELECToperations, run the following statement:cassandra@cqlsh> ALTER ROLE bob WITH OPTIONS = { 'REVOKE AUDIT WHITELIST FOR SELECT' : 'data' };To view current whitelists, run the following statement:
cassandra@cqlsh> LIST ROLES;
Cassandra 4 and later
In Cassandra 4 and later, you can configure your whitelist in the Cassandra configuration. For more information, see Update Cassandra configuration. The available options are as follows (reference: Cassandra documentation for audit logging):
audit_logging_options:
    included_keyspaces: <Comma separated list of keyspaces to be included in audit log, default - includes all keyspaces>
    excluded_keyspaces: <Comma separated list of keyspaces to be excluded from audit log, default - excludes no keyspace except system, system_schema and system_virtual_schema>
    included_categories: <Comma separated list of Audit Log Categories to be included in audit log, default - includes all categories>
    excluded_categories: <Comma separated list of Audit Log Categories to be excluded from audit log, default - excludes no category>
    included_users: <Comma separated list of users to be included in audit log, default - includes all users>
    excluded_users: <Comma separated list of users to be excluded from audit log, default - excludes no user>
The available categories are: QUERY, DML, DDL, DCL, OTHER, AUTH, ERROR, PREPARE.
Here's an example configuration:
audit_logging_options:
    included_keyspaces: keyspace1,keyspace2
    included_categories: AUTH,ERROR,DCL,DDL
By default, the configuration sets included_categories to AUTH,ERROR,DCL,DDL.
Next step
- For detailed information about how to create a diagnostic setting by using the Azure portal, the Azure CLI, or PowerShell, see Diagnostic settings in Azure Monitor.