Application map: Triage distributed applications
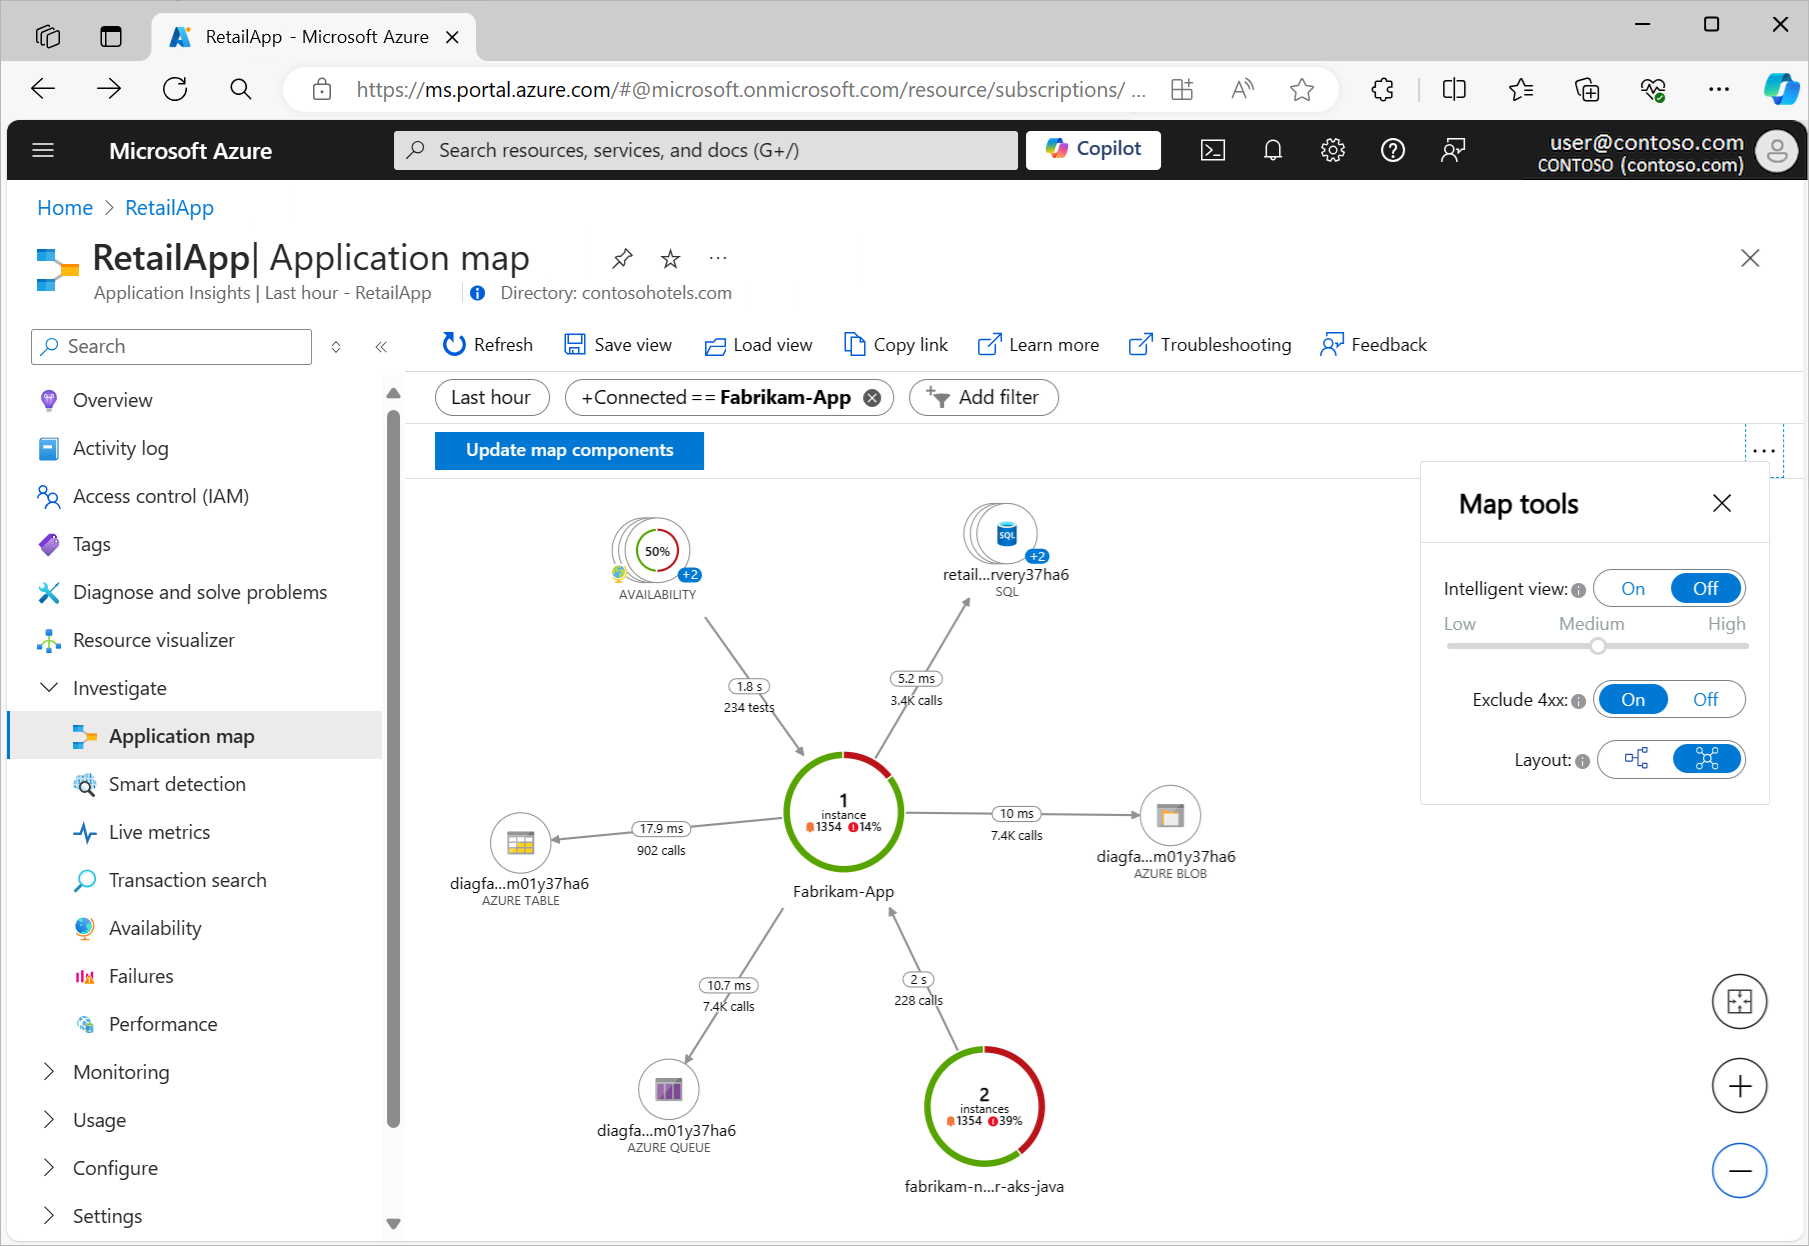
Developers use application maps to represent the logical structure of their distributed applications. A map is produced by identifying the individual application components with their roleName or name property in recorded telemetry. Circles (or nodes) on the map represent the components and directional lines (connectors or edges) show the HTTP calls from source nodes to target nodes.
Azure Monitor provides the Application map feature to help you quickly implement a map and spot performance bottlenecks or failure hotspots across all components. Each map node is an application component or its dependencies, and provides health KPI and alerts status. You can select any node to see detailed diagnostics for the component, such as Application Insights events. If your app uses Azure services, you can also select Azure diagnostics, such as SQL Database Advisor recommendations.
Application map also features Intelligent view to assist with fast service health investigations.
Understand components
Components are independently deployable parts of your distributed or microservice application. Developers and operations teams have code-level visibility or access to telemetry generated by these application components.
Some considerations about components:
- Components are different from "observed" external dependencies, such as Azure SQL and Azure Event Hubs, which your team or organization might not have access to (code or telemetry).
- Components run on any number of server, role, or container instances.
- Components can be separate Application Insights resources, even if subscriptions are different. They can also be different roles that report to a single Application Insights resource. The preview map experience shows the components regardless of how they're set up.
Explore Application map
Application map lets you see the full application topology across multiple levels of related application components. As described earlier, components can be different Application Insights resources, dependent components, or different roles in a single resource. Application map locates components by following HTTP dependency calls made between servers with the Application Insights SDK installed.
The mapping experience starts with the progressive discovery of the components within the application and their dependencies. When you first load Application map, a query set triggers to discover the components related to the main component. As components are discovered, a status bar shows the current number of discovered components:
The following sections describe some of the actions available for working with Application map in the Azure portal.
Update map components
The Update map components option triggers discovery of components and refreshes the map to show all current nodes. Depending on the complexity of your application, the update can take a minute to load:
When all application components are roles within a single Application Insights resource, the discovery step isn't required. The initial load in this application scenario discovers all of the components.
View component details
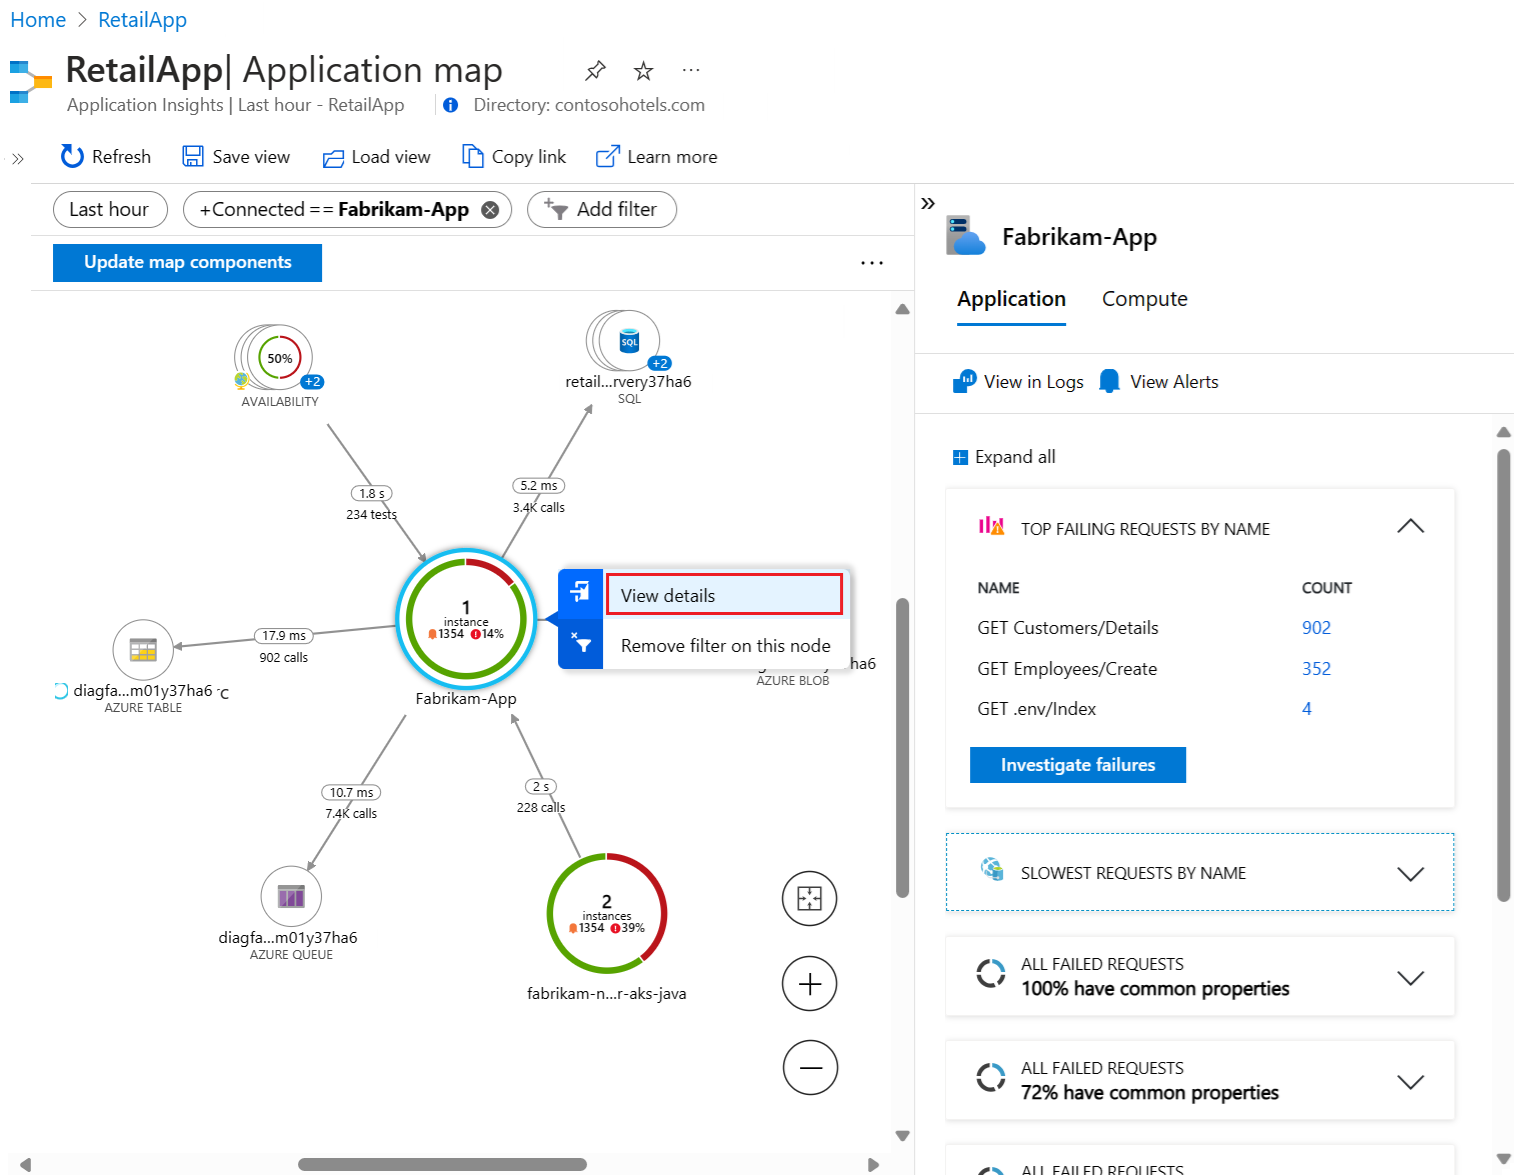
A key objective for the Application map experience is to help you visualize complex topologies that have hundreds of components. In this scenario, it's useful to enhance the map view with details for an individual node by using the View details option. The node details pane shows related insights, performance, and failure triage experience for the selected component:
Each pane section includes an option to see more information in an expanded view, including failures, performance, and details about failed requests and dependencies.
Investigate failures
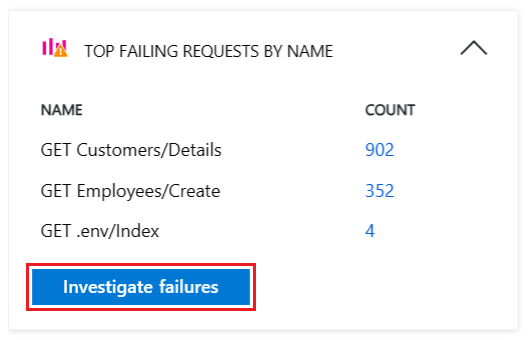
In the node details pane, you can use the Investigate failures option to view all failures for the component:
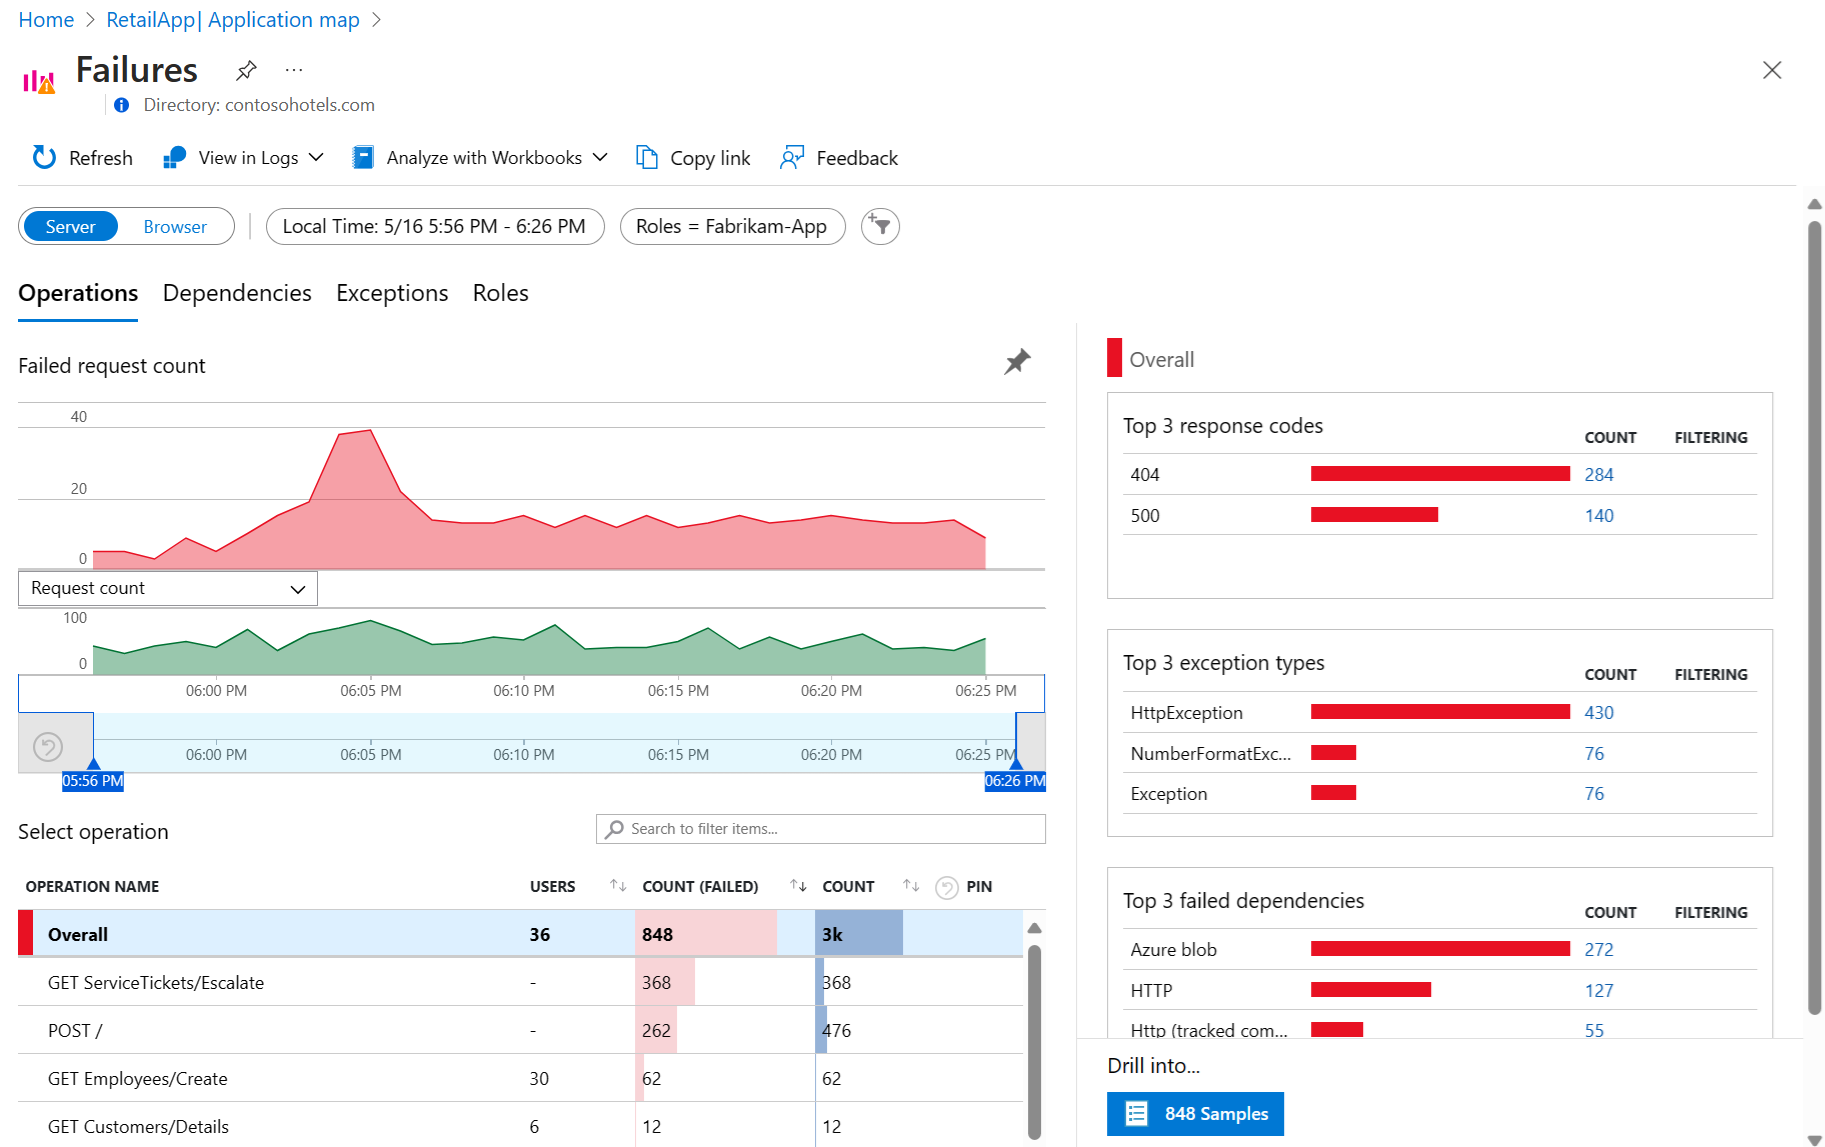
The Failures view lets you explore failure data for operations, dependencies, exceptions, and roles related to the selected component:
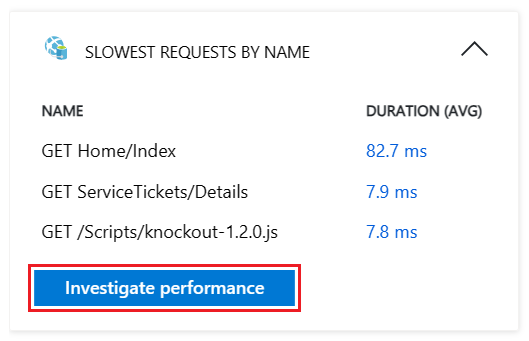
Investigate performance
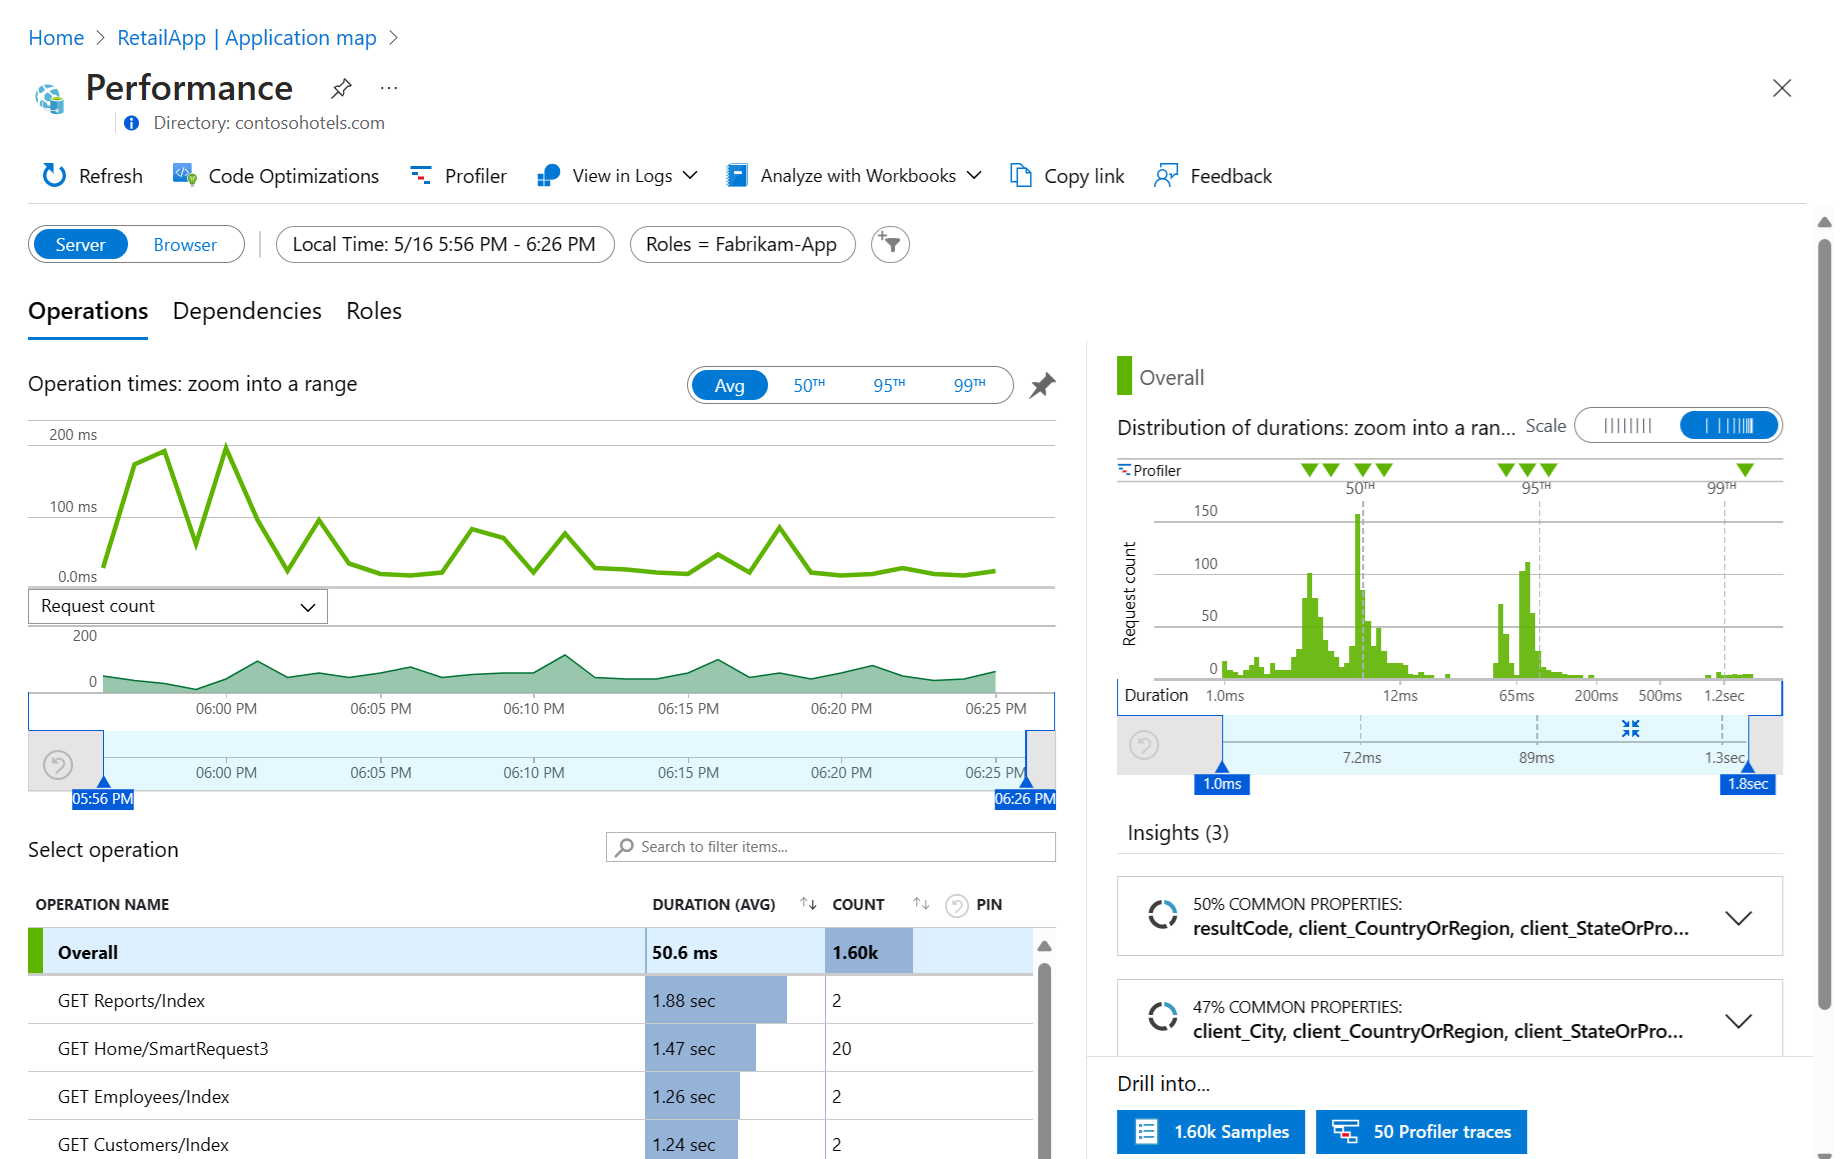
In the node details pane, you can troubleshoot performance problems with the component by selecting the Investigate performance option:
The Performance view lets you explore telemetry data for operations, dependencies, and roles connected with the selected component:
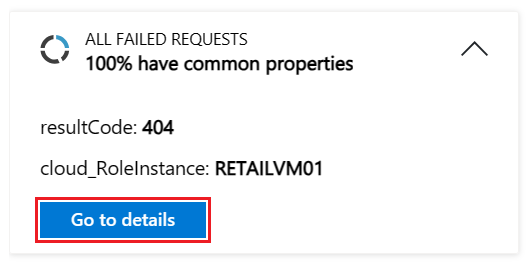
Go to details and stack trace
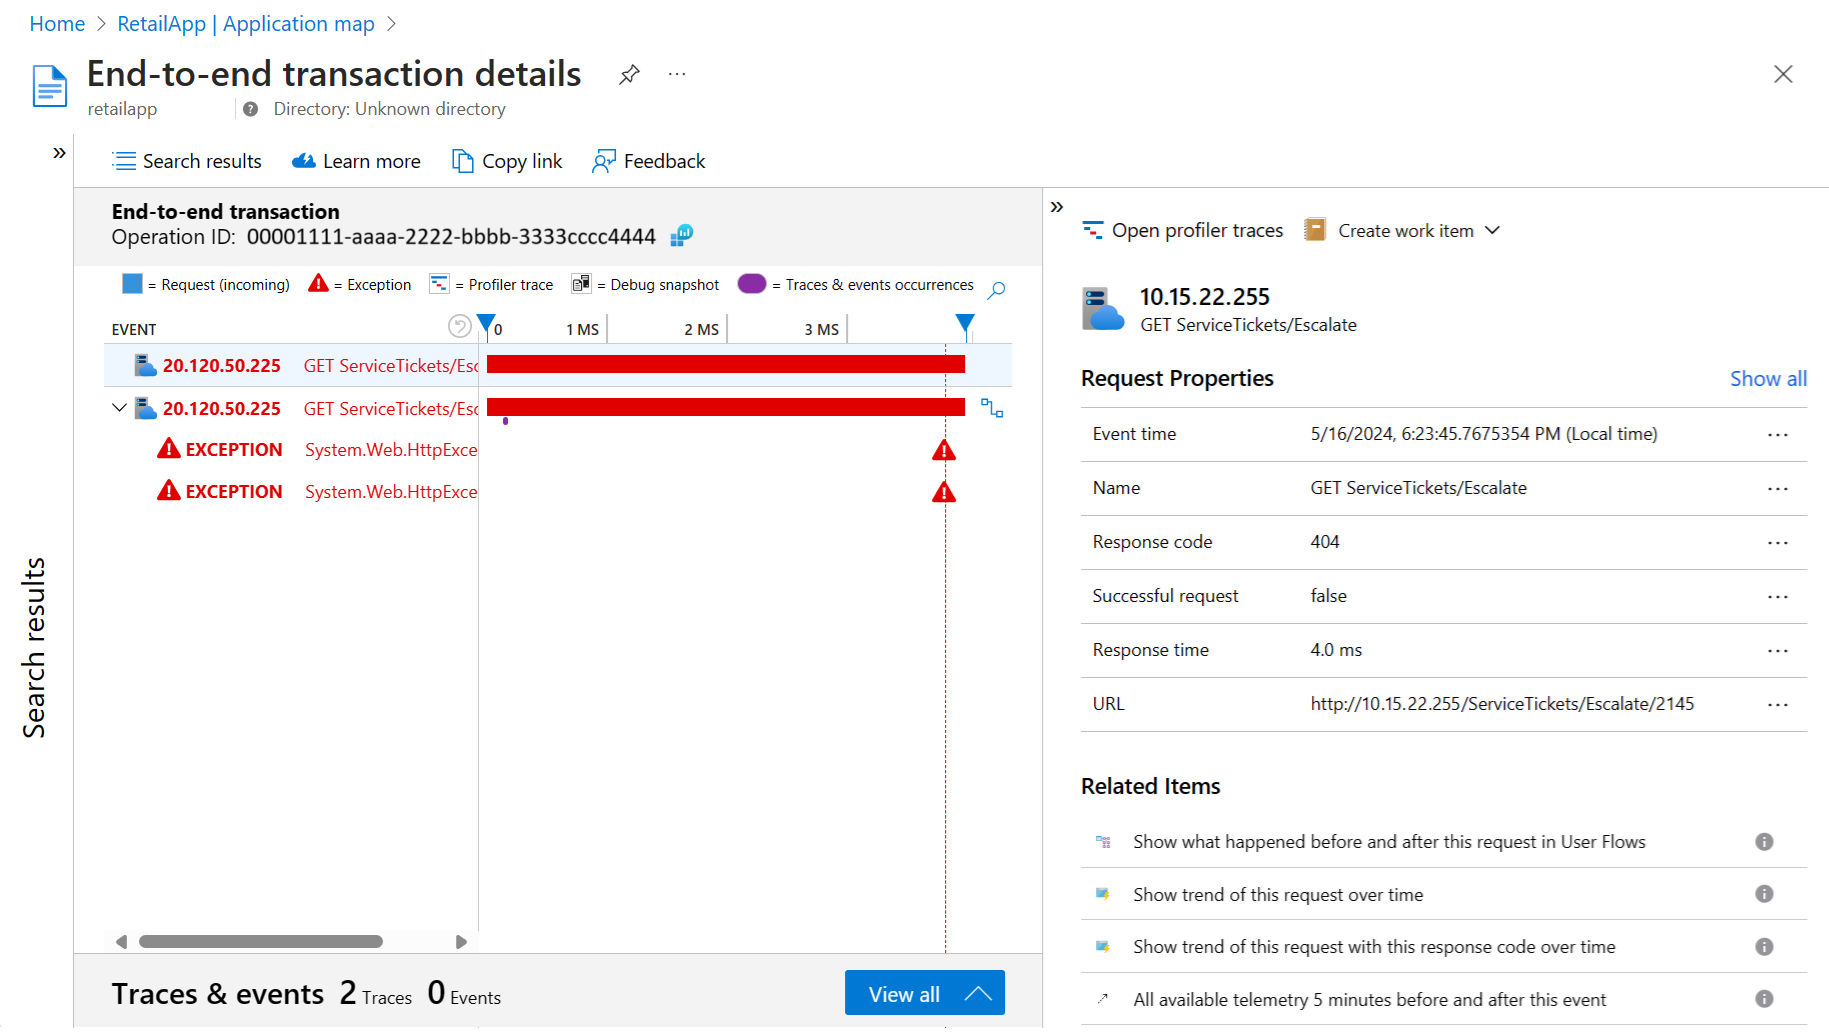
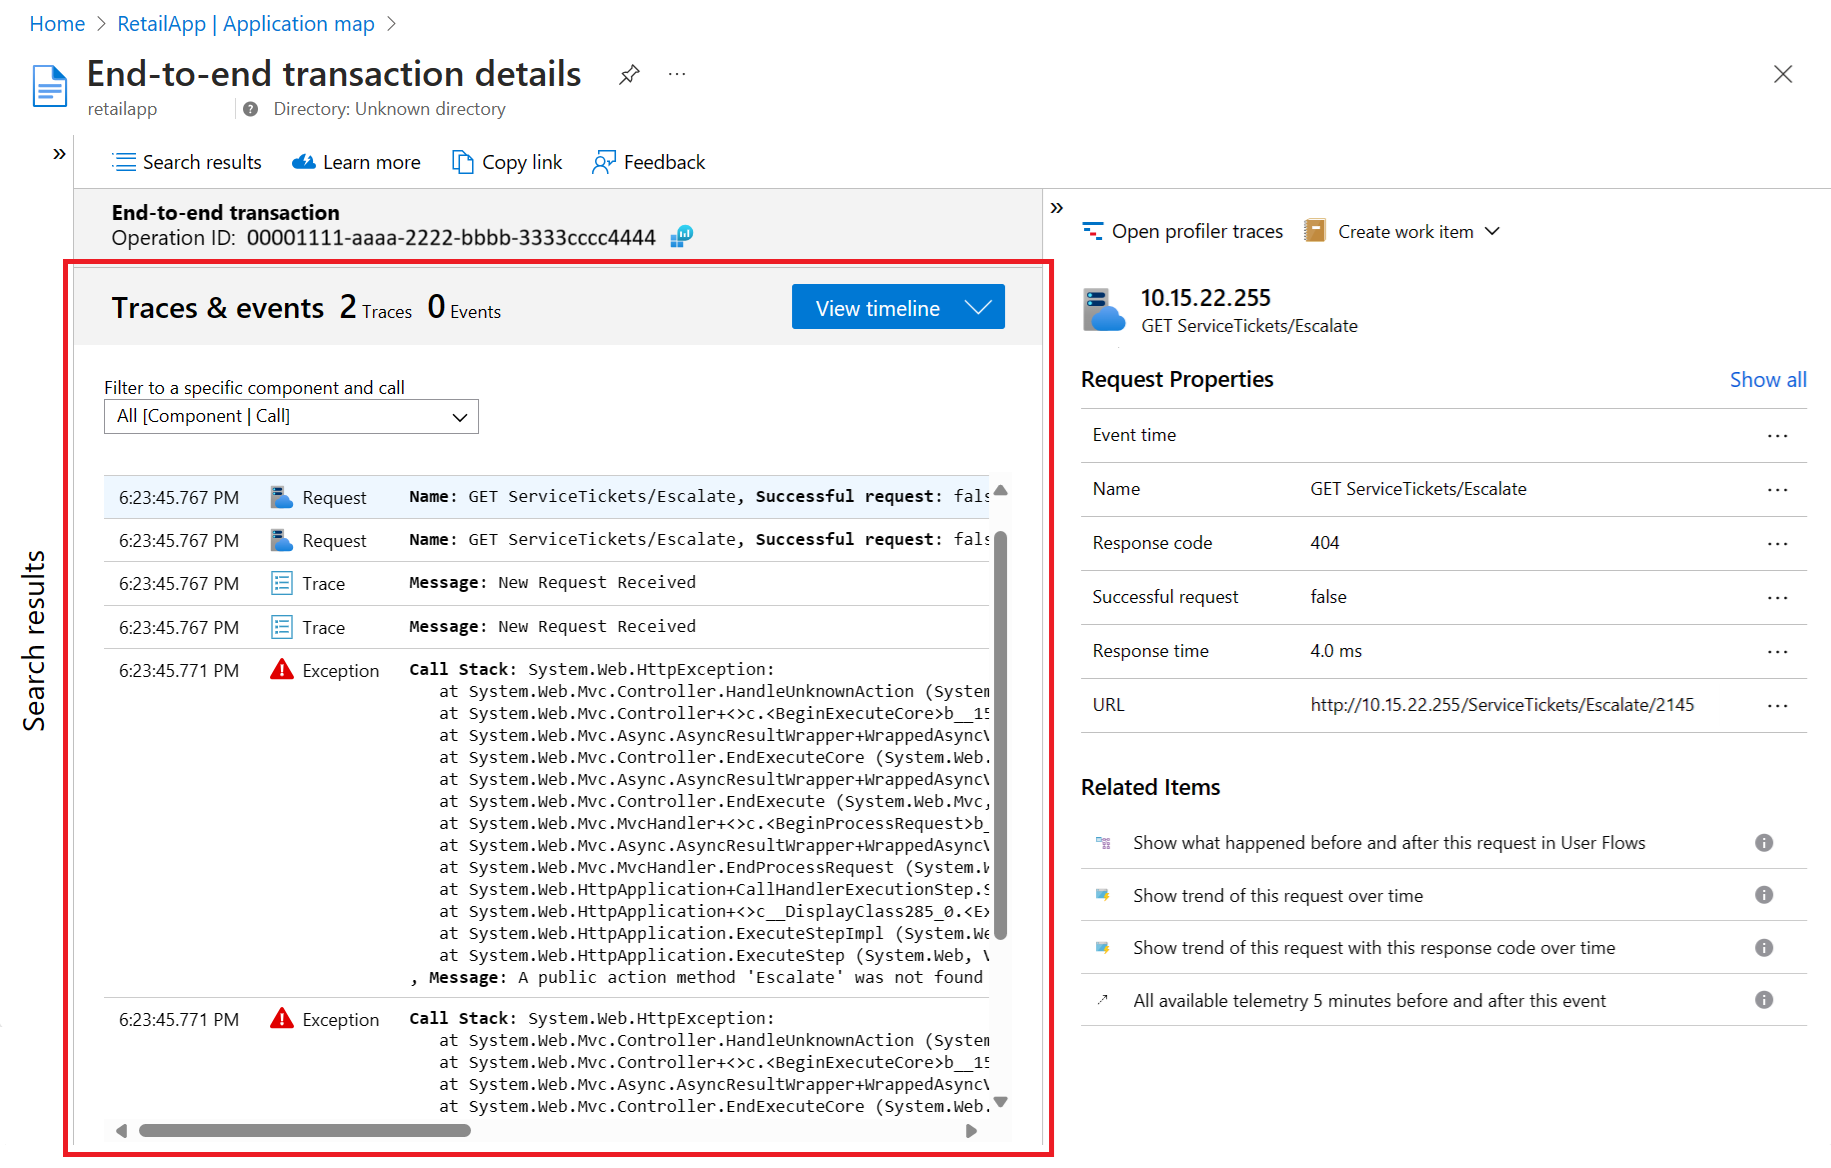
The Go to details option in the node details pane displays the end-to-end transaction experience for the component. This pane lets you view details at the call stack level:
The page opens to show the Timeline view for the details:
You can use the View all option to see the stack details with trace and event information for the component:
View in Logs (Analytics)
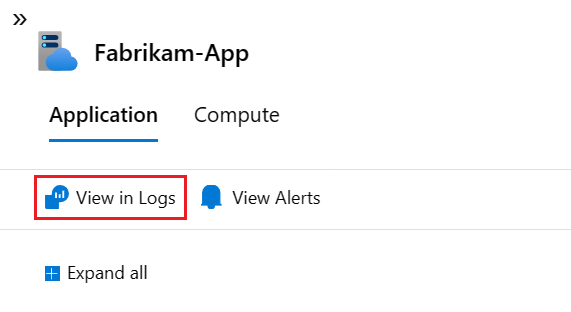
In the node details pane, you can query and investigate your applications data further with the View in Logs (Analytics) option:
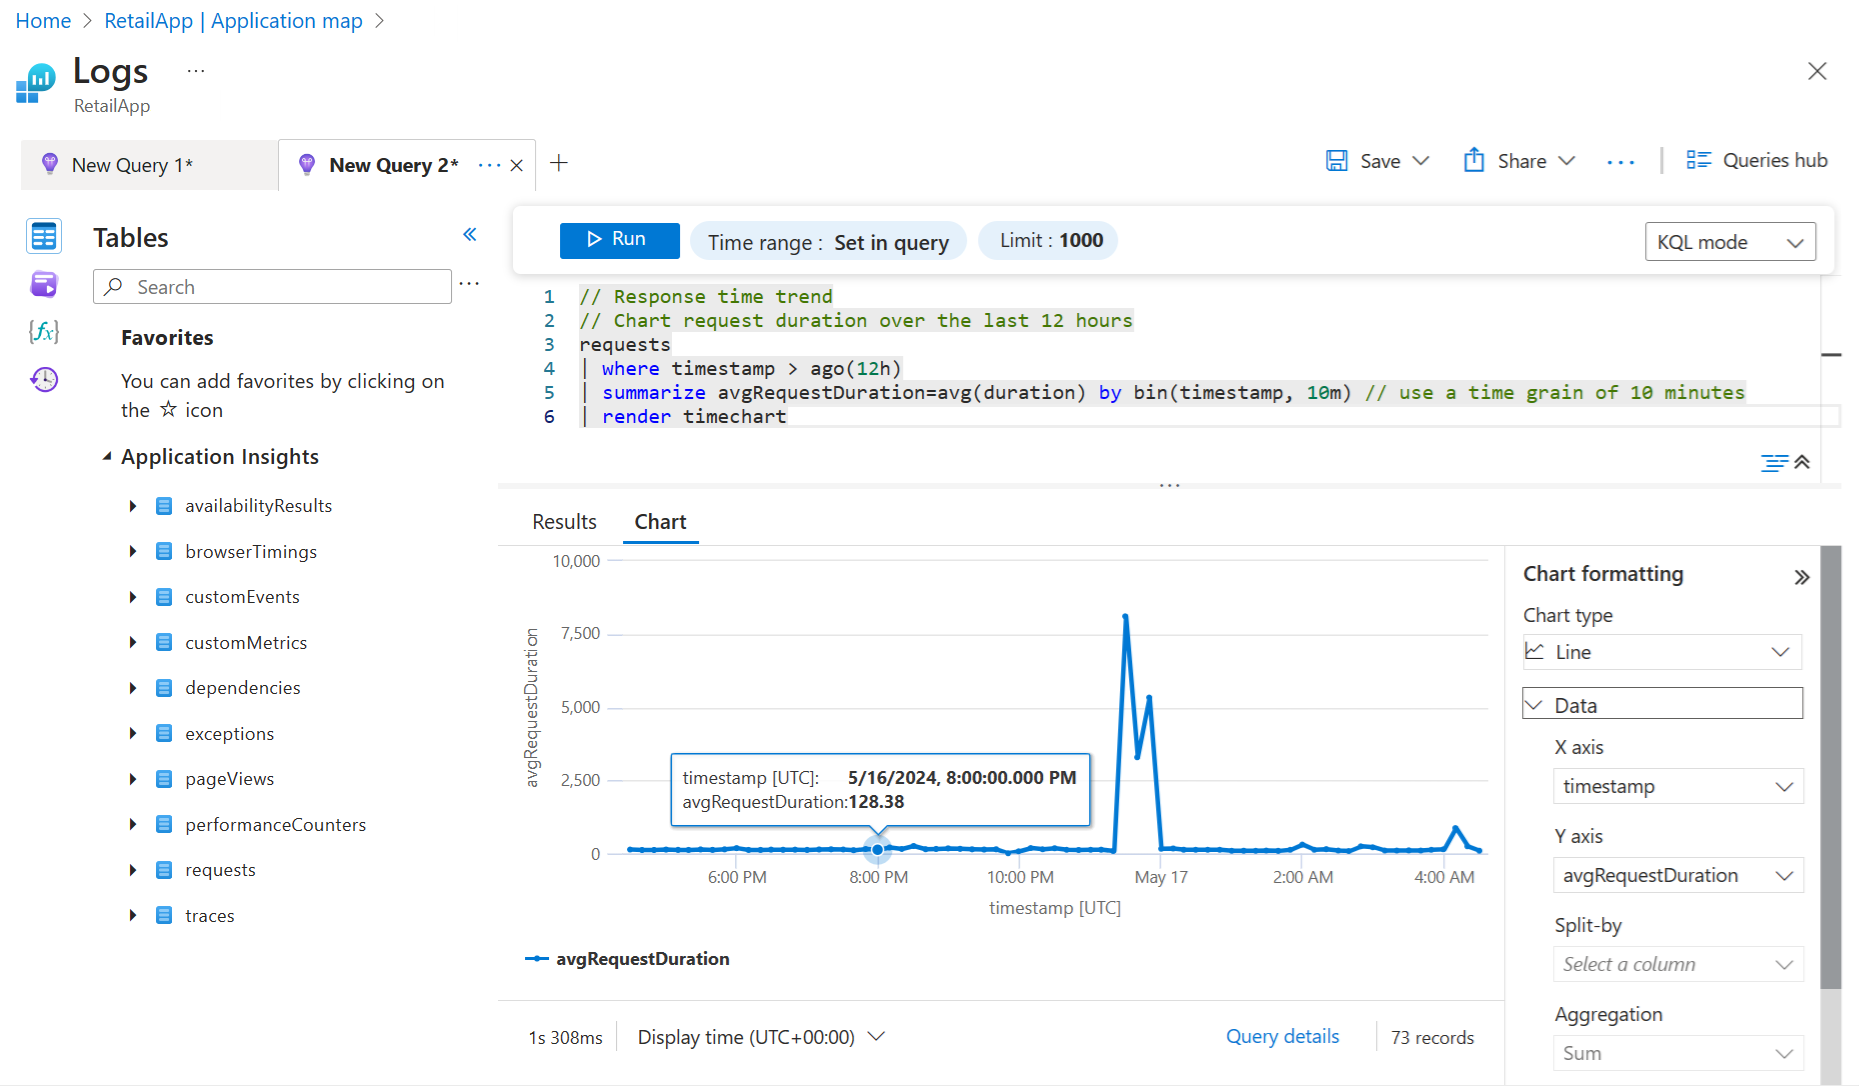
The Logs (Analytics) page provides options to explore your application telemetry table records with built-in or custom queries and functions. You can work with the data by adjusting the format, and saving and exporting your analysis:
View alerts and rules
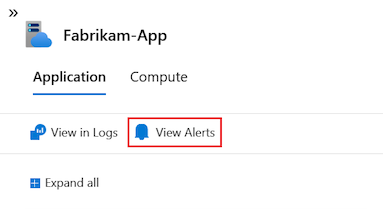
The View alerts option in the node details pane lets you see active alerts:
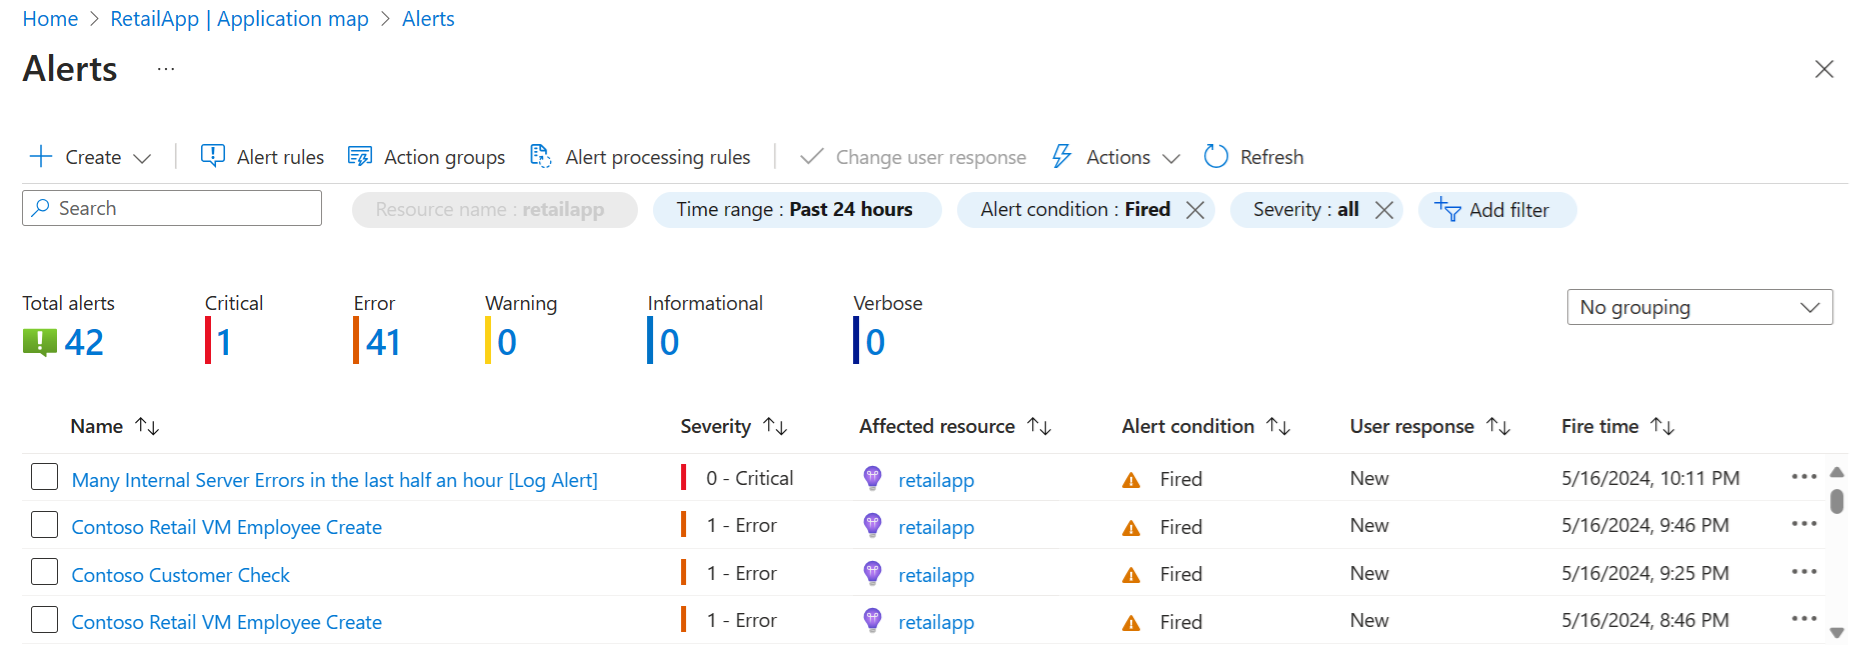
The Alerts page shows critical and fired alerts:
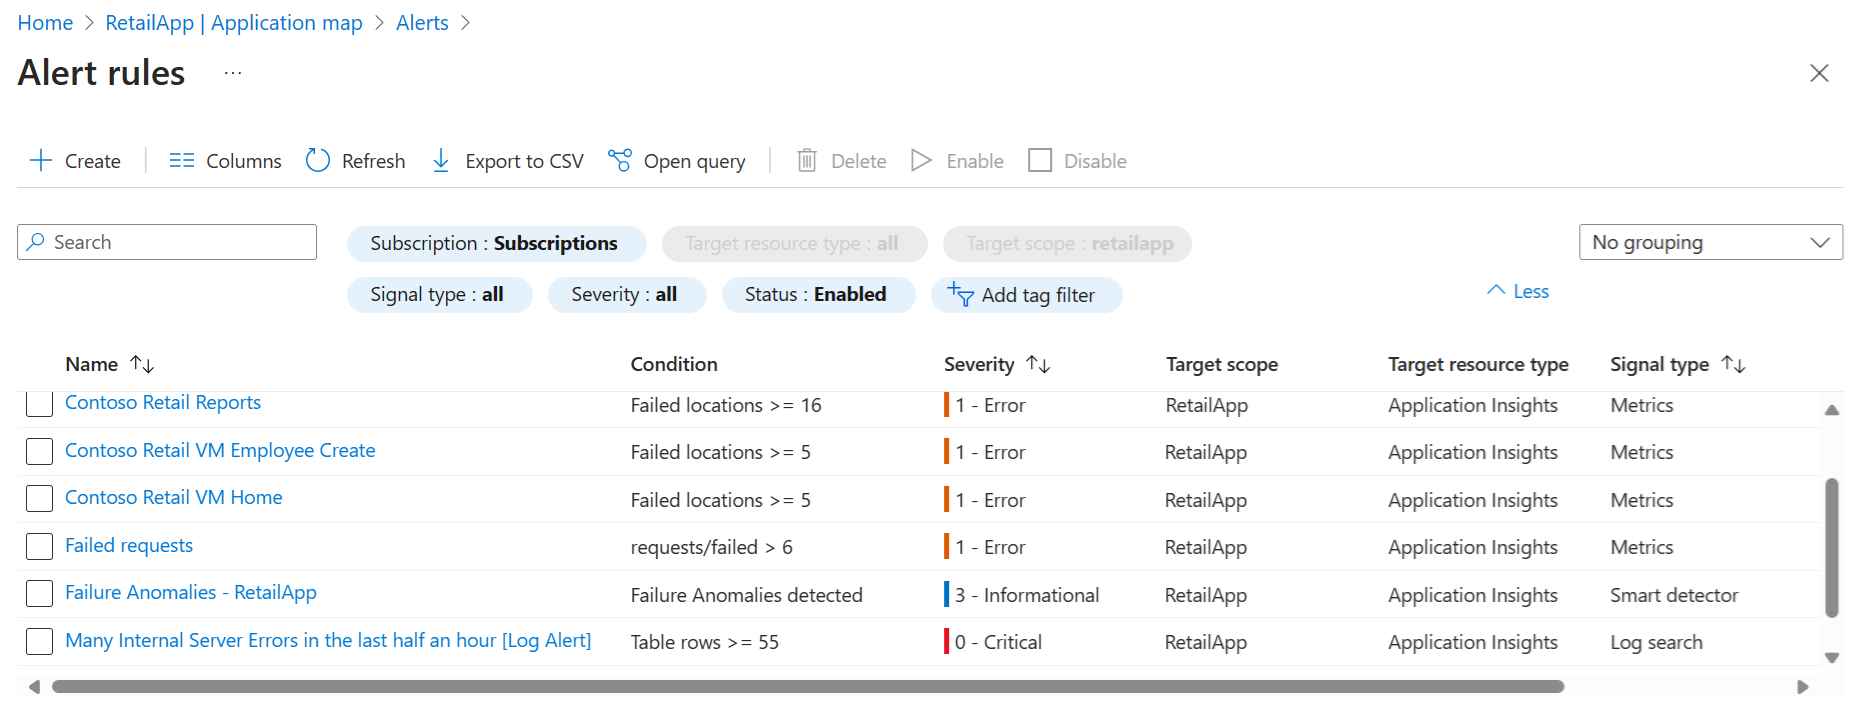
The Alert rules option on the Alerts page shows the underlying rules that cause the alerts to trigger:
Understand cloud role names and nodes
Application map uses the cloud role name property to identify the application components on a map. To explore how cloud role names are used with component nodes, look at an application map that has multiple cloud role names present.
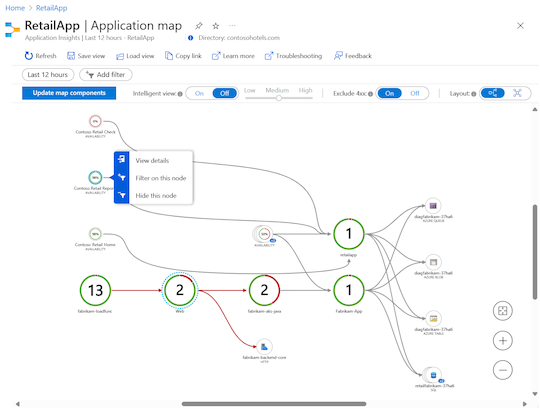
The following example shows a map in Hierarchical view with five component nodes and connectors to nine dependent nodes. Each node has a cloud role name.
Application map uses different colors, highlights, and sizes for nodes to depict the application component data and relationships:
The cloud role names express the different aspects of the distributed application. In this example, some of the application roles include
Contoso Retail Check,Fabrikam-App,fabrikam-loadfunc,retailfabrikam-37ha6, andretailapp.The dotted blue circle around a node indicates the last selected component. In this example, the last selected component is the
Webnode.When you select a node to see the details, a solid blue circle highlights the node. In the example, the currently selected node is
Contoso Retail Reports.Distant or unrelated component nodes are shown smaller in comparison to the other nodes. These items are dimmed in the view to highlight performance for the currently selected component.
In this example, each cloud role name also represents a different unique Application Insights resource with its own instrumentation keys. Because the owner of this application has access to each of those four disparate Application Insights resources, Application map can stitch together a map of the underlying relationships.
Investigate cloud role instances
When a cloud role name reveals a problem somewhere in your web frontend, and you're running multiple load-balanced servers across your web frontend, using a cloud role instance can be helpful. Application map lets you view deeper information about a component node by using Kusto queries. You can investigate a node to view details about specific cloud role instances. This approach helps you determine whether an issue affects all web front-end servers or only specific instances.
A scenario where you might want to override the value for a cloud role instance is when your app is running in a containerized environment. In this case, information about the individual server might not be sufficient to locate the specific issue.
For more information about how to override the cloud role name property with telemetry initializers, see Add properties: ITelemetryInitializer.
Set cloud role names
Application map uses the cloud role name property to identify the components on the map. This section provides examples to manually set or override cloud role names and change what appears on the application map.
Note
The Application Insights SDK or Agent automatically adds the cloud role name property to the telemetry emitted by components in an Azure App Service environment.
The following snippet shows the schema definitions for the cloud role and cloud role instance:
[Description("Name of the role the application is a part of. Maps directly to the role name in Azure.")]
[MaxStringLength("256")]
705: string      CloudRole = "ai.cloud.role";

[Description("Name of the instance where the application is running. Computer name for on-premises, instance name for Azure.")]
[MaxStringLength("256")]
715: string      CloudRoleInstance = "ai.cloud.roleInstance";
For the official definitions:
Write custom TelemetryInitializer
using Microsoft.ApplicationInsights.Channel;
using Microsoft.ApplicationInsights.Extensibility;

namespace CustomInitializer.Telemetry
{
    public class MyTelemetryInitializer : ITelemetryInitializer
    {
        public void Initialize(ITelemetry telemetry)
        {
            if (string.IsNullOrEmpty(telemetry.Context.Cloud.RoleName))
            {
                //set custom role name here
                telemetry.Context.Cloud.RoleName = "Custom RoleName";
                telemetry.Context.Cloud.RoleInstance = "Custom RoleInstance";
            }
        }
    }
}
ASP.NET apps: Load initializer in the active TelemetryConfiguration
In the ApplicationInsights.config file:
    <ApplicationInsights>
      <TelemetryInitializers>
        <!-- Fully qualified type name, assembly name: -->
        <Add Type="CustomInitializer.Telemetry.MyTelemetryInitializer, CustomInitializer"/>
        ...
      </TelemetryInitializers>
    </ApplicationInsights>
An alternate method for ASP.NET Web apps is to instantiate the initializer in code. The following example shows code in the Global.aspx.cs file:
 using Microsoft.ApplicationInsights.Extensibility;
 using CustomInitializer.Telemetry;

    protected void Application_Start()
    {
        // ...
        TelemetryConfiguration.Active.TelemetryInitializers.Add(new MyTelemetryInitializer());
    }
Note
Adding an initializer by using the ApplicationInsights.config or TelemetryConfiguration.Active property isn't valid for ASP.NET Core applications.
ASP.NET Core apps: Load an initializer to TelemetryConfiguration
For ASP.NET Core applications, to add a new TelemetryInitializer instance, you add it to the Dependency Injection container. The following example shows this approach. Add this code in the ConfigureServices method of your Startup.cs class.
 using Microsoft.ApplicationInsights.Extensibility;
 using CustomInitializer.Telemetry;
 public void ConfigureServices(IServiceCollection services)
{
    services.AddSingleton<ITelemetryInitializer, MyTelemetryInitializer>();
}
Use Application map filters
Application map filters help you decrease the number of visible nodes and edges on your map. These filters can be used to reduce the scope of the map and show a smaller and more focused view.
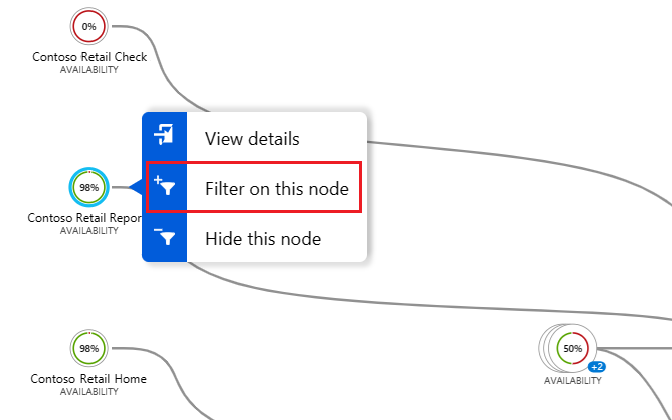
A quick way to filter is to use the Filter on this node option on the context menu for any node on the map:
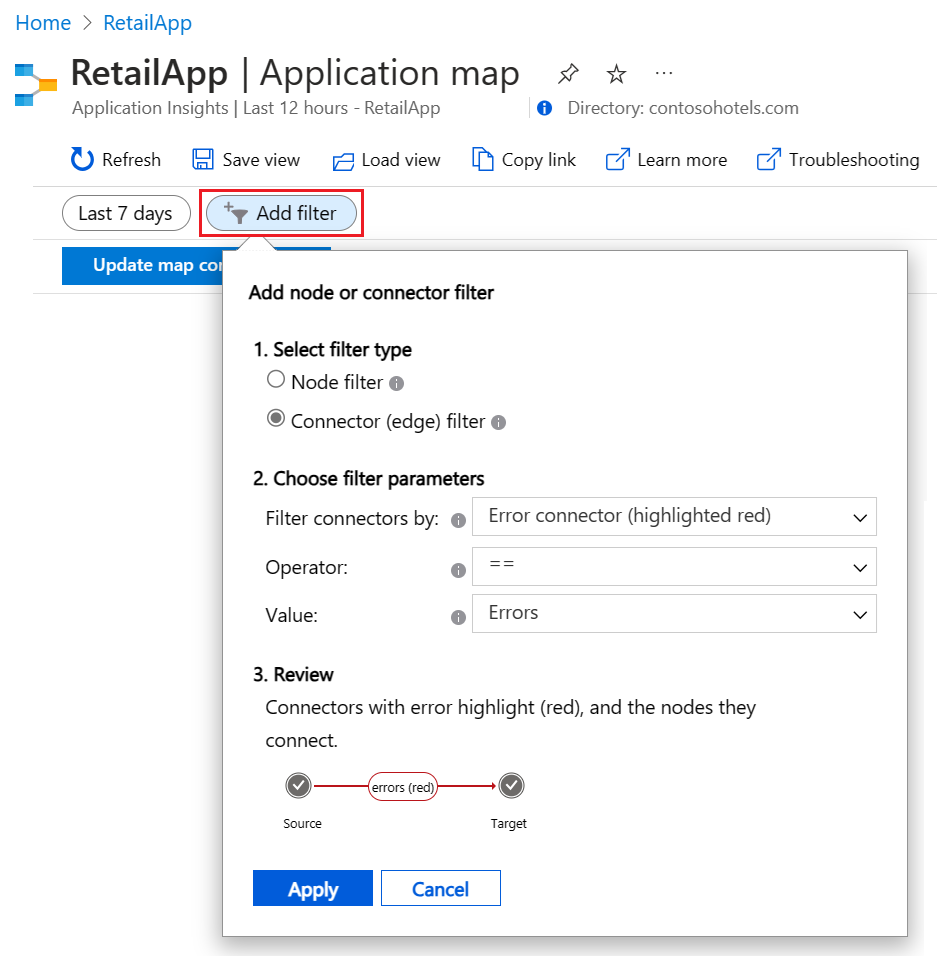
You can also create a filter with the Add filter option:
Select your filter type (node or connector) and desired settings, then review your choices and apply them to the current map.
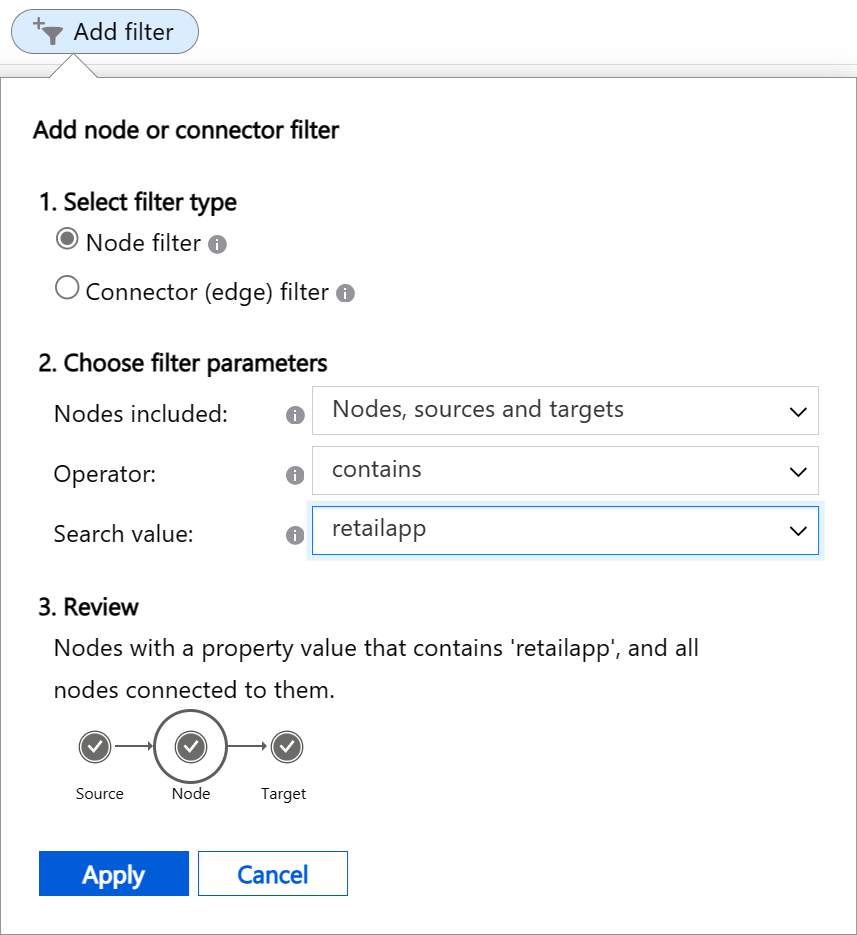
Create node filters
Node filters allow you to see only certain nodes in the application map and hide all other nodes. You configure parameters to search the properties of nodes in the map for values that match a condition. When a node filter removes a node, the filter also removes all connectors and edges for the node.
A node filter has three parameters to configure:
Nodes included: The types of nodes to review in the application map for matching properties. There are four options:
Nodes, sources and targets: All nodes that match the search criteria are included in the results map. All source and target nodes for the matching nodes are also automatically included in the results map, even if the sources or targets don't satisfy the search criteria. The source and target nodes are collectively referred to as connected nodes.
Nodes and sources: The same behavior as Nodes, sources and targets, but target nodes aren't automatically included in the results map.
Nodes and targets: The same behavior as Nodes, sources and targets, but source nodes aren't automatically included in the results map.
Nodes only: All nodes in the results map must have a property value that matches the search criteria.
Operator: The type of conditional test to perform on each node's property values. There are four options:
contains: The node property value contains the value specified in the Search value parameter.!containsThe node property value doesn't contain the value specified in the Search value parameter.==: The node property value is equal to the value specified in the Search value parameter.!=: The node property value isn't equal to the value specified in the Search value parameter.
Search value: The text string to use for the property value conditional test. The dropdown list for the parameter shows values for existing nodes in the application map. You can select a value from the list, or create your own value. Enter your custom value in the parameter field and then select Create option ... in the list. For example, you might enter
testand then select Create option "test" in the list.
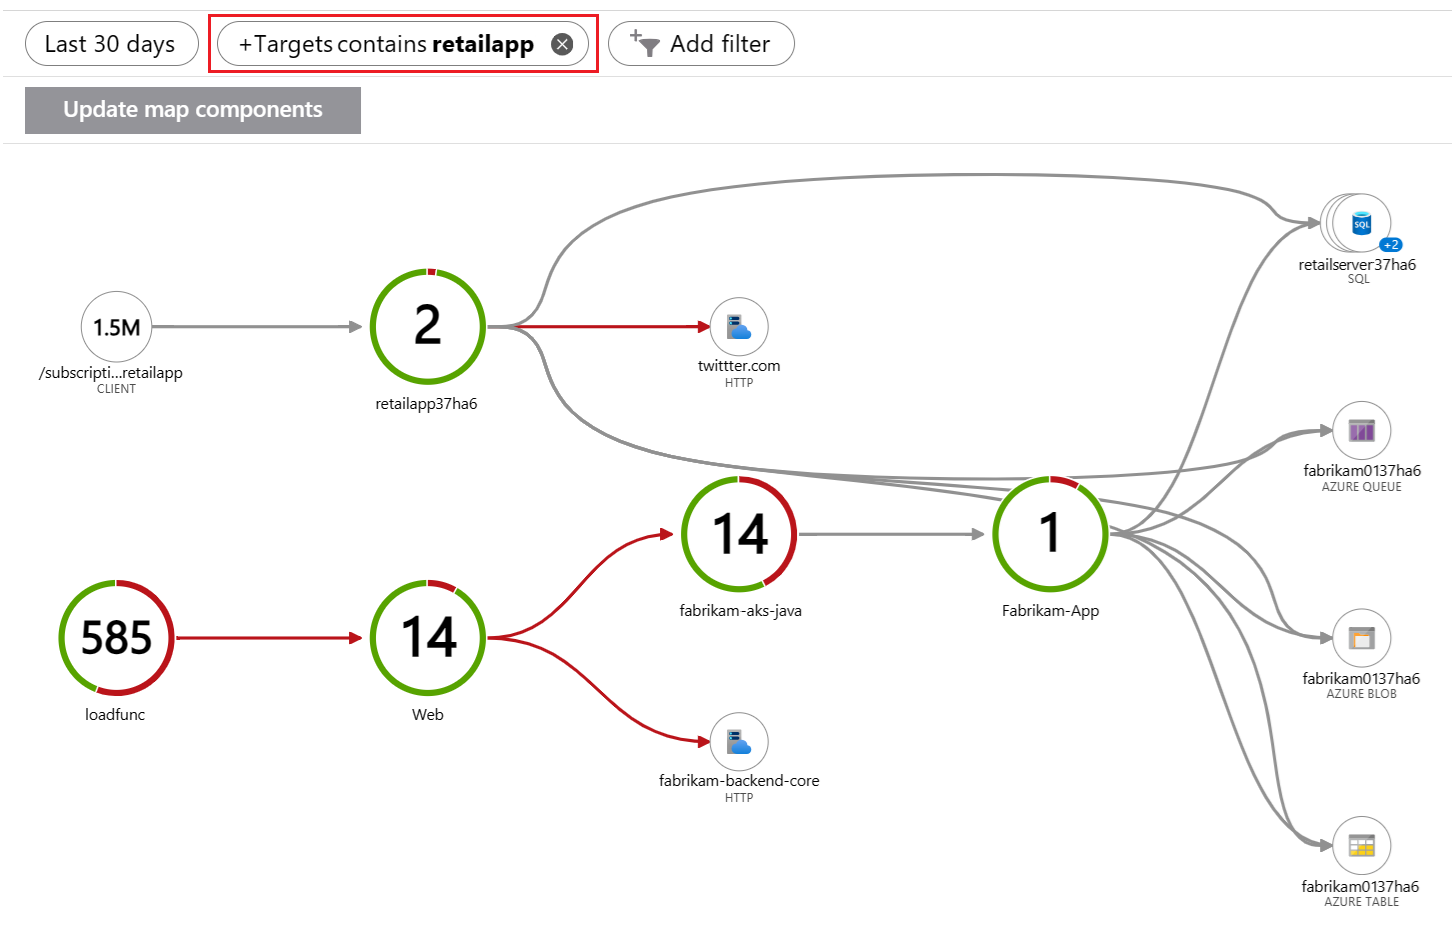
The following image shows an example of a filter applied to an application map that shows 30 days of data. The filter instructs Application map to search for nodes and connected targets that have properties that contain the text "retailapp":
Matching nodes and their connected target nodes are included in the results map:
Create connector (edge) filters
Connector filters allow you to see only certain nodes with specific connectors in the application map and hide all other nodes and connectors. You configure parameters to search the properties of connectors in the map for values that match a condition. When a node has no matching connectors, the filter removes the node from the map.
A connector filter has three parameters to configure:
Filter connectors by: The types of connectors to review in the application map for matching properties. There are four choices. Your selection controls the available options for the other two parameters.
Operator: The type of conditional test to perform on each connector's value.
Value: The comparison value to use for the property value conditional test. The dropdown list for the parameter contains values relevant to the current application map. You can select a value from the list, or create your own value. For example, you might enter
16and then select Create option "16" in the list.
The following table summarizes the configuration options based on your choice for the Filter connectors by parameter.
| Filter connectors by | Description | Operator parameter | Value parameter | Usage |
|---|---|---|---|---|
| Error connector (highlighted red) | Search for connectors based on their color. The color red indicates the connector is in an error state. | ==: Equal to !=: Not equal to |
Always set to Errors | Show only connectors with errors or only connectors without errors. |
| Error rate (0% - 100%) | Search for connectors based on their average error rate (the number of failed calls divided by the number of all calls). The value is expressed as a percentage. | >= Greater than or Equal to <= Less than or Equal to |
The dropdown list shows average error rates relevant to current connectors in your application map. Choose a value from the list or enter a custom value by following the process described earlier. | Show connectors with failure rates greater than or lower than the selected value. |
| Average call duration (ms) | Search for connectors based on the average duration of all calls across the connector. The value is measured in milliseconds. | >= Greater than or Equal to <= Less than or Equal to |
The dropdown list shows average durations relevant to current connectors in your application map. For example, a value of 1000 refers to calls with an average duration of 1 second. Choose a value from the list or enter a custom value by following the process described earlier. |
Show connectors with average call duration rates greater than or lower than the selected value. |
| Calls count | Search for connectors based on the total number of calls across the connector. | >= Greater than or Equal to <= Less than or Equal to |
The dropdown list shows total call counts relevant to current connectors in your application map. Choose a value from the list or enter a custom value by following the process described earlier. | Show connectors with call counts greater than or lower than your selected value. |
Percentile indicators for value
When you filter connectors by the Error rate, Average call duration, or Calls count, some options for the Value parameter include the (Pxx) designation. This indicator shows the percentile level. For an Average call duration filter, you might see the value 200 (P90). This option means 90% of all connectors (regardless of the number of calls they represent) have less than 200-ms call duration.
You can see the Value options that include the percentile level by entering P in the parameter field.
Review your filters
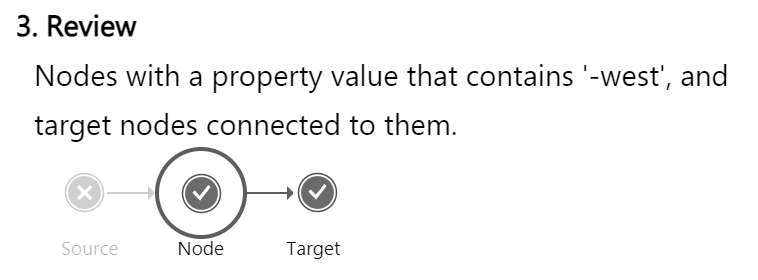
After you make your selections, the Review section of the Add filter popup shows textual and visual descriptions about your filter. The summary display can help you understand how your filter applies to your application map.
The following example shows the Review summary for a node filter that searches for nodes and targets with properties that have the text "-west":
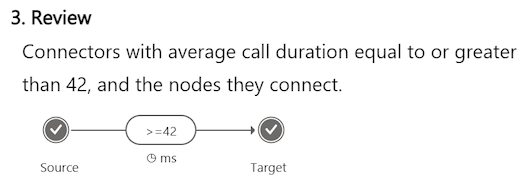
This example shows the summary for a connector filter that searches for connectors (and they nodes they connect) with an average call duration equal to or greater than 42 ms:
Apply filters to map
After you configure and review your filter settings, select Apply to create the filter. You can apply multiple filters to the same application map. In Application map, the applied filters display as pills above the map:
The Remove action  on a filter pill lets you delete a filter. When you delete an applied filter, the map view updates to subtract the filter logic.
Application map applies the filter logic to your map sequentially, starting from the left-most filter in the list. As filters are applied, nodes and connectors are removed from the map view. After a node or connector is removed from the view, a subsequent filter can't restore the item.
You can change the configuration for an applied filter by selecting the filter pill. As you change the filter settings, Application map shows a preview of the map view with the new filter logic. If you decide not to apply the changes, you can use the Cancel option to the current map view and filters.
Explore and save filters
When you discover an interesting filter, you can save the filter to reuse it later with the Copy Link or Pin to dashboard option:
The Copy link option encodes all current filter settings in the copied URL. You can save this link in your browser bookmarks or share it with others. This feature preserves the duration value in filter settings, but not the absolute time. When you use the link later, the produced application map might differ from the map present at the time the link was captured.
The Pin to dashboard option adds the current application map to a dashboard, along with its current filters. A common diagnostic approach is to pin a map with an Error connector filter applied. You can monitor your application for nodes with errors in their HTTP calls.
The following sections describe some common filters that apply to most maps and can be useful to pin on a dashboard.
Check for important errors
Produce a map view of only connectors with errors (highlighted red) over the last 24 hours. The filters include the Error connector parameter combined with Intelligent view:

The Intelligent view feature is described later in this article.
Hide low-traffic connectors
Hide low-traffic connectors without errors from the map view, so you can quickly focus on more significant issues. The filters include connectors over the last 24 hours with a Calls count greater than 2872 (P20):

Show high-traffic connectors
Reveal high-traffic connectors that also have a high average call duration time. This filter can help identify potential performance issues. The filters in this example include connectors over the last 24 hours with a Calls count greater than 10854 (P50) and Average call duration time greater than 578 (P80):

Locate components by name
Locate components (nodes and connectors) in your application by name according to your implementation of the component roleName property naming convention. You can use this approach to see the specific portion of a distributed application. The filter searches for Nodes, sources and targets over the last 24 hours that contain the specified value. In this example, the search value is "west":

Remove noisy components
Define filters to hide noisy components by removing them from the map. Sometimes application components can have active dependent nodes that produce data that's not essential for the map view. In this example, the filter searches for Nodes, sources and targets over the last 24 hours that don't contain the specified value "retail":

Look for error-prone connectors
Show only connectors that have higher error rates than a specific value. The filter in this example searches for connectors over the last 24 hours that have an Error rate greater than 3%:

Explore Intelligent view
The Intelligent view feature for Application map is designed to aid in service health investigations. It applies machine learning to quickly identify potential root causes of issues by filtering out noise. The machine learning model learns from Application map historical behavior to identify dominant patterns and anomalies that indicate potential causes of an incident.
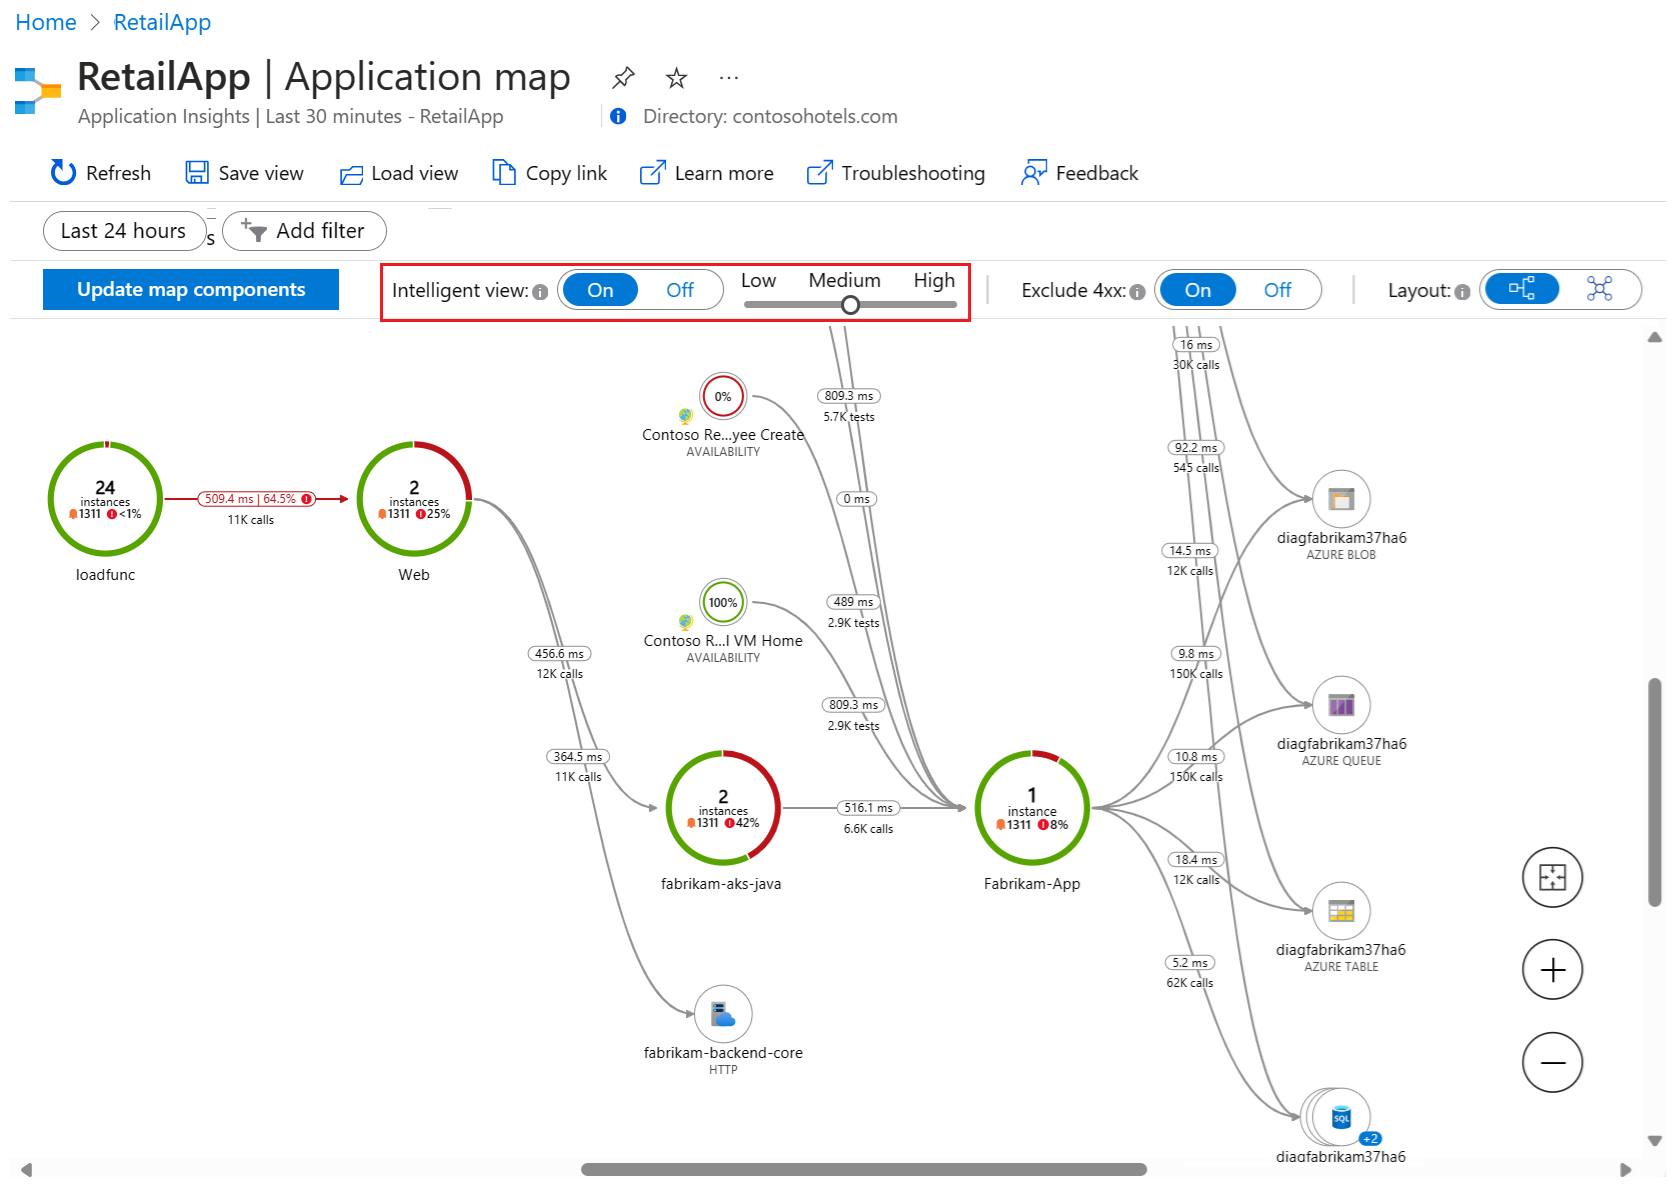
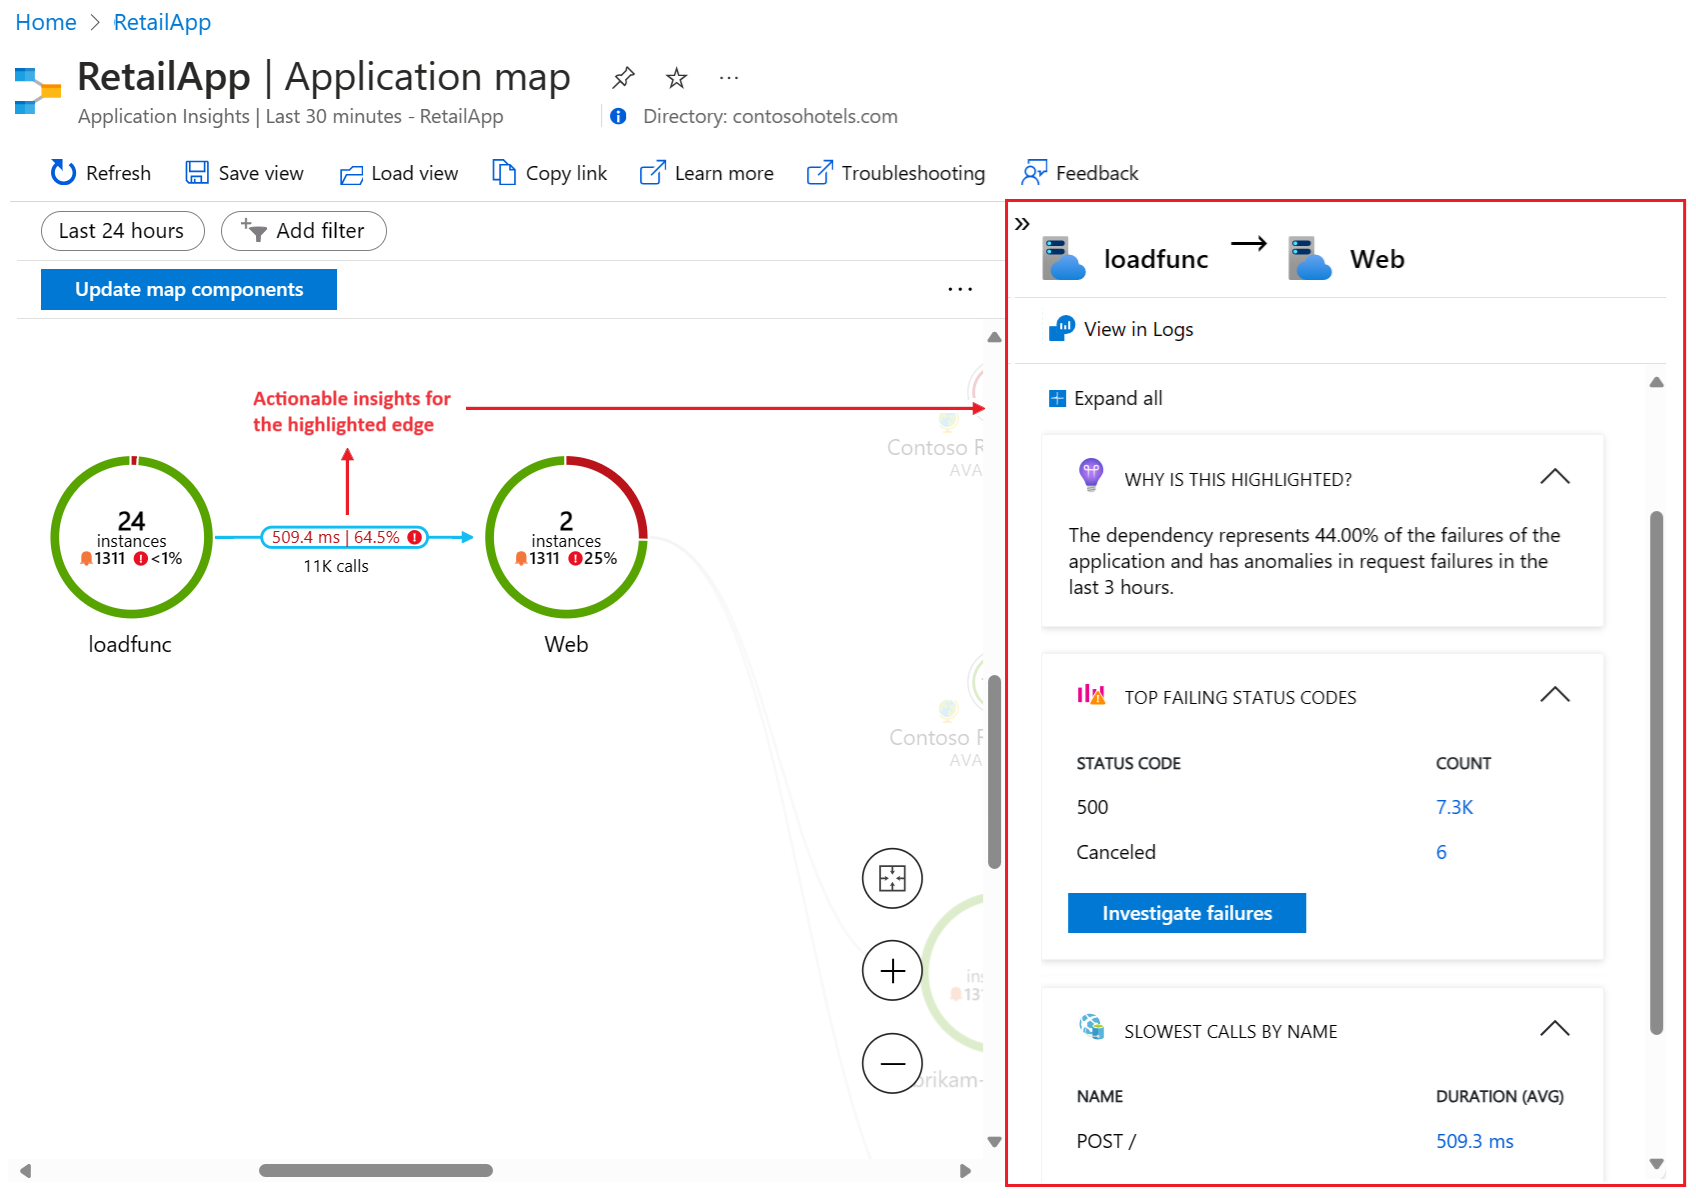
In large distributed applications, there's always some degree of noise coming from "benign" failures, which might cause Application map to be noisy by showing many red edges. Intelligent view shows only the most probable causes of service failure and removes node-to-node red edges (service-to-service communication) in healthy services. Intelligent view highlights the edges in red that should be investigated. It also offers actionable insights for the highlighted edge.
There are many benefits to using Intelligent view:
- Reduces time to resolution by highlighting only failures that need to be investigated
- Provides actionable insights on why a certain red edge was highlighted
- Enables Application map to be used for large distributed applications seamlessly (by focusing only on edges marked in red)
Intelligent view has some limitations:
- Large distributed applications might take a minute to load.
- Time frames of up to seven days are supported.
Work with Intelligent view
A toggle above the application map lets you enable Intelligent view and control the issue detection sensitivity:
Intelligent view uses the patented AIOps machine learning model to highlight (red) the significant and important data in an application map. Various application data are used to determine which data to highlight on the map, including failure rates, request counts, durations, anomalies, and dependency type. For comparison, the standard map view utilizes only the raw failure rate.
Application map highlights edges in red according to your sensitivity setting. You can adjust the sensitivity to achieve the desired confidence level in the highlighted edges.
| Sensitivity | Description |
|---|---|
| High | Fewer edges are highlighted. |
| Medium | (Default setting) A balanced number of edges are highlighted. |
| Low | More edges are highlighted. |
Check actionable insights
After you enable Intelligent view, select a highlighted edge (red) on the map to see the "actionable insights" for the component. The insights display in a pane to the right and explain why the edge is highlighted.
To start troubleshooting an issue, select Investigate failures. You can review the information about the component in the Failures pane to determine if the detected issue is the root cause.
When Intelligent view doesn't highlight any edges on the application map, the machine learning model didn't find potential incidents in the dependencies of your application.
Troubleshooting tips
If you're having trouble getting Application map to work as expected, review the suggestions in the following sections.
Here are some general recommendations:
Use an officially supported SDK. Unsupported or community SDKs might not support correlation. For a list of supported SDKs, see Application Insights: Languages, platforms, and integrations.
Upgrade all components to the latest SDK version.
Support Azure Functions with C# by upgrading to Azure Functions V2.
Ensure the cloud role name is correctly configured.
Confirm any missing dependencies are listed as autocollected dependencies. If a dependency isn't listed, you can track it manually with a track dependency call.
Too many nodes on map
Application map adds a component node for each unique cloud role name in your request telemetry. The process also adds a dependency node for each unique combination of type, target, and cloud role name.
If you have more than 10,000 nodes in your telemetry, Application map can't fetch all of the nodes and links. In this scenario, your map structure is incomplete. If this scenario occurs, a warning message appears when you view the map.
Application map can render a maximum of 1,000 separate ungrouped nodes at once. Application map reduces visual complexity by grouping dependencies together when they have the same type and callers.
If your telemetry has too many unique cloud role names or too many dependency types, the grouping is insufficient and the map isn't rendered.
To fix this issue, you need to change your instrumentation to properly set the cloud role name, dependency type, and dependency target fields. Confirm your application adheres to the following criteria:
Each dependency target represents the logical name of a dependency. In many cases, this value is equivalent to the server or resource name of the dependency. For example, if there are HTTP dependencies, the value is the hostname. The value shouldn't contain unique IDs or parameters that change from one request to another.
Each dependency type represents the logical type of a dependency. For example, HTTP, SQL, or Azure Blob are typical dependency types. This value shouldn't contain unique IDs.
Each cloud role name purpose applies the description in the Set or override cloud role name section.
Intelligent view: Edge not highlighted
Intelligent view might not highlight an edge as expected, even with a low sensitivity setting. A dependency might appear to be in failure but the model doesn't indicate the issue as a potential incident. Here are some possible scenarios:
If the dependency commonly fails, the model might consider the failure a standard state for the component and not highlight the edge. Intelligent view focuses on problem-solving in real time.
If the dependency has a minimal effect on the overall performance of the application, Intelligent view might ignore the component during machine learning modeling.
If your scenario is unique, you can use the Feedback option to describe your experience and help improve future model versions.
Intelligent view: Edge highlighted
When intelligent view highlights an edge, the actionable insights from the machine learning model should identify the significant issues that contribute to the high probability score. Keep in mind that the recommendation isn't based solely on failures, but on other indicators like unexpected latency in dominant flows.
Intelligent view: Doesn't load
If Intelligent view doesn't load, set the configured time frame to six days or less.
Intelligent view: Long load time
If Intelligent view takes longer to load than expected, avoid selecting the Update map components option. Enable Intelligent view only for a single Application Insights resource.
Related content
Learn how correlation works in Application Insights with Telemetry correlation.
Explore the end-to-end transaction diagnostic experience that correlates server-side telemetry from across all your Application Insights-monitored components into a single view.
Support advanced correlation scenarios in ASP.NET Core and ASP.NET with Track custom operations.
