Troubleshooting workbook-based insights
This article will help you with the diagnosis and troubleshooting of some of the common issues you may encounter when using Azure Monitor workbook-based insights.
Why can I only see 200 resources
The number of selected resources has a limit of 200, regardless of the number of subscriptions that are selected.
What happens when I select a recently pinned tile in the dashboard
- If you select anywhere on the tile, it will take you to the tab where the tile was pinned from. For example, if you pin a graph in the "Overview" tab then when you select that tile in the dashboard it will open up that default view, however if you pin a graph from your own saved copy then it will open up your saved copy's view.
- The filter icon in the top left of the title opens the "Configure tile settings" tab.
- The ellipse icon in the top right will give you the options to "Customize title data", "customize", "refresh" and "remove from dashboard".
What happens when I save a workbook
- When you save a workbook, it lets you create a new copy of the workbook with your edits and changes the title. Saving doesn't overwrite the workbook, the current workbook will always be the default view.
- An unsaved workbook is just the default view.
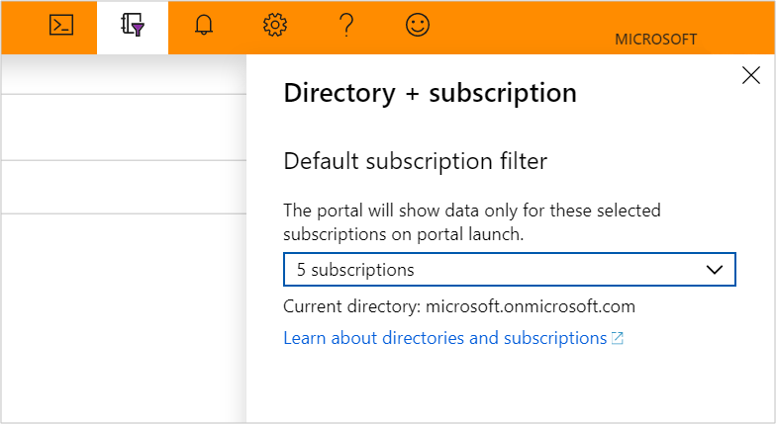
Why don’t I see all my subscriptions in the portal
The portal will show data only for selected subscriptions on portal launch. To change what subscriptions are selected, go to the top right and select the notebook with a filter icon. This option will show the Directory + subscriptions tab.
What is time range
Time range shows you data from a certain time frame. For example, if the time range is 24 hours, then it's showing data from the past 24 hours.
What is time granularity (time grain)
Time granularity is the time difference between two data points. For example, if the time grain is set to 1 second that means metrics are collected each second.
What is the time granularity once we pin any part of the workbooks to a dashboard
The default time granularity is set to automatic, it currently can't be changed at this time.
How do I change the timespan/ time range of the workbook step on my dashboard
By default the timespan/time range on your dashboard tile is set to 24 hours, to change this select the ellipses in the top right, select Customize tile data, check "override the dashboard time settings at the title level" box and then pick a timespan using the dropdown menu.
How do I change the title of the workbook or a workbook step I pinned to a dashboard
The title of the workbook or workbook step that is pinned to a dashboard retains the same name it had in the workbook. To change the title, you must save your own copy of the workbook. Then you'll be able to name the workbook before you press save.
To change the name of a step in your saved workbook, select edit under the step and then select the gear at the bottom of settings.
Next steps
Learn more about the scenarios workbooks are designed to support, how to author new and customize existing reports, and more by reviewing Create interactive reports with Azure Monitor workbooks.


