Enable resource logging in Azure Traffic Manager
This article describes how to enable collection of diagnostic resource logs and access log data for a Traffic Manager profile.
Azure Traffic Manager resource logs can provide insight into the behavior of the Traffic Manager profile resource. For example, you can use the profile's log data to determine why individual probes have timed out against an endpoint.
Prerequisites
If you don't have an Azure subscription, create a free account before you begin.
This guide requires a Traffic Manager profile. To learn more, see Create a Traffic Manager profile.
This guide requires an Azure Storage account. To learn more, see Create a storage account.
Azure Cloud Shell
Azure hosts Azure Cloud Shell, an interactive shell environment that you can use through your browser. You can use either Bash or PowerShell with Cloud Shell to work with Azure services. You can use the Cloud Shell preinstalled commands to run the code in this article, without having to install anything on your local environment.
To start Azure Cloud Shell:
| Option | Example/Link |
|---|---|
| Select Try It in the upper-right corner of a code or command block. Selecting Try It doesn't automatically copy the code or command to Cloud Shell. |  |
| Go to https://shell.azure.com, or select the Launch Cloud Shell button to open Cloud Shell in your browser. |  |
| Select the Cloud Shell button on the menu bar at the upper right in the Azure portal. |  |
To use Azure Cloud Shell:
Start Cloud Shell.
Select the Copy button on a code block (or command block) to copy the code or command.
Paste the code or command into the Cloud Shell session by selecting Ctrl+Shift+V on Windows and Linux, or by selecting Cmd+Shift+V on macOS.
Select Enter to run the code or command.
If you choose to install and use PowerShell locally, this article requires the Azure PowerShell module version 5.4.1 or later. Run Get-Module -ListAvailable Az to find the installed version. If you need to upgrade, see Install Azure PowerShell module. If you're running PowerShell locally, you also need to run Connect-AzAccount to create a connection with Azure.
Enable resource logging
Retrieve the Traffic Manager profile:
To enable resource logging, you need the ID of a Traffic Manager profile. Retrieve the Traffic Manager profile that you want to enable resource logging for with Get-AzTrafficManagerProfile. The output includes the Traffic Manager profile's ID information.
Get-AzTrafficManagerProfile -Name <TrafficManagerprofilename> -ResourceGroupName <resourcegroupname>Enable resource logging for the Traffic Manager profile:
Enable resource logging for the Traffic Manager profile using the ID obtained in the previous step with New-AzDiagnosticSetting. The following command stores verbose logs for the Traffic Manager profile to a specified Azure Storage account.
$subscriptionId = (Get-AzContext).Subscription.Id
$metric = @()
$log = @()
$categories = Get-AzDiagnosticSettingCategory -ResourceId  <TrafficManagerprofileResourceId>
$categories | ForEach-Object {if($_.CategoryType -eq "Metrics"){$metric+=New-AzDiagnosticSettingMetricSettingsObject -Enabled $true -Category $_.Name -RetentionPolicyDay 7 -RetentionPolicyEnabled $true} else{$log+=New-AzDiagnosticSettingLogSettingsObject -Enabled $true -Category $_.Name -RetentionPolicyDay 7 -RetentionPolicyEnabled $true}}
New-AzDiagnosticSetting -Name <DiagnosticSettingName> -ResourceId <TrafficManagerprofileResourceId> -StorageAccountId <storageAccountId> -Log $log -Metric $metric
Verify diagnostic settings:
Verify diagnostic settings for the Traffic Manager profile using Get-AzDiagnosticSetting. The following command displays the categories that are logged for a resource.
Get-AzDiagnosticSetting -ResourceId <TrafficManagerprofileResourceId>Ensure that all log categories associated with the Traffic Manager profile resource display as enabled. Also, verify that the storage account is correctly set.
Access log files
To access log files follow the following steps.
Sign in to the Azure portal.
Navigate to your Azure Storage account in the portal.
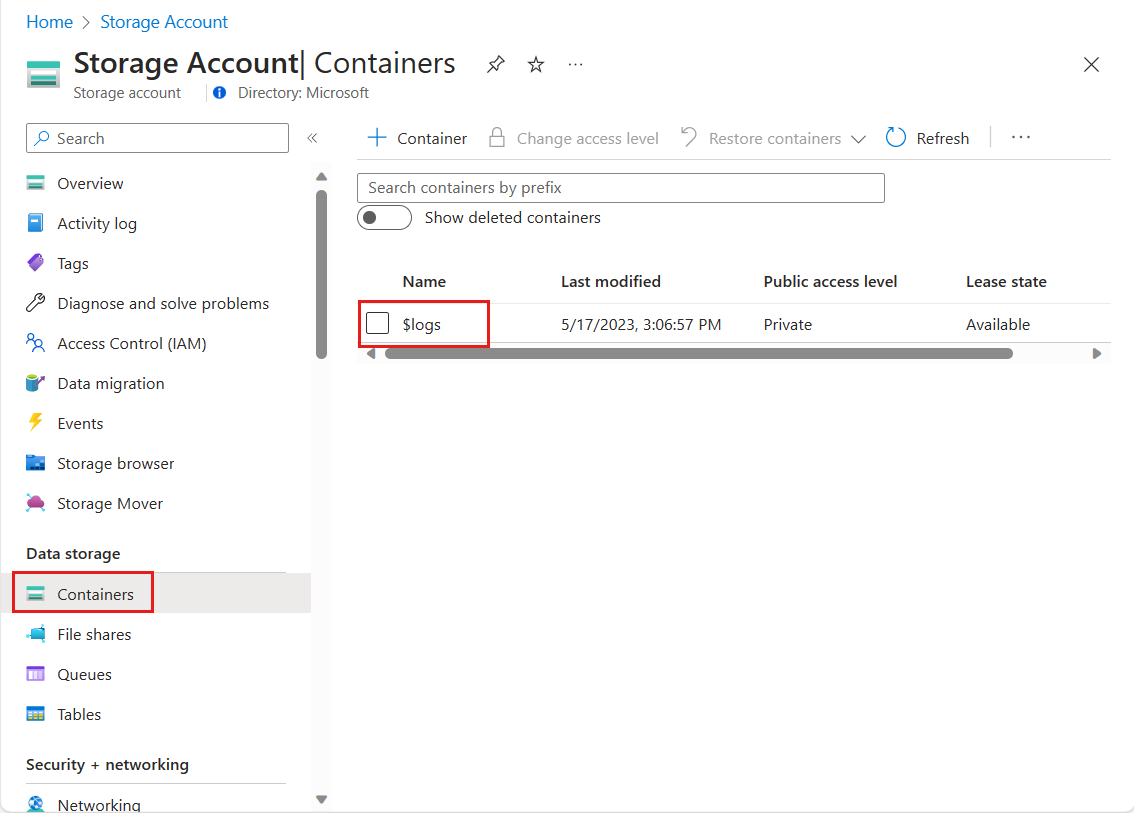
On the left pane of your Azure storage account, under Data Storage select Containers.
For Containers, select $logs, and navigate down to the PT1H.json file and select Download to download and save a copy of this log file.

Traffic Manager log schema
All resource logs available through Azure Monitor share a common top-level schema, with flexibility for each service to emit unique properties for their own events. For top-level resource logs schema, see Supported services, schemas, and categories for Azure Resource Logs.
The following table includes logs schema specific to the Azure Traffic Manager profile resource.
| Field Name | Field Type | Definition | Example |
|---|---|---|---|
| EndpointName | String | The name of the Traffic Manager endpoint whose health status is being recorded. | myPrimaryEndpoint |
| Status | String | The health status of the Traffic Manager endpoint that was probed. The status can either be Up or Down. | Up |
Next steps
- Learn more about Traffic Manager Monitoring