Ad-hoc analysis of finance data
This article explains how to use the Data Analysis feature to analyze finance data directly from list pages and queries. You don't have to run a report or switch to another application, such as Excel. The feature provides an interactive and versatile way to calculate, summarize, and examine data. Instead of running reports using options and filters, you can add multiple tabs that represent different tasks or views on the data. Some examples are "Total assets over time", "Accounts Receivable", "Accounts Payable," or any other view you can imagine. To learn more about how to use the Data Analysis feature, go to Analyze list and query data with analysis mode.
Use the following list pages to start doing ad-hoc analysis of finance processes:
Ad-hoc analysis scenarios in finance
Use the Data Analysis feature for quick fact checking and ad-hoc analysis:
- If you don't want to run a report.
- If a report for your specific need doesn't exist.
- If you want to quickly iterate to get a good overview on a part of your business.
The following sections provide examples of finance scenarios in Business Central.
| Area | To... | Open this page in analysis mode | Using these fields |
|---|---|---|---|
| Example: Finance (Accounts Receivable) | See what your customers owe you, for example, broken down into time intervals for when amounts are due. | Customer Ledger Entries | Customer Name, Due Date, and Remaining Amount |
| Finance (Accounts Payable) | See what you owe your vendors, maybe broken down into time intervals for when amounts are due. | Vendor Ledger Entries | Vendor Name, Document Type, Document No., Due Date Year, Due Date Month, and Remaining Amount. |
| Finance (Sales invoices by G/L account) | See how your sales invoices distribute over G/L accounts from the chart of accounts, for example, broken down into time intervals for when amounts were posted. | General Ledger Entries | G/L Account name, Source Code, G/L Account name, G/L Account No., Debit Amount, Credit Amount, Posting Date Year, Posting Date Quarter, and Posting Date Month |
| Finance (Income statement) | See your income over the income accounts from the chart of accounts, for example, broken down into time intervals for when amounts were posted. | General Ledger Entries | G/L Account No., Posting Date, and Amount. |
| Finance (total assets) | See your assets over the asset accounts from the chart of account, for example, broken down into time intervals for when amounts were posted. | General Ledger Entries | G/L Account No., Posting Date, and Amount. |
| Finance (transaction overview) | Get an overview of the types of transactions that happpen to your general ledger and the types of sources for them. | G/L Registers | Source code. |
Example: Finance (Accounts Receivable)
To see what your customers owe you, maybe broken down into time intervals for when amounts are due, follow these steps:
- Open the Customer Ledger Entries list, and choose
 to turn on analysis mode.
 - Go to the Columns menu and remove all columns (select the box next to the Search field on the right).
- Turn on the Pivot Mode* toggle (located above the Search field on the right).
- Drag the Customer Name field to the Row Groups area, and drag Remaining Amount to the Values area.
- Drag the Due Date Month field to the Column Labels area.
- To do the analysis for a given year or quarter, apply a filter in the Analysis Filters menu (located below the Columns menu on the right).
- Rename your analysis tab to Aged Accounts by Month, or something that describes this analysis.
The following image shows the result of these steps.
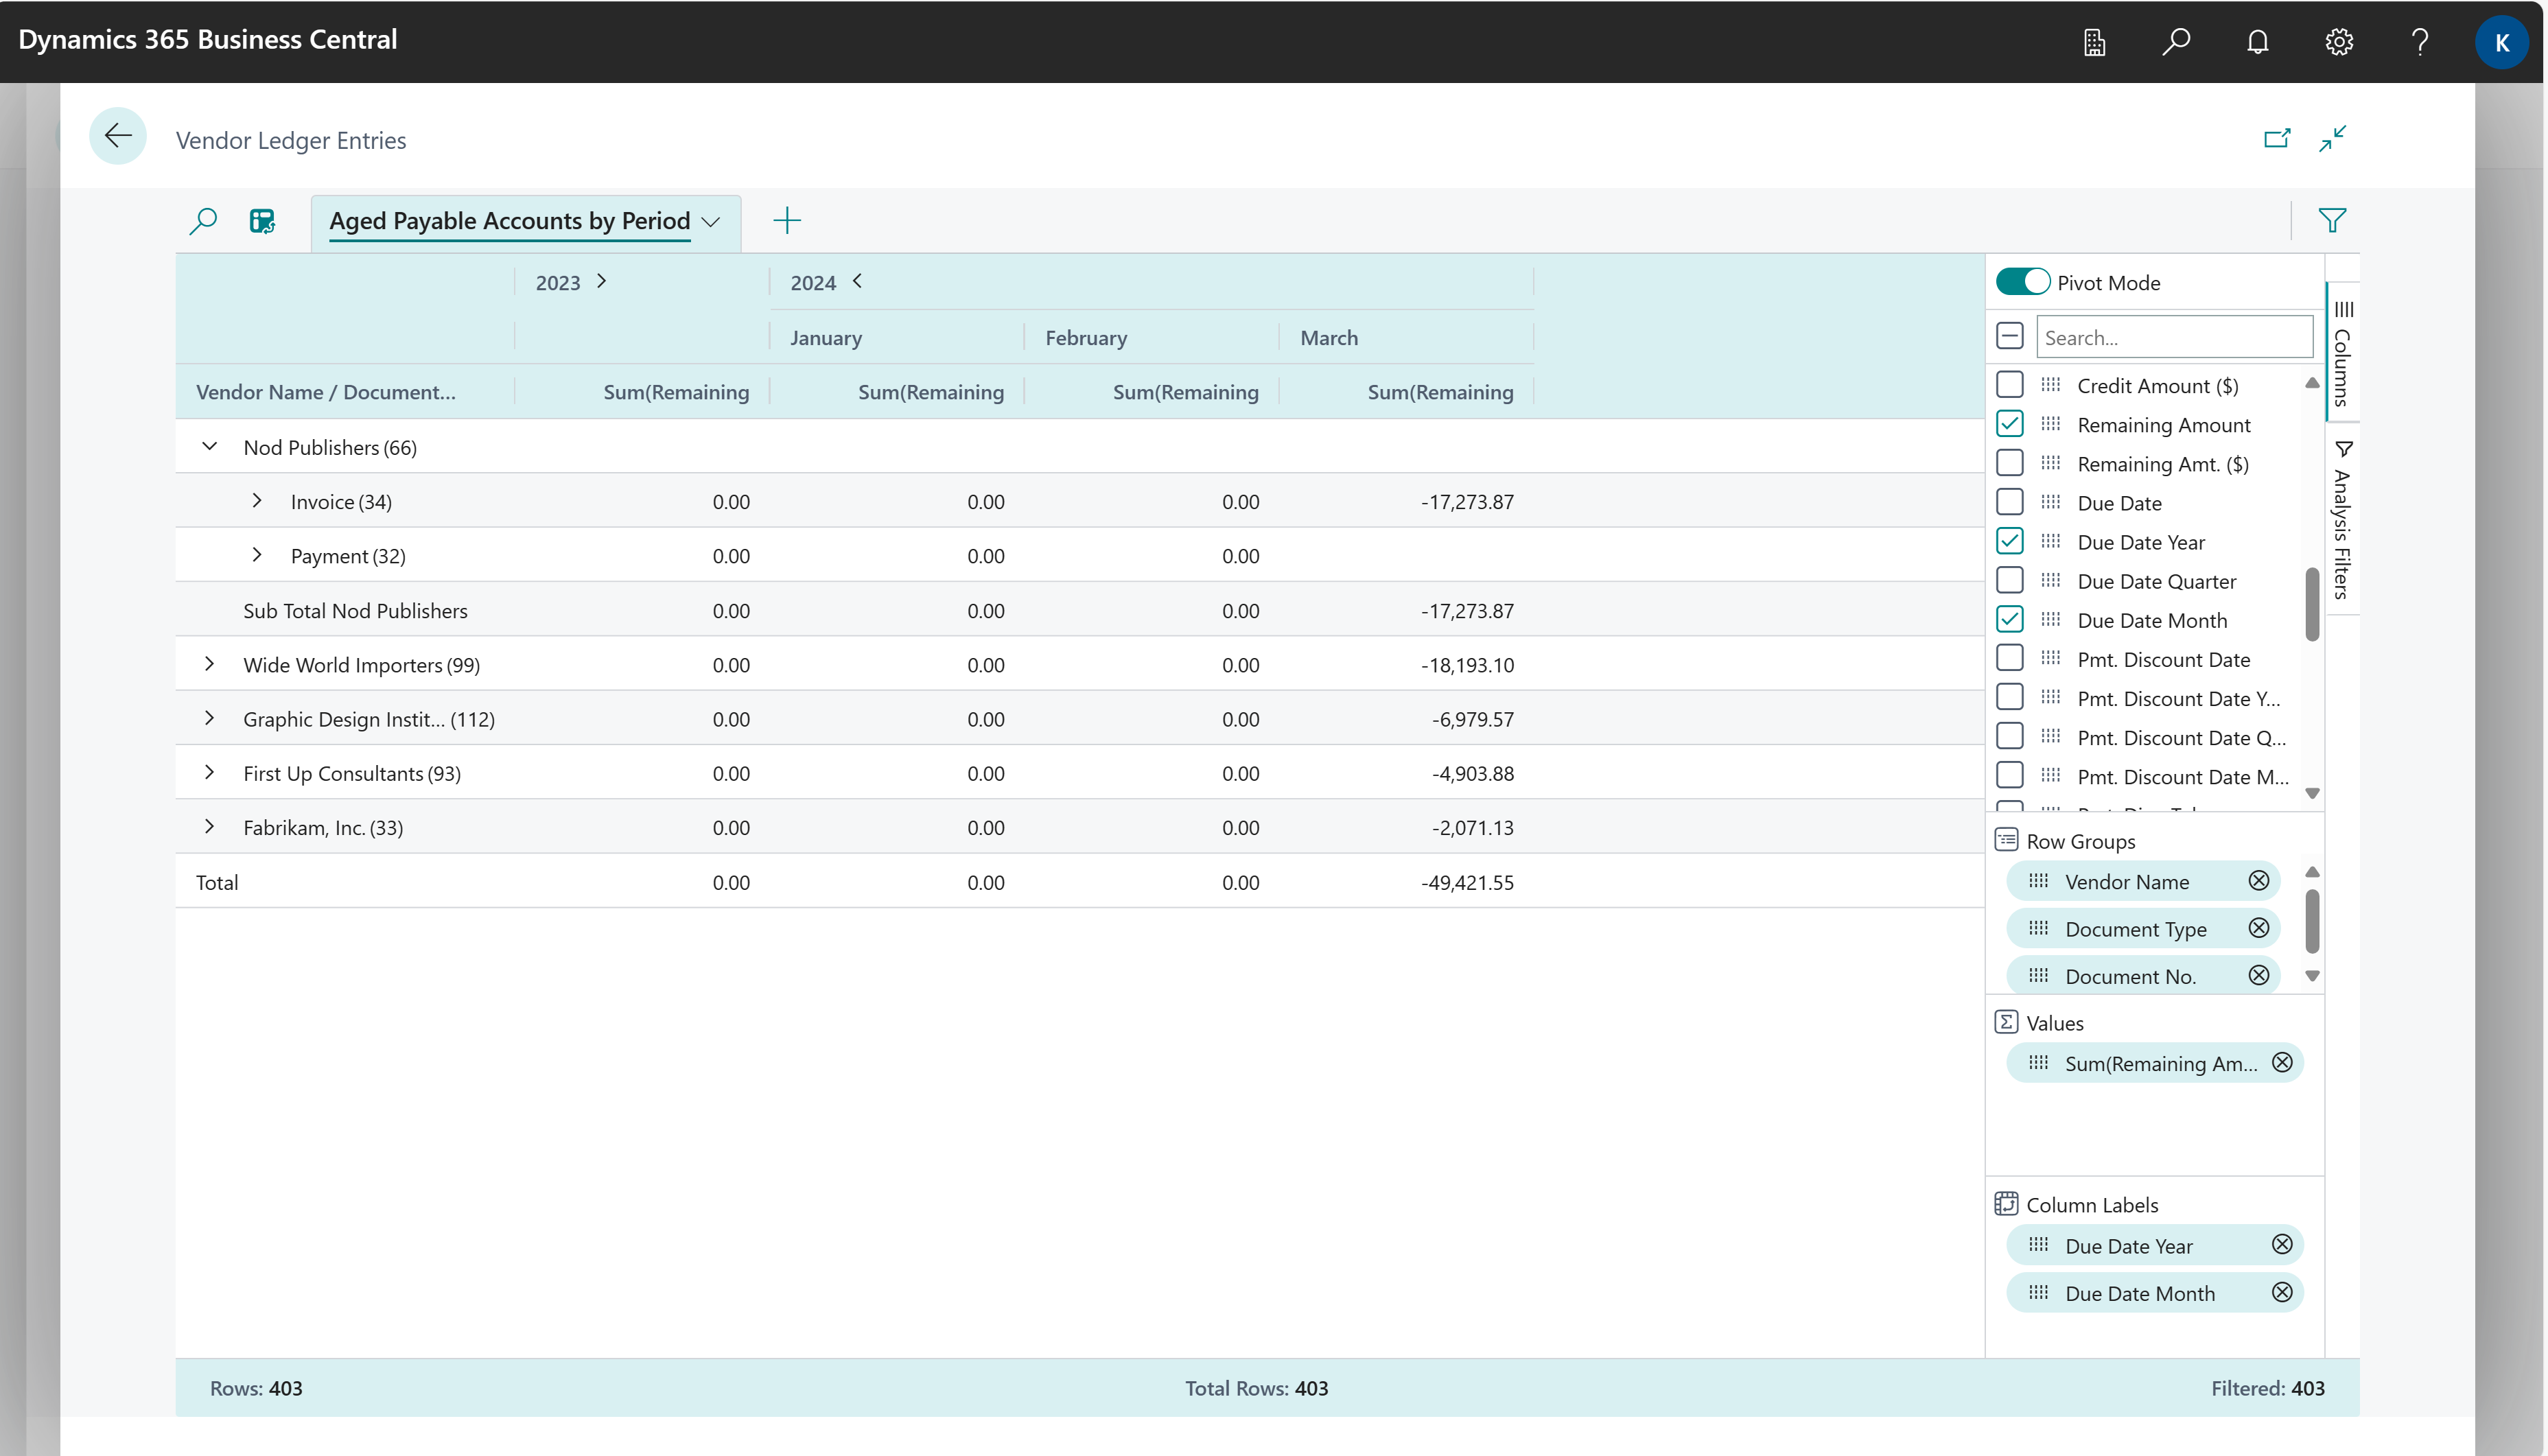
Example: Finance (Accounts Payable)
To see what you owe your vendors, maybe broken down into time intervals for when amounts are due, follow these steps:
- Open the Vendor Ledger Entries list page, and choose
 to turn on analysis mode.
 - Go to the Columns menu and remove all columns (select the box next to the Search field).
- Turn on the Pivot Mode toggle (located above the Search field on the right).
- Drag the Vendor Name, Document Type, and Document No. fields to the Row Groups area, and then drag the Remaining Amount field to the Values area.
- Drag the Due Date Year and Due Date Month fields to the Column Labels area. Drag the fields in that order.
- To do the analysis for a given year or quarter, apply a filter in the Analysis Filters menu (located below the Columns menu on the right).
- Rename your analysis tab to Aged Payable Accounts by Month, or something that describes this analysis.
The following image shows the result of these steps.
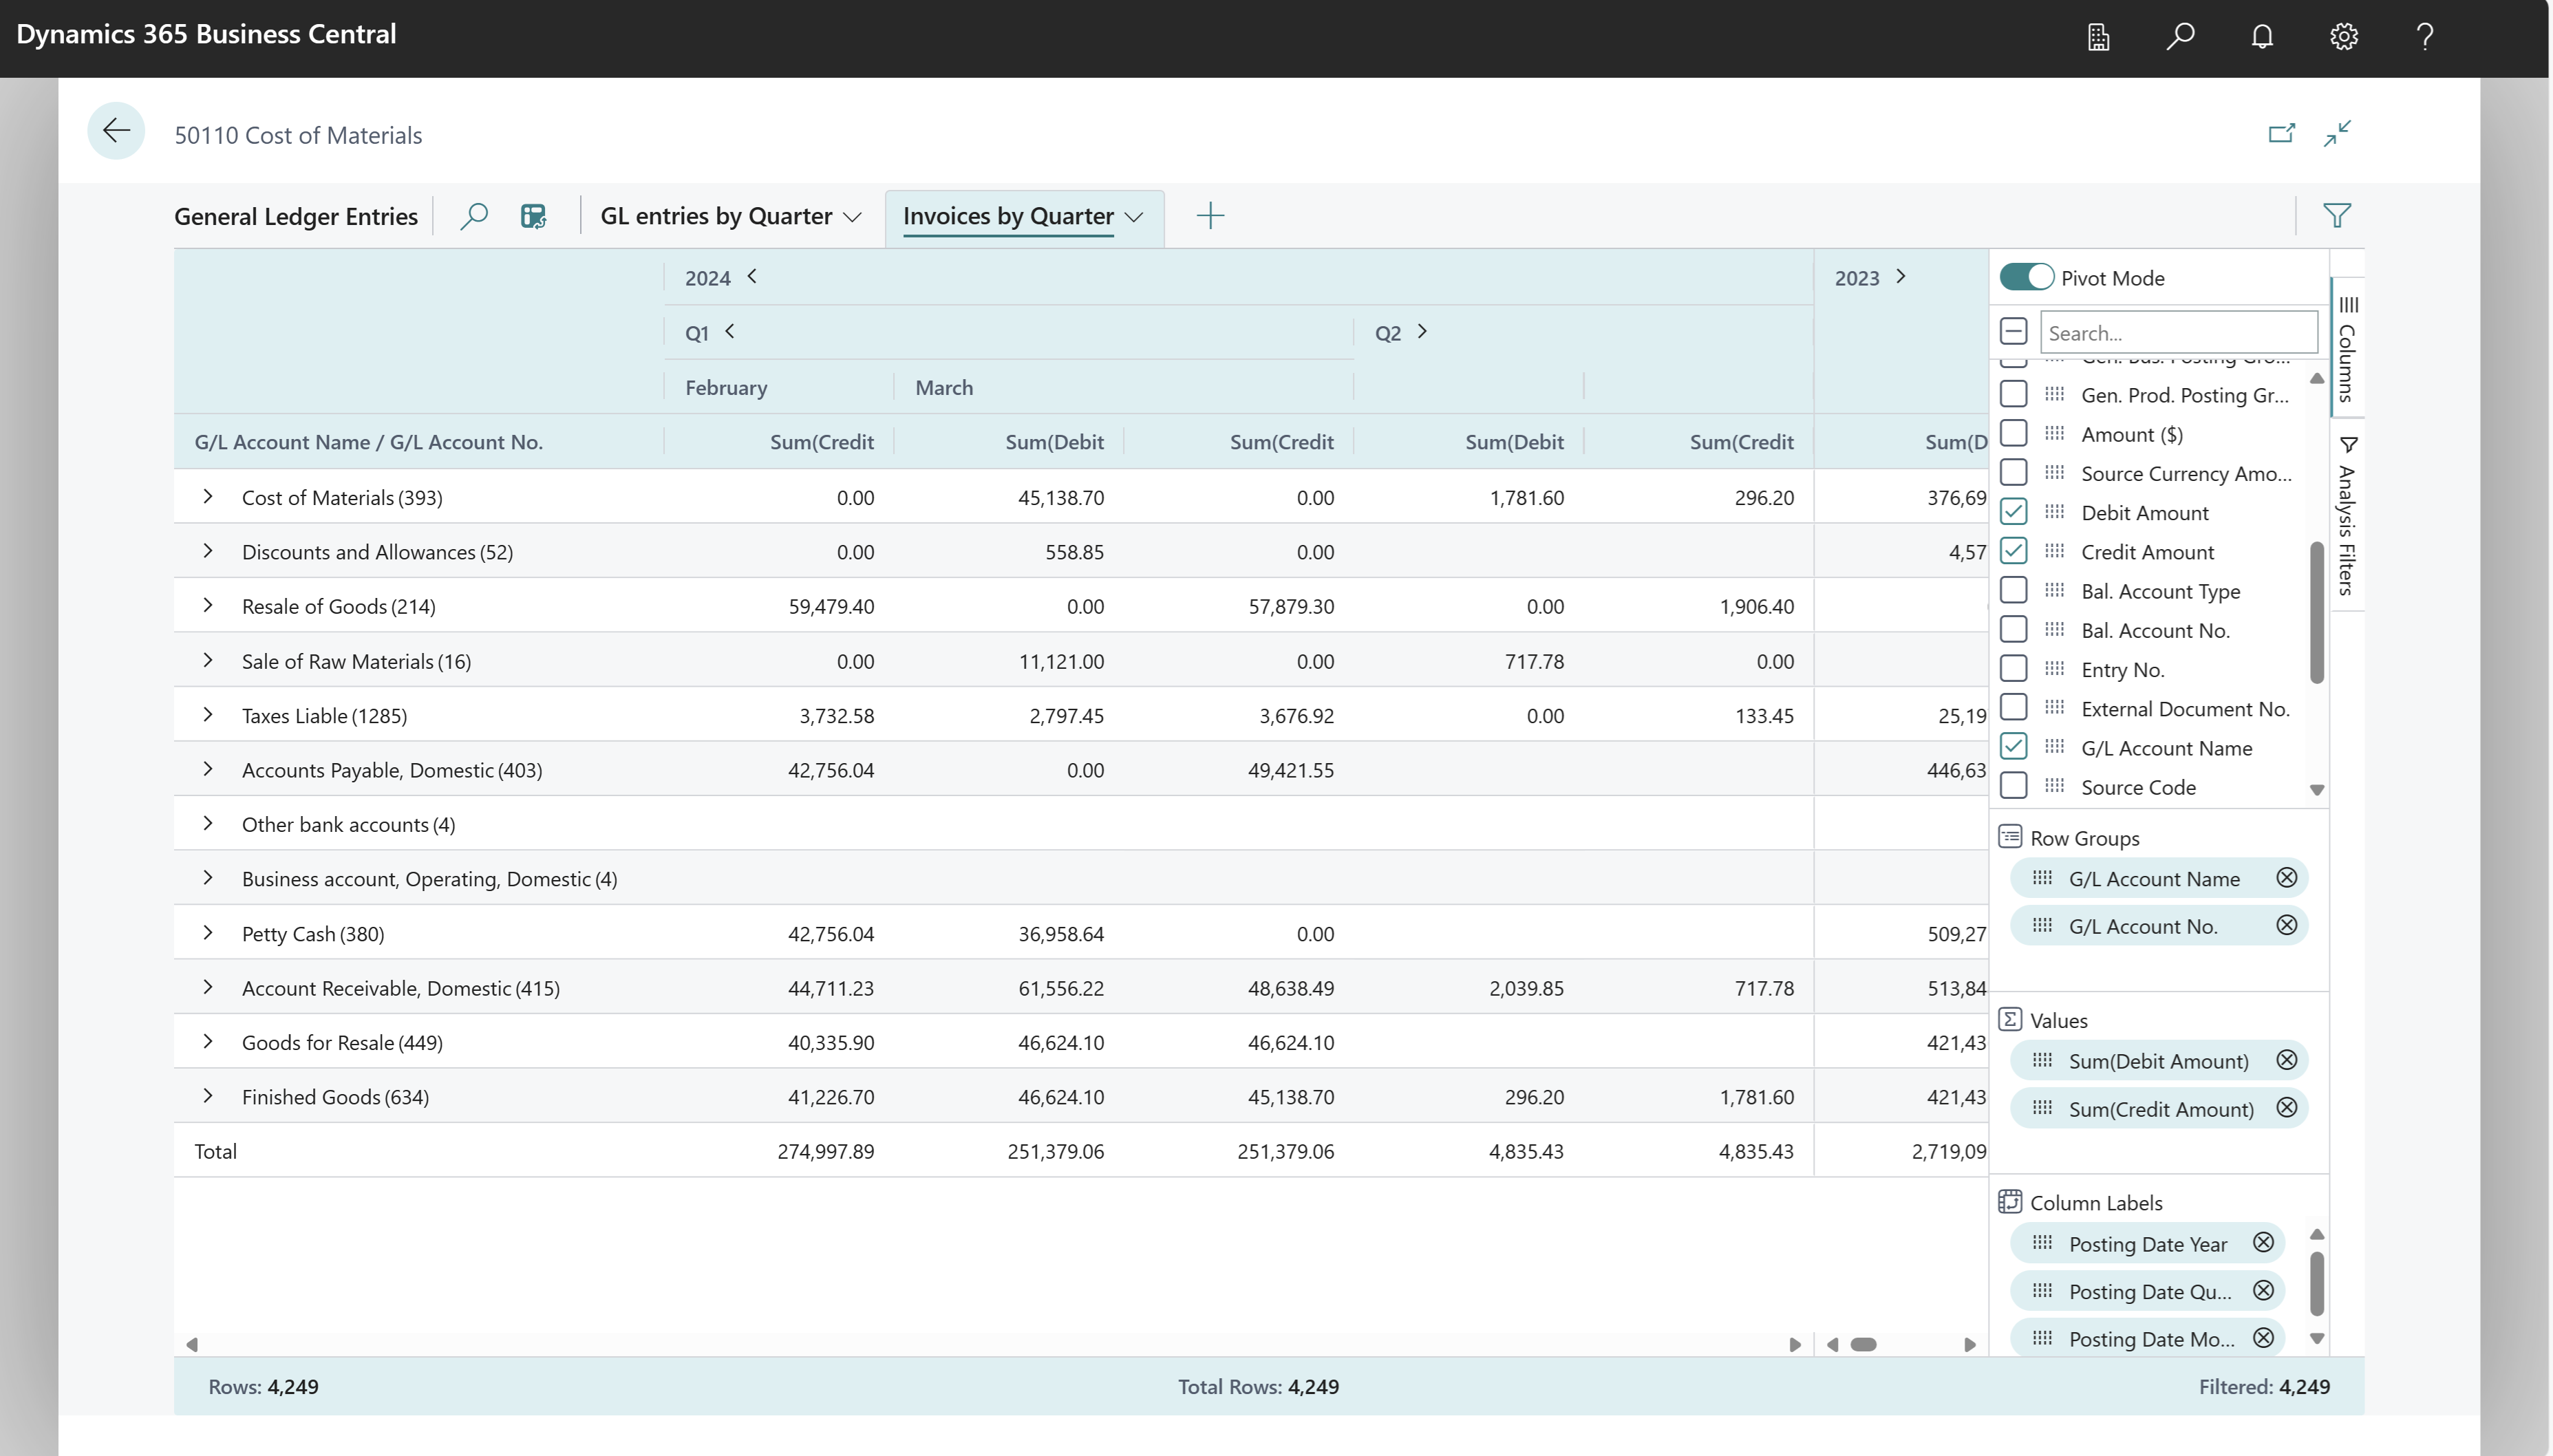
Example: Finance (Sales invoices by G/L account)
To see how your sales invoices distribute over G/L accounts from the chart of accounts, for example, broken down into time intervals for when amounts were posted, follow these steps:
- Open the General Ledger Entries page.
- Add the G/L Account name and Source Code fields by personalizing the page. On the Settings menu, choose Personalize.
- Exit personalization mode.
- Choose
 to turn on analysis mode.
 - On the Analysis Filters menu, set a filter on the Source Code field to SALES. If you have customizations that add other values, you can add those too.
- On the Columns menu, remove all columns (select the box next to the Search field).
- Turn on the Pivot Mode toggle (located above the Search field on the right).
- Drag the G/L Account name and G/L Account No. fields to the Row Groups area.
- Drag the Debit Amount and Credit Amount fields to the Values area.
- Drag the Posting Date Year, Posting Date Quarter, and Posting Date Month fields to the Column Labels area.
- Rename your analysis tab to Invoice breakdown by account, or something that describes this analysis.
The following image shows the result of these steps.
Example: Finance (Income statement)
To see your income over the income accounts from the chart of account, broken down into time intervals for when amounts were posted, follow these steps:
Open the General Ledger Entries list and choose
 to turn on analysis mode.
Go to the Columns menu and remove all columns (select the box next to the Search field on the right).
Turn on the Pivot Mode toggle (located above the Search field on the right).
Drag the G/L Account No. field to the Row Groups area, and drag Amount to the Values area.
Drag the Posting Date Month field to the Column Labels area.
For the income statement, filter on the accounts you use. In the Business Central demo data, these accounts start with "4", but your chart of accounts might be different. Set a filter on the accounts in the Analysis Filters menu (located below the Columns menu on the right).
Tip
To see which accounts is used in your setup, run the Trial Balance by Period report.
Rename your analysis tab to Income by Month, or something that describes this analysis.
Example: Finance (total assets)
To see your assets over the asset accounts from the chart of account, broken down into time intervals for when amounts were posted, do as follows:
Open the General Ledger Entries list and choose
 to turn on analysis mode.
Go to the Columns menu and remove all columns (select the box next to the Search field on the right).
Turn on the Pivot Mode toggle (located above the Search field on the right).
Drag the G/L Account No. field to the Row Groups area, and drag Amount to the Values area.
Drag the Posting Date Month field to the Column Labels area.
For the total assets statement, filter on the accounts you use. In the Business Central demo data, these accounts start with "10", but your chart of accounts might be different. Set a filter on appropriate accounts in the Additional Filters menu (located below the Columns menu on the right).
Tip
To see which accounts are used in your setup, run the Trial Balance by Period report.
Rename your analysis tab to Income by Month, or something that describes this analysis.
Example: Finance (transaction overview)
To get an overview of the types of transactions that happened to your general ledger and the types of sources for them, do as follows:
- Open the G/L Registers list and choose
 to turn on analysis mode.
 - Go to the Columns menu and remove all columns (select the box next to the Search field on the right).
- Drag the Source code field to the Row Groups area.
- Rename your analysis tab to GL entries by source, or something that describes this analysis.
Tip
You can perform this analysis during or after go-live of your environment to understand which types of transactions are used and which types are not yet being used.
The following image shows the result of these steps.
Data foundation for ad-hoc analysis on finance
When you post journals, Business Central creates entries in the G/L Entry table. Therefore, ad-hoc analysis on general finance is typically done on the General Ledger Entries page. For accounts receivable and payable, you can analyze Customer Ledger Entries and Vendor Ledger Entries, respectively.
Learn more in the following articles:
- Data foundation for ad-hoc analysis on sales
- Data foundation for ad-hoc analysis on purchasing
- Analyze G/L entries
See also
Analyze G/L entries
Analyze list and query data with analysis mode
Financial analytics overview
Analytics, business intelligence, and reporting overview
Finance overview
Work with Business Central


