Събитие
Световно първенство по Power BI DataViz
14.02, 16 ч. - 31.03, 16 ч.
С 4 шанса да участвате, можете да спечелите конферентен пакет и да стигнете до големия финал на ЖИВО в Лас Вегас
Научете повечеТози браузър вече не се поддържа.
Надстройте до Microsoft Edge, за да се възползвате от най-новите функции, актуализации на защитата и техническа поддръжка.
APPLIES TO: ![]() Power BI Desktop
Power BI Desktop ![]() Power BI service
Power BI service
Are you new to Power BI and want to try it out, but you don't have any data? Or maybe you'd like to see reports that illustrate some of the capabilities of Power BI. We've got you covered. Power BI offers different kinds of samples for different purposes. There are built-in samples and apps in the Power BI service, .pbix files, Excel datasets, and SQL databases. Here's a collection of different samples:
Our online documentation uses these same samples in tutorials and examples, so you can follow along.
The following image shows the Sales & Returns sample report.

Power BI report designers Miguel Myers and Chris Hamill created the Sales & Returns .pbix file to demonstrate many new features in Power BI, including buttons, drillthrough, conditional formatting, what-if, and customized tooltips.
The scenario for this report is a company that sells Microsoft-themed skateboards. They want to see the state of their sales and returns, and analyze how they should modify their operations.
You can explore it these ways:
There are revised versions of some of the original samples. These new versions take the original semantic models and incorporate the latest visualizations.
To obtain these samples:
Eight original samples are available for you to use. Each sample represents a different industry. You can engage with each in different formats:
The company obviEnce (www.obvience.com) and Microsoft teamed up to create samples for you to use with Power BI. The samples use anonymized data. The samples represent different industries: finance, HR, sales, and more.

These samples are available in several formats: as a built-in sample, as an Excel workbook, and as a Power BI .pbix file. If you don't know what these things are, or how to get your hands on them, don't worry. This article explains it all.
For each of these samples, we've created a tour. Tours are articles that tell the story behind the sample and walk you through different scenarios. One scenario might be answering questions for your manager, another might be looking for competitive insights, or creating reports and dashboards to share, or explaining a business shift.
Before we get started, here are the legal guidelines for using these samples. After that, we introduce the samples and show how to use them.
©2015 Microsoft Corporation. All rights reserved. The documents and workbooks are provided "as-is." Information and views expressed in the workbooks, including URL and other Internet Web site references, may change without notice. You bear the risk of using it. Some examples are for illustration only and are fictitious. No real association is intended or inferred. Microsoft makes no warranties, express or implied, with respect to the information provided here.
The workbooks do not provide you with any legal rights to any intellectual property in any Microsoft product. You may copy and use this workbook for your internal, reference purposes.
The workbooks and related data are provided by obviEnce. www.obvience.com
ObviEnce is an ISV and an Intellectual Property (IP) Incubator focused on Microsoft Business Intelligence. ObviEnce works closely with Microsoft to develop best practices and thought leadership for jump-starting and deploying Microsoft Business Intelligence solutions.
The workbooks and data are property of obviEnce, LLC, and have been shared solely for the purpose of demonstrating Power BI functionality with industry sample data.
Any uses of the workbooks and/or data must include the above attribution (that is also on the Info worksheet included with each workbook). The workbook and any visualizations must be accompanied by the following copyright notice: obviEnce ©.
By clicking any of the following links to download the Excel workbook files or .pbix files, you are agreeing to the terms above.
Take a tour of the Customer Profitability sample
This industry sample analyzes a CFO's key metrics for the company's executives, products, and customers. You can investigate what factors affect the company's profitability.
Take a tour of the updated Employee Hiring and History sample
This industry sample focuses on the hiring strategy for a company by analyzing new hires, active employees, and employees who have left. By exploring the data, you can find trends in voluntary separations and biases in the hiring strategy.
Take a tour of the previous version of the sample
Take a tour of the updated Corporate Spend sample
In this industry sample, analyze the planned versus actual costs of the IT department of a company. This comparison helps understand how well the company planned for the year and investigate areas with huge deviations from the plan. The company in this example goes through a yearly planning cycle, and then quarterly it produces a new Latest Estimate (LE) to help analyze changes in IT spend over the fiscal year.
Take a tour of the previous version of the sample
Take a tour of the Revenue Opportunities sample
This industry sample explores a software company's sales channel. Sales managers monitor their direct and partner sales channels by tracking opportunities and revenue by region, deal size, and channel.
Take a tour of the previous version of the sample
Take a tour of the Procurement Analysis sample
This industry sample analyzes a manufacturing company's spending on vendors by category and location. You can investigate who the top vendors are, what categories the company spends the most on, and which vendors give the best discounts.
Take a tour of the Regional Sales sample
This industry sample contains a report for a fictitious company named Contoso. The Contoso sales manager created this report to understand their products and regions' key contributors for revenue won or loss.
Take a tour of the Store Sales sample
This industry sample analyzes retail sales data of items sold across multiple stores and districts. The metrics compare this year's performance to last year's in these areas: sales, units, gross margin, variance, and new store analysis.
Take a tour of the updated Competitive Marketing Analysis sample
This industry sample analyzes a manufacturing company, VanArsdel Ltd. It allows the Chief Marketing Officer to watch the industry and the market share for VanArsdel. By exploring the sample, you can find the company's market share, product volume, sales, and sentiment.
Take a tour of the previous version of the sample
Take a tour of the Supplier Quality sample
This industry sample focuses on one of the typical supply chain challenges: supplier quality analysis. Two primary metrics are at play in this analysis: total number of defects and the total downtime that these defects caused. This sample has two main objectives:
Let's start with the built-in samples. The built-in samples are available in the Power BI service. You don't have to leave Power BI to find them. These samples are each a bundle of one or more dashboards, semantic models, and reports that you can use with the Power BI service. These built-in samples aren't available for Power BI Desktop.
Open the Power BI service (app.powerbi.com) and sign in.
Select Learn in the left nav.

On the Learning center page, under Sample reports, scroll until you see a sample you want to open.
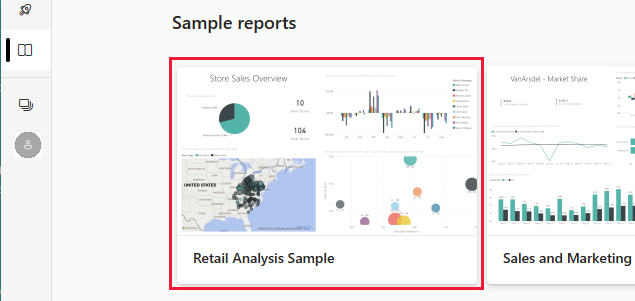
Select the sample. It opens in Reading mode.
Power BI imports the built-in sample. It adds a new report, and semantic model to My workspace. Some samples also include a dashboard. Use the samples to take Power BI for a test run.

Now that you have data, you're on your way. Try out some of our tutorials using the built-in samples or just open the Power BI service and explore.
The updated samples are also available as Power BI .pbix files. The .pbix files are designed to be used with Power BI Desktop.
Download the files individually using these links. Selecting these links saves the file automatically to your Downloads folder.
In Power BI Desktop, select File > Open, navigate to the location where you saved the sample .pbix file, and select the .pbix file to open it in Power BI Desktop.
Several of the original built-in samples now have updated versions and these samples are available as .pbix files. Also, six of the original built-in samples are available as Power BI .pbix files. The .pbix files are designed to be used with Power BI Desktop.
Download the files individually using these links. Selecting these links saves the file automatically to your Downloads folder.
Updated samples:
Original samples:
In Power BI Desktop, select File > Open, navigate to the location where you saved the sample .pbix file, and select the .pbix file to open it in Power BI Desktop.
Each of the built-in samples is also available as an Excel workbook. The Excel workbooks are designed to be used as a data source in the Power BI service or Power BI Desktop. If you're an advanced Excel user, you can explore or edit the data models in the Power Pivot add-in to Excel.
Download one or all of the sample Excel files from this GitHub repository.
Save the downloaded file. Where you save the file makes a difference.
 Local: If you save your file to a local drive on your computer, you can publish the files to Power BI from Excel. After you've published it, there's no remaining relationship between your local file and the file in the Power BI service.
 OneDrive - Business: If you have OneDrive for work or school and you sign in with the same account as Power BI, you can easily keep your work in your Excel file in sync with Power BI. Power BI and OneDrive are both in the cloud. Power BI connects to your file on OneDrive about every hour. If Power BI detects any changes to the files in OneDrive, it automatically updates your semantic models, reports, and dashboards in the Power BI service.
You can use the files as data sources in Power BI Desktop, or Publish to Power BI from Excel to the Power BI service. When you publish, choose one of these options:
Want to understand how the data in these Excel workbooks gets converted to Power BI semantic models and reports? Opening the Excel samples in Excel and exploring the worksheets provides some of the answers.
When you first open a sample workbook in Excel, you might see two warnings. The first warning says the workbook is in Protected View. Select Enable Editing. The second warning might say that the workbook has external data connections. Select Enable Content.
There's only one Excel sheet, the Info sheet. It provides information about obviEnce, the company that created the sample, and explains how to see the data in Power Pivot.
Where's the actual data? It's in the Power Pivot data model. On the PowerPivot tab, select Manage. In Power Pivot, you can see the data in all the underlying tables, plus all the DAX formulas.
Съвет
Don't see the Power Pivot tab? Enable the Power Pivot add-in.
Open the Power BI service (app.powerbi.com) and sign in.
Navigate to your My workspace or to another workspace, or create a workspace just for the sample.
In the upper-left corner of the workspace, select Upload, then select one of the sources.
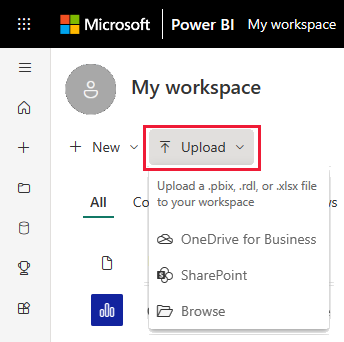
Select the file. Depending on where the file is, select Upload or Open.
The Power BI service uploads your Excel file.
More questions? Try the Power BI Community
Събитие
Световно първенство по Power BI DataViz
14.02, 16 ч. - 31.03, 16 ч.
С 4 шанса да участвате, можете да спечелите конферентен пакет и да стигнете до големия финал на ЖИВО в Лас Вегас
Научете повечеОбучение
Модул
Explore data in Power BI - Training
Turn your business intelligence data into data insights by creating and configuring Power BI dashboards.
Сертифициране
Microsoft Certified: Power BI Data Analyst Associate - Certifications
Demonstrate methods and best practices that align with business and technical requirements for modeling, visualizing, and analyzing data with Microsoft Power BI.