Бележка
Достъпът до тази страница изисква удостоверяване. Можете да опитате да влезете или да промените директориите.
Достъпът до тази страница изисква удостоверяване. Можете да опитате да промените директориите.
Note
The following connector article is provided by Supermetrics, the owner of this connector and a member of the Microsoft Power Query Connector Certification Program. If you have questions regarding the content of this article or have changes you would like to see made to this article, visit the https://supermetrics.com/ website and use the support channels there.
Summary
| Item | Description |
|---|---|
| Release State | Preview |
| Products | Power BI (Datasets) Power BI (Dataflows) Power Apps (Dataflows) |
| Authentication Types Supported | OAuth |
| Function reference docs | N/A |
Note
Some capabilities may be present in one product but not others due to deployment schedules and host-specific capabilities.
Prerequisites
Before using the connector, you need to create an account in the Supermetrics Hub and save at least one query.
Follow these steps to create and save a query:
Sign in to the Supermetrics Hub. using SSO (via either a Microsoft account or a Google Account).
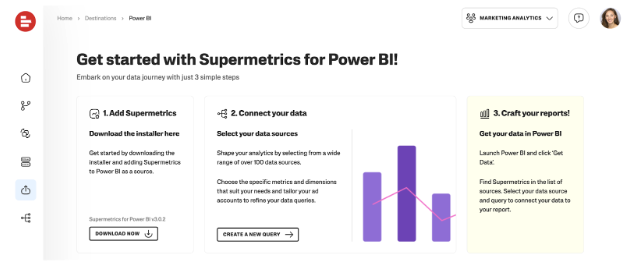
If you don’t see the Power BI page, open the left-hand navigation and go to Destinations > Power BI.
Select “Create new query” to get started.
Select a data source and sign in to your account to create a connection between your data source and Supermetrics. Find detailed instructions in our support center
Some public data sources, including Facebook Public Data, don’t need you to sign in. If you’re using one of these, skip this step.
Note
If you're trying to get data from popular data sources, such as Google Ads, Google Analytics 4, Facebook Insights, LinkedIn Ads, once you add a connection to the data source with Supermetrics, you can have a quick start with one of the template reports we offer.
Define the query settings for the data you’d like to see in your reports:
- Pick accounts to fetch data from.
- Define a date range - use a flexible date range, for example “last 2 months”, and always get data for the previous two months. Note that you can change the date range for a particular report using the connector.
- Enter metrics like Impressions or Clicks. See our full list of metrics and dimensions.
- Choose how to split the records, e.g. by date or campaign name.
Click Run to check if you get the expected records and select Save. Name your query and schema and confirm. Schema is like a folder to your queries.
The queries you save in the Hub are available to you in Power BI Desktop once you sign in to the Supermetrics connector. Feel free to connect multiple data sources and save queries in each to be able to create a combined report, say, from your Ads accounts across multiple marketing sources.
Capabilities supported
- Import
- Data import from multiple sources
Connection instructions
To connect to Supermetrics
Open Power BI Desktop.
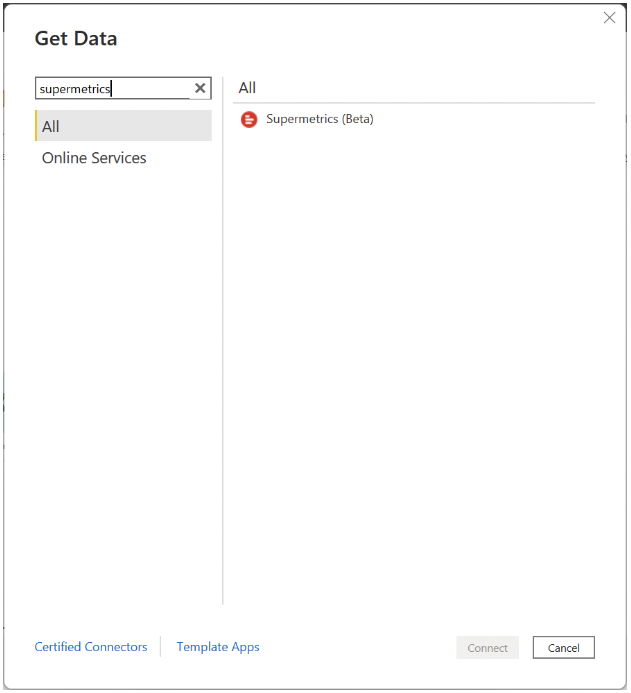
Navigate to the Home ribbon and select Get Data.
Search for Supermetrics. Select it, and select Connect. The first time you use the connector, sign in with the same Microsoft account or Google Account that you used in Supermetrics Hub.
If you’re connecting to Supermetrics for the first time, you see a third-party notice. Select Don't warn me again with this connector if you don't want this message to be displayed again, and then select Continue.
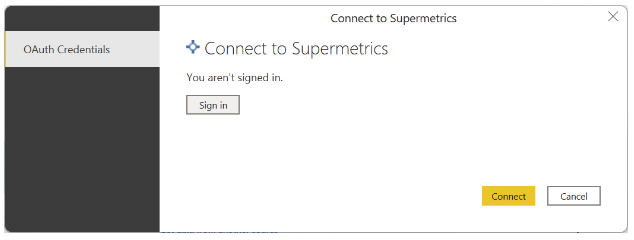
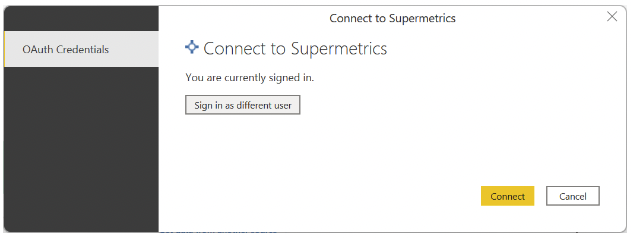
Select Sign in to sign in to your Supermetrics account.
Use single sign-on (SSO) in the Supermetrics window that appears: Select Sign in with Microsoft or Sign in with Google and choose the account that you used to sign in to the Supermetrics Hub.
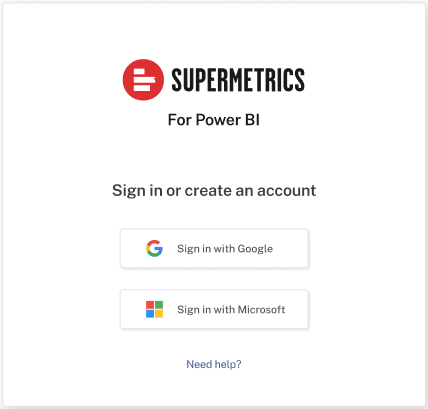
Once you sign in, select Continue.
Select Connect.
Once the Navigator dialog box loads, you're able to preview all the queries you saved in your Supermetrics account on the Hub. They'll be organized in folders by the data source on the left. Select the checkboxes next to any queries with data you’d like to use for your report.
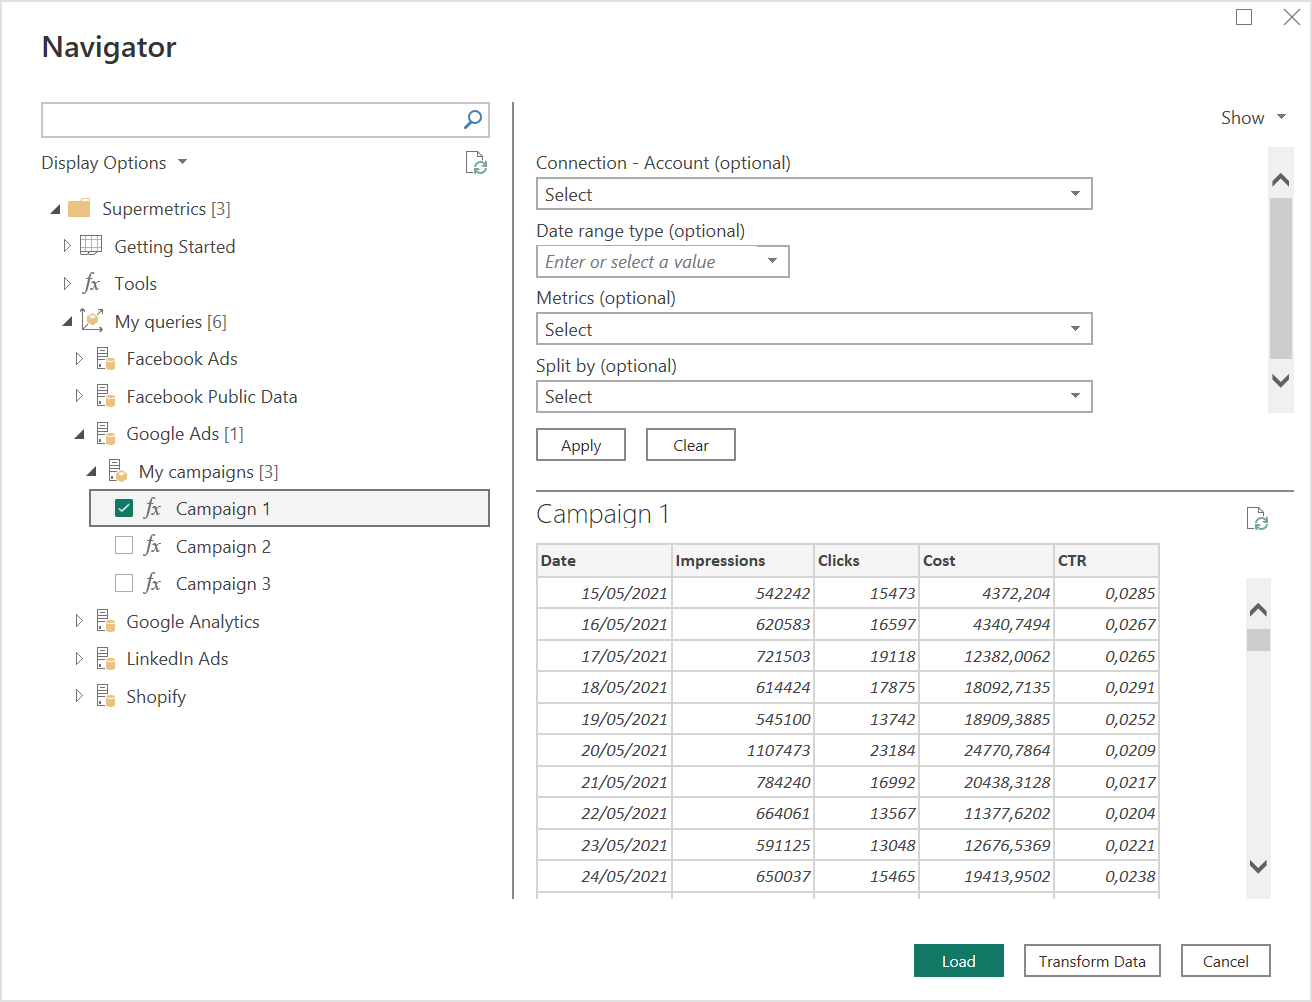
The preview loads with the saved query settings, however, you can make some changes before loading the data to your report by using the settings above the preview:- Under Connection - Account you can choose a different set of accounts for the same query settings. If you have multiple connections, you can change it here as well. Make sure you always select accounts within only one data source connection. Select Ok and Apply to load data with the changes.
- If you want to check the data for a different time period than the one specified in the saved query, select the necessary option in the “Date range type” field and select Apply. When you select options like “This month” or “Year to date”, the refreshes always bring the latest data to your report.
- You can choose a new set of metrics or change how you split the records using the “Metrics” or “Dimensions” fields respectively. Remember to select Ok and Apply the changes.
If you make changes to only one of the fields, other settings remain the same as you saved them on the Hub.
Once you see the dataset you’d like to use, select Load to use it in Power BI Desktop, or Transform to refine it in the Power Query Editor first.
Limitations
- Query manager must be used to create and manage queries
- The timeout limit for polling the query results is 30 minutes
Known issues
Query authentication "email@domain.com" is no longer available.
Possible reasons:
- The connection between Supermetrics and the data source expired. You need to reconnect in Supermetrics Hub.
Next steps
You might also find the following Supermetrics information useful: