Note
Access to this page requires authorization. You can try signing in or changing directories.
Access to this page requires authorization. You can try changing directories.
You can use Copilot to write and explain Data Analysis Expressions (DAX) queries in DAX query view of a Power BI semantic model.
Enable Copilot
Check to make sure you meet the Fabric Copilot requirements.
Power BI Desktop
In Power BI Desktop, in the Preview features section of the Options, enable DAX query view with Copilot.
- Open Power BI Desktop.
- Open an existing Power BI report or connect to published semantic model as live edit or live connection. Alternatively, you can add data and create a new semantic model and report.
- Go to DAX query view, the fourth view available on the left side of Power BI Desktop.
- Create a new query tab.
- Open Copilot by clicking on the Copilot button or using CTRL + I.

Power BI service or workspace
- Choose a published semantic model in a workspace.
- From the context menu choose Write DAX queries. If Write DAX queries is greyed out, you may need to enable Users can edit data models in the Power BI service (preview) in the Power BI General section of Workspace settings.
- Create a new query tab.
- Open Copilot by clicking on the Copilot button or using CTRL + I.

Note
DirectQuery and Direct Lake model authors can also use DAX query view. View the data in your tables whenever you want.
Use Copilot
Let’s look at what Copilot can help you with in DAX query view:
- Natural language to DAX query. Just ask for what you want from your semantic model and have the DAX query generated by Copilot. You can also select an existing DAX query and have Copilot modify it.
- DAX query to natural language. Ask Copilot to explain what any DAX query is doing.
- Understand DAX concepts. Maybe you heard about a certain DAX function or need to find the right DAX function for the job. Copilot can help you here too.
To use Copilot to create a DAX query, type in a prompt to describe what DAX query you would like generated and select Send or press Enter. Alternatively, you can click the Write DAX query inspire button. To run what is returned, select Run or press F5 to see the results of the DAX query. To keep the query and exit Copilot, select Keep query to add it to query tab.
To use Copilot to explain a DAX query, select the DAX query and click the Explain this query inspire button. A short explanation is shown with the option to show more to see a longer explanation.
To use Copilot to explain a DAX topic, click the Explain a DAX topic inspire button, or type in a prompt to ask for an explanation of a DAX function or topic and select Send or press Enter. A short explanation is shown with the option to show more to see a longer explanation.
Features of the inline Copilot
1. Run the DAX query before you keep it
You can Run the DAX query then decide to Keep or Discard the DAX query.

2. Build the DAX query conversationally
After the initial DAX query is generated, you can simply adjust by typing in additional user prompts.

3. Syntax checks on the generated DAX query
The generated DAX query syntax is checked, and the prompt automatically retried once. If the retry is also invalid, the generated DAX query is returned with a note that there is an issue, giving you the option to rephrase your request or fix the generated DAX query:
"This query contains errors. Rephrase your request and try again or try fixing it yourself."
4. Inspire buttons to get you started with Copilot
Type in a prompt or select any of these buttons to see quickly what you can do with Copilot.

Sample prompts
These sample prompts can illustrate how to use Copilot to write DAX queries.
Write a DAX query
In a blank query tab, invoke Copilot with CTRL+I and enter this request:
"Write a DAX query to show profit by product"

After a few moments I get a DAX query.

I can select run to see the results before I keep the query.

I can conversationally make updates to my initial request. Type in "Add in Orders" and hit enter and Copilot adds in the additional measure. I can again run the query to see the results.

When I select keep query, the query is added to the query tab.
Add a column with the diff view
Let's now add a column to the existing DAX query. First I select the DAX query, then invoke Copilot. This time the selection is showing fitted to the text and the background shading highlights what is being sent with the request to Copilot. Type in this request, and hit enter:
"Add a column to show profit per order"

Now the diff styling in the DAX query editor shows exactly what Copilot has changed.

I select run to see the results, and keep query to add it to the query editor.

Explain a DAX query
Copilot can provide a detailed explanation of a DAX query. Again, select the entire DAX query and invoke Copilot. This time select the Explain this query button.

Now, instead of writing DAX queries, it’s responding in the inline Copilot.
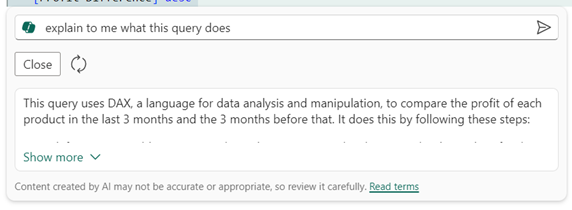
Copilot generates a few lines. I select Show more to see the full explanation.
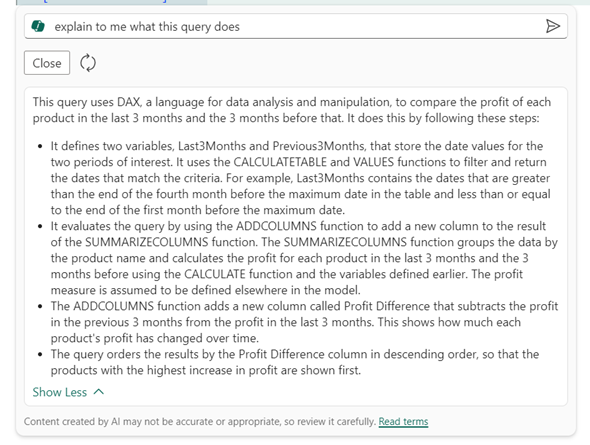
Now I understand each part and the DAX functions used.
Explain a DAX topic
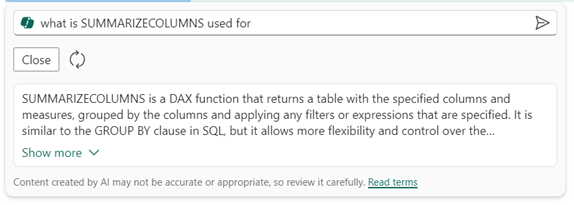
Copilot can also explain DAX functions with more detail. Let's ask about SUMMARIZECOLUMNS. In a new query tab, invoke Copilot, and sent the following request:
"Explain what SUMMARIZECOLUMNS is for"

Again, Copilot generates brief description:
I can select Show more to see a more detailed explanation with an example.
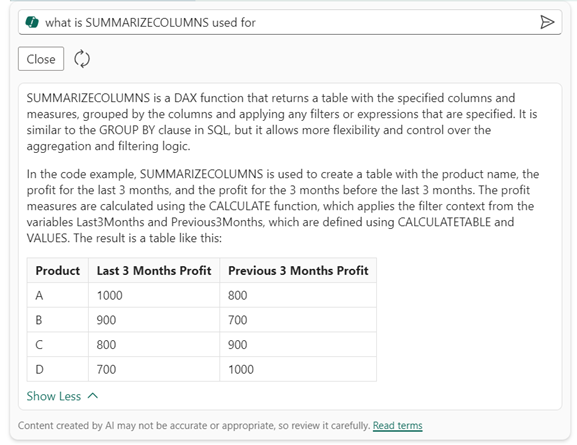
The example also uses columns in my model.
Fabric Copilot to help write DAX queries: Responsible AI FAQ
What is Fabric Copilot to help write DAX queries?
An inline Copilot found in Power BI DAX query view, available in the DAX query view of Power BI Desktop or write DAX queries in Power BI workspace, for model authors and consumers to request help creating DAX queries. The help can include explaining a DAX query and DAX topics, in addition to creating DAX queries themselves.
What can Fabric Copilot to help write DAX queries do?
The user request can be returned by Copilot as a DAX query the user can see, then run to see the data returned in the results grid. Additional requests can be made, and a new DAX query can be returned, creating a DAX query conversationally. If the request is about explaining a DAX query or topic, a natural language response is generated in the inline Copilot. DAX topics can include what a DAX function does or which DAX function is good for returning data in a specific way.
What is Fabric Copilot to help write DAX queries’ intended use?
Copilot’s intended use is to help create DAX queries on a specific semantic model the user is currently working with in Power BI.
How was Fabric Copilot to help write DAX queries evaluated? What metrics are used to measure performance?
DAX queries from multiple Power BI semantic models using a variety of user requests, categorized by data availability in the semantic model and/or if additional calculations were needed to create the correct response, and then graded for accuracy and performance by members of the product team. This included a semantic model adhering to best practices. Explanations from multiple DAX queries and DAX function topics, and then graded for accuracy and readability by members of the product team.
What are the limitations of Fabric Copilot to help write DAX queries? How can users minimize the impact of Fabric Copilot to help write DAX queries’ limitations when using the system?
- To use Copilot to help write DAX queries, you need to select a workspace with a Fabric capacity.
- Copilot uses the model metadata (tables, columns, measures), so DAX query responses will answer only in context of the current semantic model.
- Copilot uses the model metadata (tables, columns, measures), so providing rich metadata that is descriptive and understandable will yield better results.
- Copilot may use min/max to get sample values in import storage mode, but cannot use other data in the tables of the semantic model.
- Copilot may not be available or use reduced version of the model metadata (tables, columns, measures) when the number of model metadata items exceeds 500 tables, 1,000 columns or 3,000 measures in a table, 2,000 relationships, 10,000 total columns, 5,000 total measures, 5,000 characters in a single DAX expression, or 256 characters in a name.
- Copilot may use the description property on model metadata, but is limited to only the first 200 characters.
- DAX functions added recently may not be known to the Copilot, and explanations may be incorrect.
- Copilot requests include all text in the current query window, and if text is selected the selection information it is noted as selected, but all text in the query window is included.
What operational factors and settings allow for effective and responsible use of Fabric Copilot to help write DAX queries?
- Operational factors and settings include the current workload on a Fabric capacity and network speed.
- Copilot to help write DAX queries is contained in the privacy, security, and responsible use of Copilot in Fabric.
How do I provide feedback on Fabric Copilot to help write DAX queries?
- Use the thumbs up and thumbs down icons in the inline Copilot to provide feedback.
- Submit feedback using the Power BI support.