Hinweis
Für den Zugriff auf diese Seite ist eine Autorisierung erforderlich. Sie können versuchen, sich anzumelden oder das Verzeichnis zu wechseln.
Für den Zugriff auf diese Seite ist eine Autorisierung erforderlich. Sie können versuchen, das Verzeichnis zu wechseln.
Erstellen benutzerdefinierter Karten
Mithilfe von formatter für Kataloge können Sie ein völlig benutzerdefiniertes Layout von Feldwerten in einer Karte unter Verwendung derselben Syntax definieren, die bei der Spaltenformatierung verwendet wird.
Beispiel: mehrzeilige benutzerdefinierte Karte
Die folgende Abbildung zeigt eine angepasste Karte im Kataloglayout:

{
  "$schema": "https://developer.microsoft.com/json-schemas/sp/v2/tile-formatting.schema.json",
  "height": "250",
  "width": "350",
  "hideSelection": true,
  "formatter": {
    "elmType": "div",
    "style": {
      "display": "flex",
      "align-items": "stretch",
      "margin-bottom": "16px",
      "min-width": "150px",
      "flex-grow": "1",
      "justify-content": "space-around",
      "padding": "5px"
    },
    "children": [
      {
        "elmType": "div",
        "style": {
          "width": "95%",
          "height": "92%",
          "box-shadow": "0px 1.6px 3.6px 0 #00000024, 0px 0.3px 0.9px 0 #00000024",
          "overflow": "hidden",
          "border-radius": "2px",
          "padding-left": "16px",
          "padding-top": "16px"
        },
        "attributes": {
          "class": "ms-bgColor-neutralLighterAlt"
        },
        "children": [
          {
            "elmType": "div",
            "style": {
              "text-align": "left"
            },
            "children": [
              {
                "elmType": "div",
                "style": {
                  "color":"#333333",
                  "font-size": "16px",
                  "font-weight":"600",
                  "margin-bottom":"5px"
              },
                "txtContent": "[$Title]"
              },
              {
                "elmType": "div",
                "style": {
                  "color":"#333333",
                  "font-size": "14px",
                  "line-height":"1.8"
              },
                "attributes": {
                  "class": "sp-row-listPadding"
                },
                "txtContent": "[$Feedback]"
              },
              {
                "elmType": "button",
                "customRowAction": {
                  "action": "defaultClick"
                },
                "txtContent": "Give feedback",
                "attributes": {
                  "class": "sp-row-button"
                },
                "style": {
                  "display": {
                    "operator": "?",
                    "operands": [
                      {
                        "operator": "==",
                        "operands": [
                          "@me",
                          "[$Assigned_x0020_To.email]"
                        ]
                      },
                      "",
                      "none"
                    ]
                  }
                }
              }
            ]
          }
        ]
      }
    ]
  }

}
Benutzerdefinierte Gruppenkopfzeilen erstellen
Sie können groupProps verwenden, um Gruppenkopfzeilen zu formatieren, mit der Flexibilität, die Daten, den Anzeigename und die Anzahl der Elemente der gruppierten Spalte hinzufügen zu können. Sie können auch Gruppenaggregate in die Gruppenkopfzeilen einfügen.
Beispiel: Farbcodierte Gruppenkopfzeile
Im folgenden Beispiel haben wir eine Galerieansicht mit entsprechend den Spaltenmetadaten formatierten Gruppenkopfzeilen.
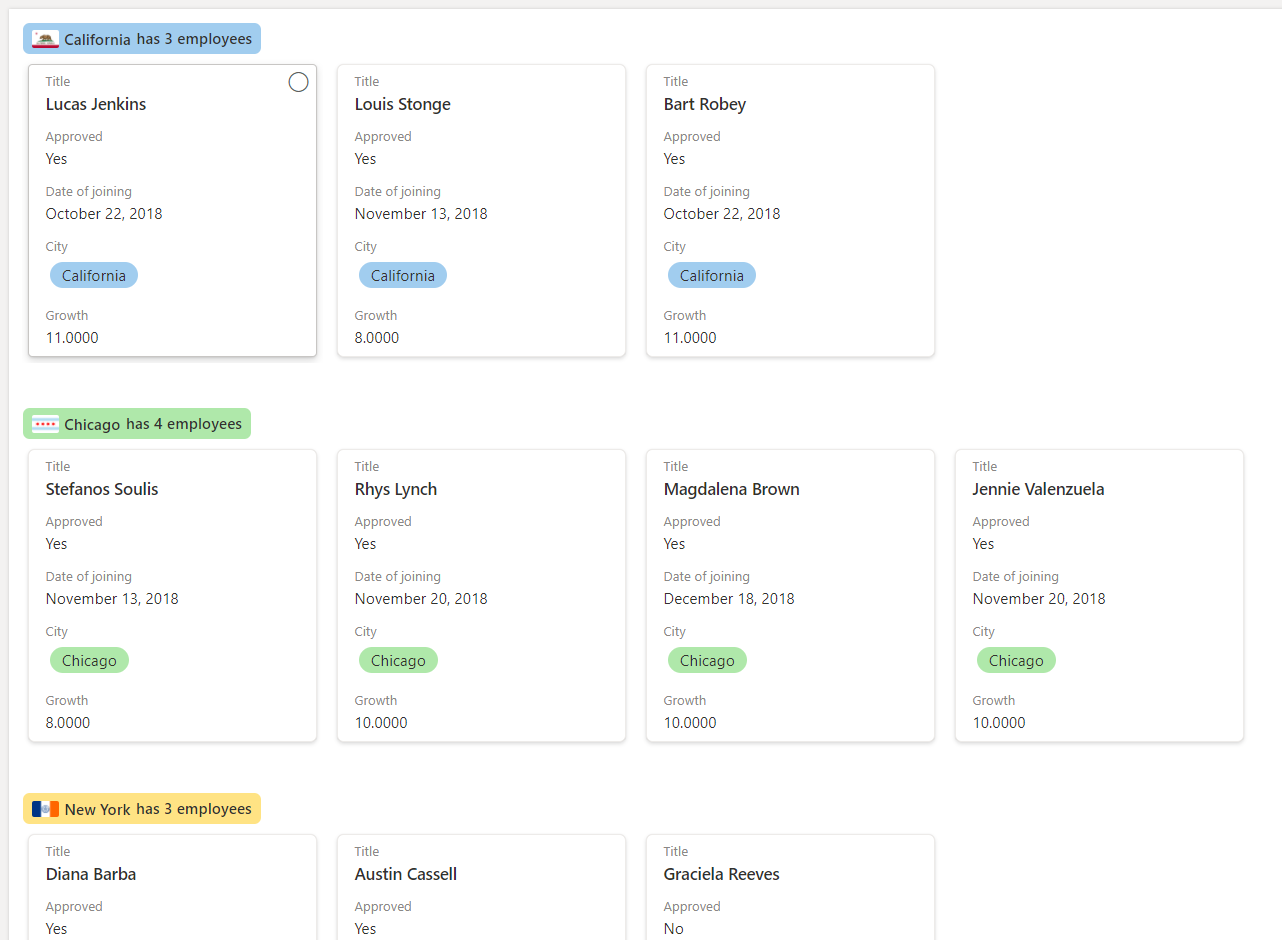
Hinweis
Der Formatierer für die Galeriekarte wird der Einfachheit halber im folgenden JSON übersprungen. Das folgende Beispiel enthält auch Zeilenumbrüche. Diese wurden hinzugefügt, um die Lesbarkeit des Codes zu verbessern.
{
  "$schema": "https://developer.microsoft.com/json-schemas/sp/v2/tile-formatting.schema.json",
  "height": 277,
  "width": 254,
  "hideSelection": false,
  "groupProps": {
    "headerFormatter": {
      "elmType": "div",
      "children": [
        {
          "elmType": "div",
          "style": {
            "flex-wrap": "wrap",
            "display": "flex",
            "box-sizing": "border-box",
            "padding": "4px 8px 5px 8px",
            "border-radius": "6px",
            "align-items": "center",
            "white-space": "nowrap",
            "overflow": "hidden",
            "margin": "1px 4px 4px 1px"
          },
          "attributes": {
            "class": "=if(@group.fieldData == 'California', 'sp-css-backgroundColor-blueBackground37',
                       if(@group.fieldData == 'Chicago', 'sp-css-backgroundColor-successBackground50',
                       if(@group.fieldData == 'New York', 'sp-css-backgroundColor-warningBackground50',
                       if(@group.fieldData == 'Seattle', 'sp-css-backgroundColor-blockingBackground50',
                       if(@group.fieldData == 'Washington DC', 'sp-css-backgroundColor-errorBackground50',
                       'sp-field-borderAllRegular sp-field-borderAllSolid sp-css-borderColor-neutralSecondary'))))"
          },
          "children": [
            {
              "elmType": "img",
              "attributes": {
                "src": "=if(@group.fieldData == 'California', 'https://upload.wikimedia.org/wikipedia/commons/thumb/0/01/Flag_of_California.svg/1920px-Flag_of_California.svg.png',
                         if(@group.fieldData == 'Chicago', 'https://upload.wikimedia.org/wikipedia/commons/thumb/9/9b/Flag_of_Chicago%2C_Illinois.svg/1920px-Flag_of_Chicago%2C_Illinois.svg.png',
                         if(@group.fieldData == 'New York', 'https://upload.wikimedia.org/wikipedia/commons/thumb/b/ba/Flag_of_New_York_City.svg/2560px-Flag_of_New_York_City.svg.png',
                         if(@group.fieldData == 'Seattle', 'https://upload.wikimedia.org/wikipedia/en/thumb/6/6d/Flag_of_Seattle.svg/1920px-Flag_of_Seattle.svg.png',
                         if(@group.fieldData == 'Washington DC', 'https://upload.wikimedia.org/wikipedia/commons/thumb/d/d4/Flag_of_the_District_of_Columbia.svg/2560px-Flag_of_the_District_of_Columbia.svg.png', '')))))"
              },
              "style": {
                "max-width": "24px",
                "max-height": "24px",
                "margin-top": "2px",
                "border-radius": "2px"
              }
            },
            {
              "elmType": "div",
              "children": [
                {
                  "elmType": "span",
                  "style": {
                    "padding": "5px 5px 5px 5px",
                    "font-weight": "500"
                  },
                  "txtContent": {
                    "operator": "+",
                    "operands": [
                      "",
                      "@group.fieldData.displayValue"
                    ]
                  }
                }
              ]
            },
            {
              "elmType": "div",
              "children": [
                {
                  "elmType": "div",
                  "style": {
                    "display": "flex",
                    "flex-direction": "row",
                    "justify-content": "center"
                  },
                  "children": [
                    {
                      "elmType": "div",
                      "txtContent": "='has ' + @group.count + if(@group.count > '1', ' employees', ' employee')",
                      "style": {
                        "font-weight": "500"
                      }
                    }
                  ]
                }
              ]
            }
          ]
        }
      ]
    }
  }
}
Beispiel: Farbcodierte Gruppenkopfzeile mit Aggregat
Im folgenden Beispiel haben wir eine Liste mit Gruppenkopfzeilen und Gruppenaggregaten.
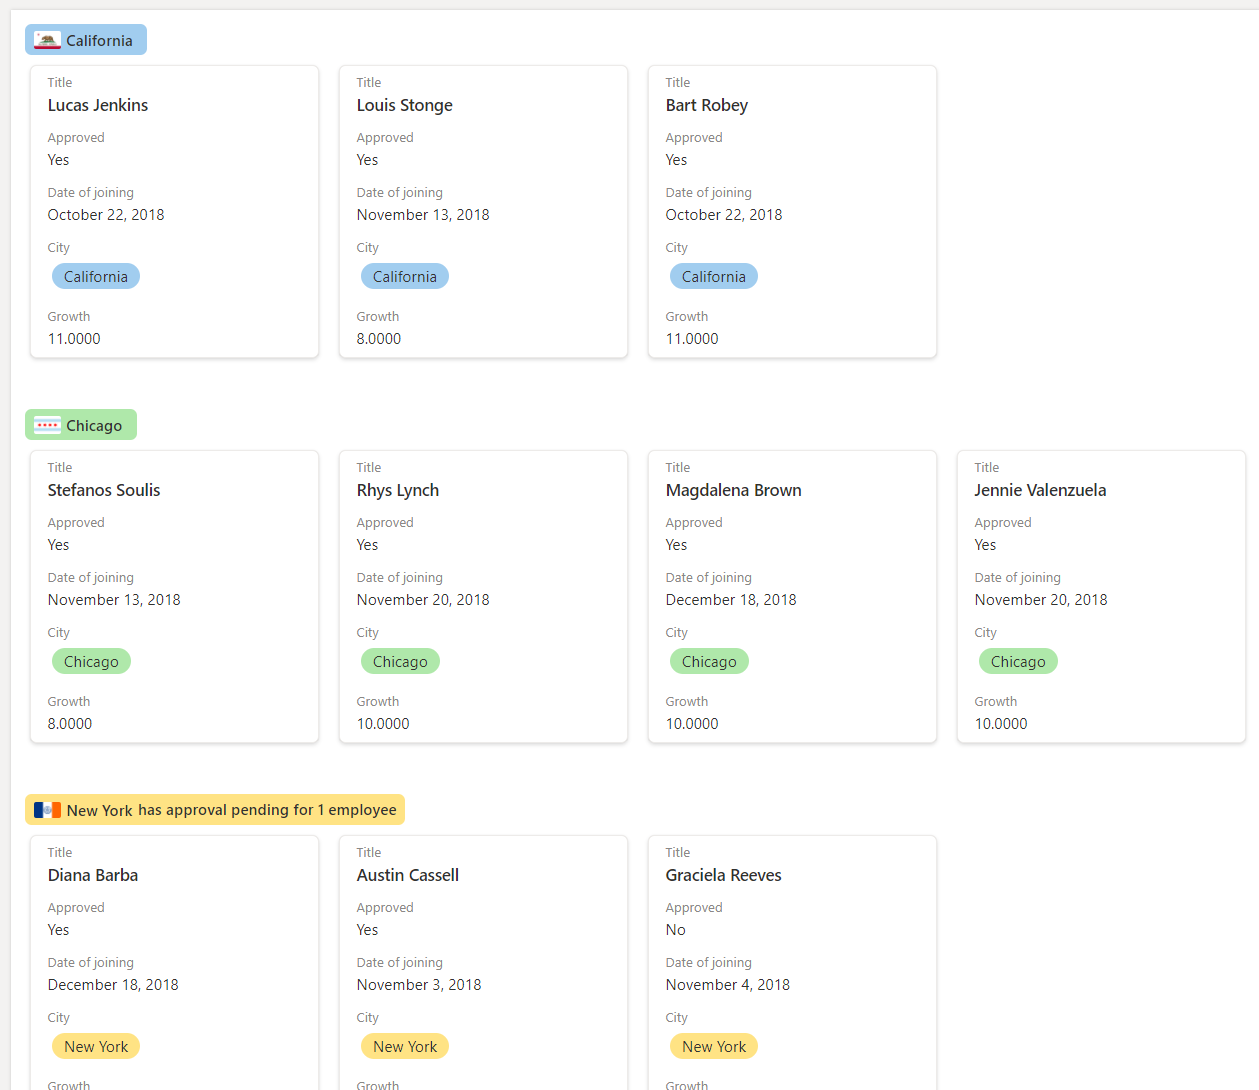
In diesem Beispiel wird der @aggregates-Array verwendet, um eine Zusammenfassung in der Gruppenkopfzeile mittels headerFormatter in groupProps anzuzeigen.
Hinweis
Der Formatierer für die Galeriekarte wird der Einfachheit halber im folgenden JSON übersprungen. Das folgende Beispiel enthält auch Zeilenumbrüche. Diese wurden hinzugefügt, um die Lesbarkeit des Codes zu verbessern.
{
  "$schema": "https://developer.microsoft.com/json-schemas/sp/v2/tile-formatting.schema.json",
  "height": 277,
  "width": 254,
  "hideSelection": false,
  "fillHorizontally": true,
  "groupProps": {
    "headerFormatter": {
      "debugMode": true,
      "elmType": "div",
      "children": [
        {
          "elmType": "div",
          "style": {
            "flex-wrap": "wrap",
            "display": "flex",
            "box-sizing": "border-box",
            "padding": "4px 8px 5px 8px",
            "border-radius": "6px",
            "align-items": "center",
            "white-space": "nowrap",
            "overflow": "hidden",
            "margin": "1px 4px 4px 1px"
          },
          "attributes": {
            "class": "=if(@group.fieldData == 'California', 'sp-css-backgroundColor-blueBackground37',
                       if(@group.fieldData == 'Chicago', 'sp-css-backgroundColor-successBackground50',
                       if(@group.fieldData == 'New York', 'sp-css-backgroundColor-warningBackground50',
                       if(@group.fieldData == 'Seattle', 'sp-css-backgroundColor-blockingBackground50',
                       if(@group.fieldData == 'Washington DC', 'sp-css-backgroundColor-errorBackground50', 'sp-field-borderAllRegular sp-field-borderAllSolid sp-css-borderColor-neutralSecondary')))))"
          },
          "children": [
            {
              "elmType": "img",
              "attributes": {
                "src": "=if(@group.fieldData == 'California', 'https://upload.wikimedia.org/wikipedia/commons/thumb/0/01/Flag_of_California.svg/1920px-Flag_of_California.svg.png',
                         if(@group.fieldData == 'Chicago', 'https://upload.wikimedia.org/wikipedia/commons/thumb/9/9b/Flag_of_Chicago%2C_Illinois.svg/1920px-Flag_of_Chicago%2C_Illinois.svg.png',
                         if(@group.fieldData == 'New York', 'https://upload.wikimedia.org/wikipedia/commons/thumb/b/ba/Flag_of_New_York_City.svg/2560px-Flag_of_New_York_City.svg.png',
                         if(@group.fieldData == 'Seattle', 'https://upload.wikimedia.org/wikipedia/en/thumb/6/6d/Flag_of_Seattle.svg/1920px-Flag_of_Seattle.svg.png',
                         if(@group.fieldData == 'Washington DC', 'https://upload.wikimedia.org/wikipedia/commons/thumb/d/d4/Flag_of_the_District_of_Columbia.svg/2560px-Flag_of_the_District_of_Columbia.svg.png', '')))))"
              },
              "style": {
                "max-width": "24px",
                "max-height": "24px",
                "margin-top": "2px",
                "border-radius": "2px"
              }
            },
            {
              "elmType": "div",
              "children": [
                {
                  "elmType": "span",
                  "style": {
                    "padding": "5px 5px 5px 5px",
                    "font-weight": "500"
                  },
                  "txtContent": "@group.fieldData.displayValue"
                }
              ]
            },
            {
              "elmType": "div",
              "forEach": "aggregate in @aggregates",
              "children": [
                {
                  "elmType": "div",
                  "style": {
                    "display": "=if([$aggregate.columnDisplayName] == 'Approved' && Number([$aggregate.value]) < @group.count, 'flex', 'none')",
                    "flex-direction": "row",
                    "justify-content": "center"
                  },
                  "children": [
                    {
                      "elmType": "div",
                      "txtContent": "='has approval pending for ' + Number(@group.count - Number([$aggregate.value])) + if(@group.count - Number([$aggregate.value]) > 1 , ' employees', ' employee')",
                      "style": {
                        "font-weight": "500"
                      }
                    }
                  ]
                }
              ]
            }
          ]
        }
      ]
    }
  }
}
Detaillierte Syntaxreferenz
HideSelection
Optionales Element. Gibt an, ob die Möglichkeit zum Auswählen von Karten in der Ansicht deaktiviert ist oder nicht.
false ist das Standardverhalten in einer Profilfotoansicht (d. h. die Auswahl ist sichtbar und aktiviert).
true bedeutet, dass Benutzer keine Listenelemente auswählen können.
fillHorizontally
Optionales Element. Gibt an, ob die Karten in der Zeile horizontal gestreckt werden sollen, um die Zeile auszufüllen.
false ist das Standardverhalten (d. h. Karten in einer Zeile werden ohne Größenänderung gestapelt, bis sie überlaufen).
true bedeutet, dass Karten in der Zeile nur horizontal gestreckt werden, wenn dies zum Ausfüllen der Zeile erforderlich ist.
height
Optionales Element. Definiert die Höhe der Karte in Pixel.
width
Optionales Element. Definiert die Breite der Karte in Pixel. Reicht von halber Höhe bis zu dreifacher Höhe.
formatter
JSON-Objekt, mit dem das Layout von Karten definiert wird. Das Schema dieses JSON-Objekts ist identisch mit dem Schema eines Spaltenformats (und dem von "rowFormatter"). Ausführliche Informationen zu diesem Schema und seinen Funktionen finden Sie in der Referenz zur Formatierungssyntax.
groupProps
Gruppiert die gruppenbezogenen Anpassungsoptionen. Ausführliche Informationen zu groupProps finden Sie in der Syntaxreferenz zur Gruppenanpassung.
commandBarProps
Gruppiert die Anpassungsoptionen der Befehlsleiste. Ausführliche Informationen zu commandBarProps finden Sie unter Syntaxreferenz zur Anpassung der Befehlsleiste