Note
Access to this page requires authorization. You can try signing in or changing directories.
Access to this page requires authorization. You can try changing directories.
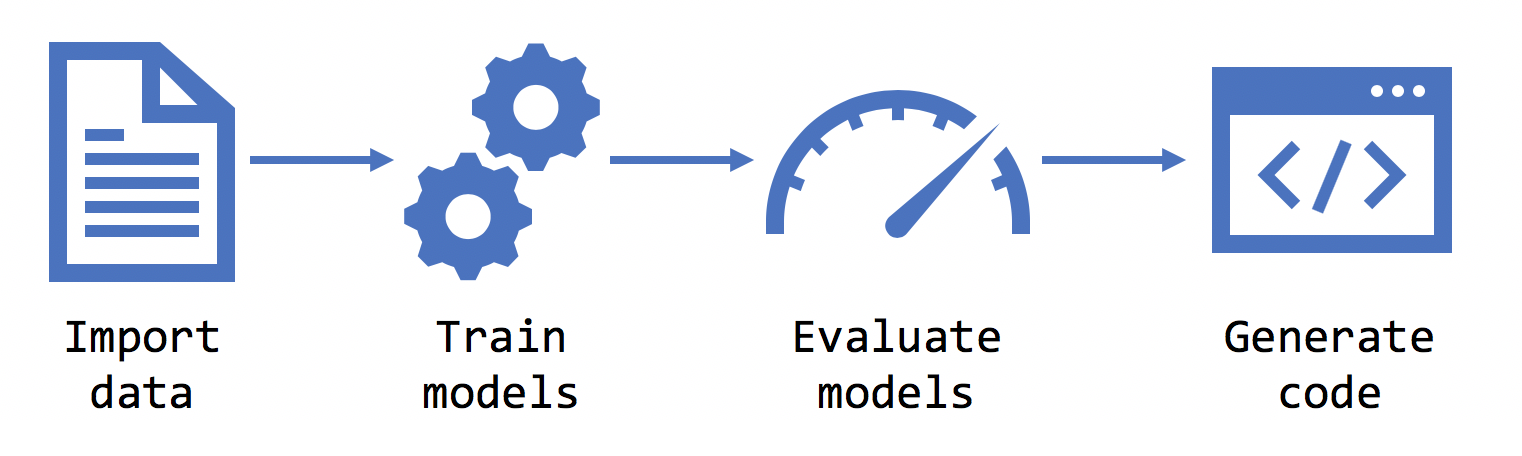
ML.NET Model Builder is an intuitive graphical Visual Studio extension to build, train, and deploy custom machine learning models. It uses automated machine learning (AutoML) to explore different machine learning algorithms and settings to help you find the one that best suits your scenario.
You don't need machine learning expertise to use Model Builder. All you need is some data, and a problem to solve. Model Builder generates the code to add the model to your .NET application.

Create a Model Builder project
When you first start up Model Builder, it asks you to name the project, and then creates an mbconfig configuration file inside of the project. The mbconfig file keeps track of everything you do in Model Builder to allow you to reopen the session.
After training, three files are generated under the *.mbconfig file:
- Model.consumption.cs: This file contains the
ModelInputandModelOutputschemas as well as thePredictfunction generated for consuming the model. - Model.training.cs: This file contains the training pipeline (data transforms, algorithm, algorithm hyperparameters) chosen by Model Builder to train the model. You can use this pipeline for re-training your model.
- Model.zip: This is a serialized zip file which represents your trained ML.NET model.
When you create your mbconfig file, you're prompted for a name. This name is applied to the consumption, training, and model files. In this case, the name used is Model.
Scenario
You can bring many different scenarios to Model Builder, to generate a machine learning model for your application.
A scenario is a description of the type of prediction you want to make using your data. For example:
- Predict future product sales volume based on historical sales data.
- Classify sentiments as positive or negative based on customer reviews.
- Detect whether a banking transaction is fraudulent.
- Route customer feedback issues to the correct team in your company.
Each scenario maps to a different machine learning task, which include:
| Task | Scenario |
|---|---|
| Binary classification | Data classification |
| Multiclass classification | Data classification |
| Image classification | Image classification |
| Text classification | Text classification |
| Regression | Value prediction |
| Recommendation | Recommendation |
| Forecasting | Forecasting |
For example, the scenario of classifying sentiments as positive or negative would fall under the binary classification task.
For more information about the different ML Tasks supported by ML.NET see Machine learning tasks in ML.NET.
Which machine learning scenario is right for me?
In Model Builder, you need to select a scenario. The type of scenario depends on what type of prediction you're trying to make.
Tabular
Data classification
Classification is used to categorize data into categories.
Sample Input
Sample Output
| SepalLength | SepalWidth | Petal Length | Petal Width | Species |
|---|---|---|---|---|
| 5.1 | 3.5 | 1.4 | 0.2 | setosa |
| Predicted species |
|---|
| setosa |
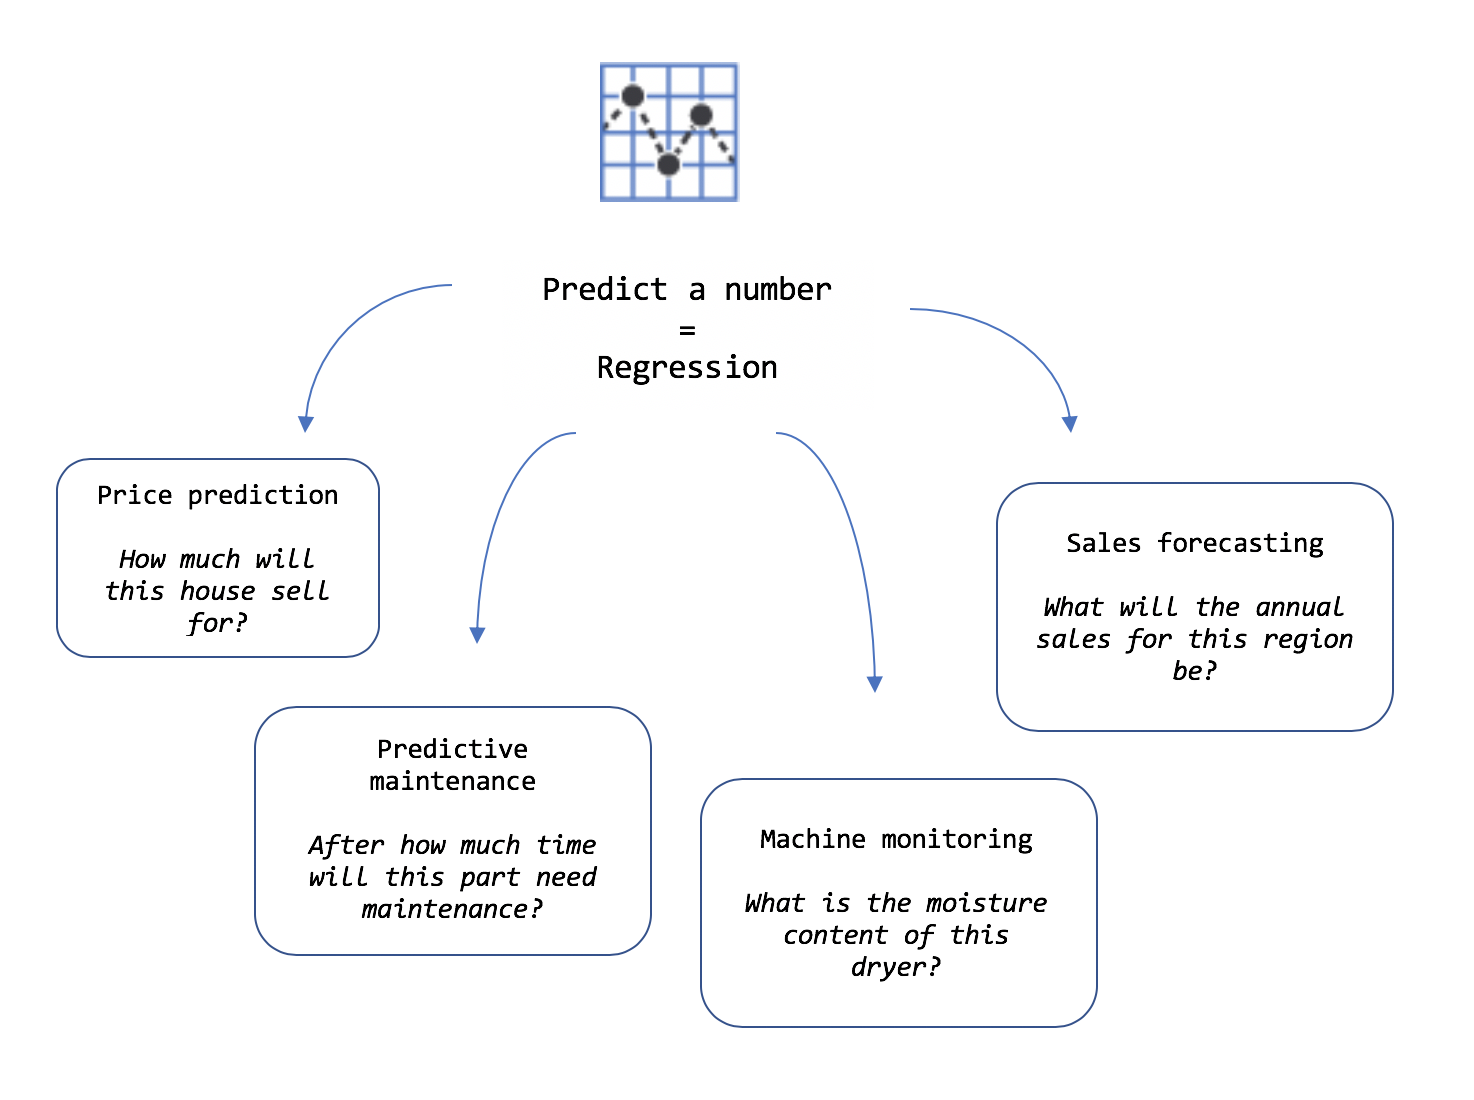
Value prediction
Value prediction, which falls under the regression task, is used to predict numbers.
Sample Input
Sample Output
| vendor_id | rate_code | passenger_count | trip_time_in_secs | trip_distance | payment_type | fare_amount |
|---|---|---|---|---|---|---|
| CMT | 1 | 1 | 1271 | 3.8 | CRD | 17.5 |
| Predicted Fare |
|---|
| 4.5 |
Recommendation
The recommendation scenario predicts a list of suggested items for a particular user, based on how similar their likes and dislikes are to other users'.
You can use the recommendation scenario when you have a set of users and a set of "products", such as items to purchase, movies, books, or TV shows, along with a set of users' "ratings" of those products.
Sample Input
Sample Output
| UserId | ProductId | Rating |
|---|---|---|
| 1 | 2 | 4.2 |
| Predicted rating |
|---|
| 4.5 |
Forecasting
The forecasting scenario uses historical data with a time-series or seasonal component to it.
You can use the forecasting scenario to forecast demand or sale for a product.
Sample Input
Sample Output
| Date | SaleQty |
|---|---|
| 1/1/1970 | 1000 |
| 3 Day Forecast |
|---|
| [1000,1001,1002] |
Computer vision
Image classification
Image classification is used to identify images of different categories. For example, different types of terrain or animals or manufacturing defects.
You can use the image classification scenario if you have a set of images, and you want to classify the images into different categories.
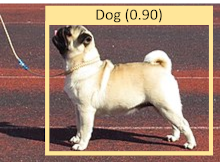
Sample Input
Sample Output
| Predicted Label |
|---|
| Dog |
Object detection
Object detection is used to locate and categorize entities within images. For example, locating and identifying cars and people in an image.
You can use object detection when images contain multiple objects of different types.
Sample Input
Sample Output
Natural language processing
Text classification
Text classification categorizes raw text input.
You can use the text classification scenario if you have a set of documents or comments, and you want to classify them into different categories.
Example Input
Example Output
| Review |
|---|
| I really like this steak! |
| Sentiment |
|---|
| Positive |
Environment
You can train your machine learning model locally on your machine or in the cloud on Azure, depending on the scenario.
When you train locally, you work within the constraints of your computer resources (CPU, memory, and disk). When you train in the cloud, you can scale up your resources to meet the demands of your scenario, especially for large datasets.
| Scenario | Local CPU | Local GPU | Azure |
|---|---|---|---|
| Data classification | ✔️ | ❌ | ❌ |
| Value prediction | ✔️ | ❌ | ❌ |
| Recommendation | ✔️ | ❌ | ❌ |
| Forecasting | ✔️ | ❌ | ❌ |
| Image classification | ✔️ | ✔️ | ✔️ |
| Object detection | ❌ | ❌ | ✔️ |
| Text classification | ✔️ | ✔️ | ❌ |
Data
Once you've chosen your scenario, Model Builder asks you to provide a dataset. The data is used to train, evaluate, and choose the best model for your scenario.
Model Builder supports datasets in .tsv, .csv, .txt, and SQL database formats. If you have a .txt file, columns should be separated with ,, ;, or \t.
If the dataset is made up of images, the supported file types are .jpg and .png.
For more information, see Load training data into Model Builder.
Choose the output to predict (label)
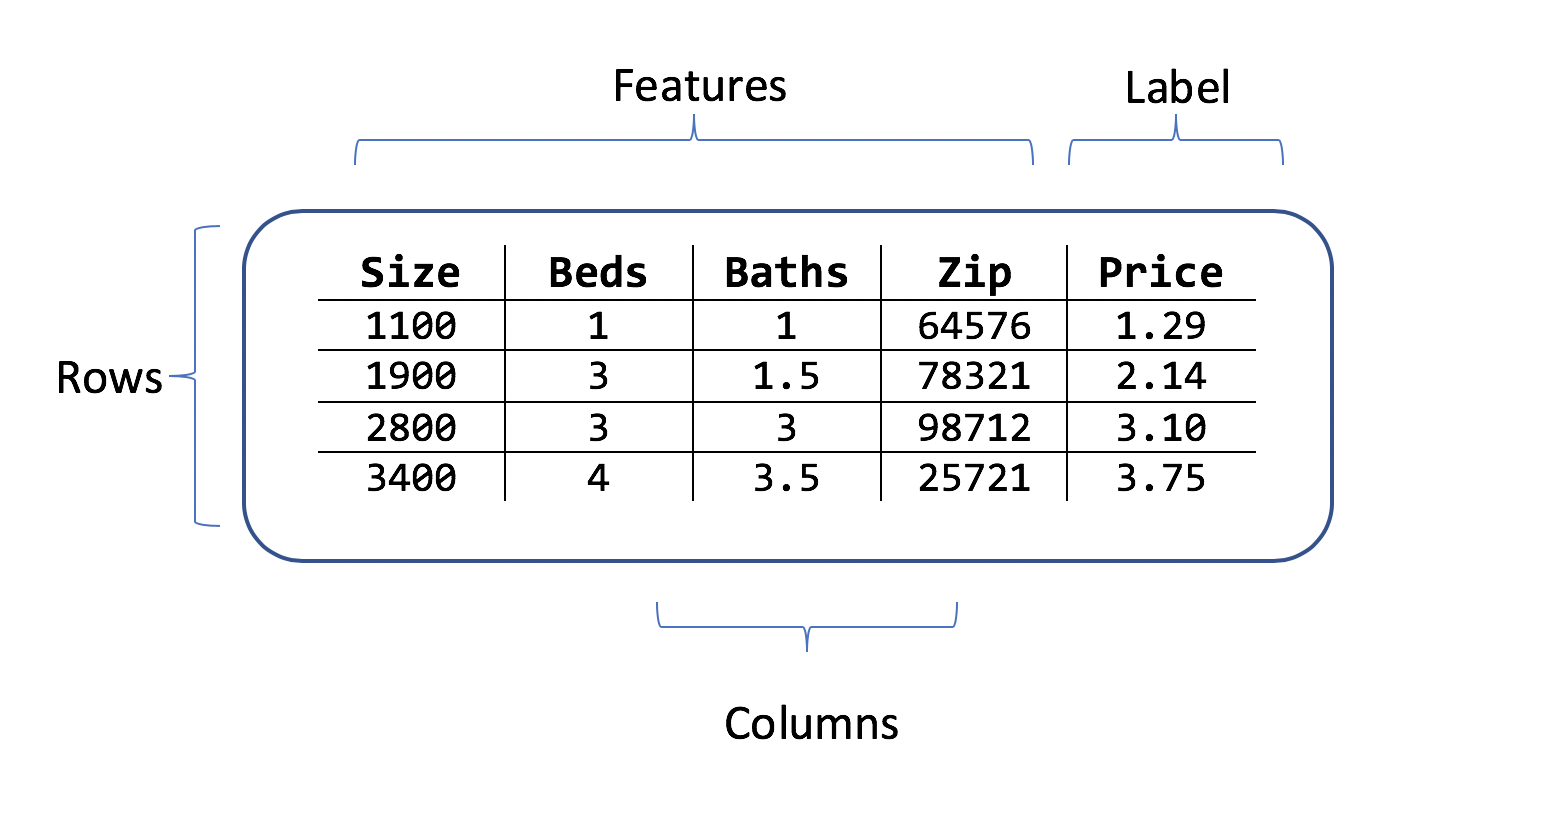
A dataset is a table of rows of training examples, and columns of attributes. Each row has:
- a label (the attribute that you want to predict)
- features (attributes that are used as inputs to predict the label)
For the house-price prediction scenario, the features could be:
- The square footage of the house.
- The number of bedrooms and bathrooms.
- The zip code.
The label is the historical house price for that row of square footage, bedroom, and bathroom values and zip code.
Example datasets
If you don't have your own data yet, try out one of these datasets:
| Scenario | Example | Data | Label | Features |
|---|---|---|---|---|
| Classification | Predict sales anomalies | product sales data | Product Sales | Month |
| Predict sentiment of website comments | website comment data | Label (1 when negative sentiment, 0 when positive) | Comment, Year | |
| Predict fraudulent credit card transactions | credit card data | Class (1 when fraudulent, 0 otherwise) | Amount, V1-V28 (anonymized features) | |
| Predict the type of issue in a GitHub repository | GitHub issue data | Area | Title, Description | |
| Value prediction | Predict taxi fare price | taxi fare data | Fare | Trip time, distance |
| Image classification | Predict the category of a flower | flower images | The type of flower: daisy, dandelion, roses, sunflowers, tulips | The image data itself |
| Recommendation | Predict movies that someone will like | movie ratings | Users, Movies | Ratings |
Train
Once you select your scenario, environment, data, and label, Model Builder trains the model.
What is training?
Training is an automatic process by which Model Builder teaches your model how to answer questions for your scenario. Once trained, your model can make predictions with input data that it has not seen before. For example, if you are predicting house prices and a new house comes on the market, you can predict its sale price.
Because Model Builder uses automated machine learning (AutoML), it does not require any input or tuning from you during training.
How long should I train for?
Model Builder uses AutoML to explore multiple models to find you the best performing model.
Longer training periods allow AutoML to explore more models with a wider range of settings.
The table below summarizes the average time taken to get good performance for a suite of example datasets, on a local machine.
| Dataset size | Average time to train |
|---|---|
| 0 - 10 MB | 10 sec |
| 10 - 100 MB | 10 min |
| 100 - 500 MB | 30 min |
| 500 - 1 GB | 60 min |
| 1 GB+ | 3+ hours |
These numbers are a guide only. The exact length of training is dependent on:
- The number of features (columns) being used to as input to the model.
- The type of columns.
- The ML task.
- The CPU, disk, and memory performance of the machine used for training.
It's generally advised that you use more than 100 rows as datasets with less than that may not produce any results.
Evaluate
Evaluation is the process of measuring how good your model is. Model Builder uses the trained model to make predictions with new test data, and then measures how good the predictions are.
Model Builder splits the training data into a training set and a test set. The training data (80%) is used to train your model and the test data (20%) is held back to evaluate your model.
How do I understand my model performance?
A scenario maps to a machine learning task. Each ML task has its own set of evaluation metrics.
Value prediction
The default metric for value prediction problems is RSquared, the value of RSquared ranges between 0 and 1. 1 is the best possible value or in other words the closer the value of RSquared to 1 the better your model is performing.
Other metrics reported such as absolute-loss, squared-loss, and RMS loss are additional metrics, which can be used to understand how your model is performing and comparing it against other value prediction models.
Classification (2 categories)
The default metric for classification problems is accuracy. Accuracy defines the proportion of correct predictions your model is making over the test dataset. The closer to 100% or 1.0 the better it is.
Other metrics reported such as AUC (Area under the curve), which measures the true positive rate vs. the false positive rate should be greater than 0.50 for models to be acceptable.
Additional metrics like F1 score can be used to control the balance between Precision and Recall.
Classification (3+ categories)
The default metric for Multi-class classification is Micro Accuracy. The closer the Micro Accuracy to 100% or 1.0 the better it is.
Another important metric for Multi-class classification is Macro-accuracy, similar to Micro-accuracy the closer to 1.0 the better it is. A good way to think about these two types of accuracy is:
- Micro-accuracy: How often does an incoming ticket get classified to the right team?
- Macro-accuracy: For an average team, how often is an incoming ticket correct for their team?
More information on evaluation metrics
For more information, see model evaluation metrics.
Improve
If your model performance score is not as good as you want it to be, you can:
Train for a longer period of time. With more time, the automated machine learning engine experiments with more algorithms and settings.
Add more data. Sometimes the amount of data is not sufficient to train a high-quality machine learning model.This is especially true with datasets that have a small number of examples.
Balance your data. For classification tasks, make sure that the training set is balanced across the categories. For example, if you have four classes for 100 training examples, and the two first classes (tag1 and tag2) are used for 90 records, but the other two (tag3 and tag4) are only used on the remaining 10 records, the lack of balanced data may cause your model to struggle to correctly predict tag3 or tag4.
Consume
After the evaluation phase, Model Builder outputs a model file, and code that you can use to add the model to your application. ML.NET models are saved as a zip file. The code to load and use your model is added as a new project in your solution. Model Builder also adds a sample console app that you can run to see your model in action.
In addition, Model Builder gives you the option to create projects that consume your model. Currently, Model Builder will create the following projects:
- Console app: Creates a .NET console application to make predictions from your model.
- Web API: Creates an ASP.NET Core Web API that lets you consume your model over the internet.
What's next?
Install the Model Builder Visual Studio extension.
Collaborate with us on GitHub
The source for this content can be found on GitHub, where you can also create and review issues and pull requests. For more information, see our contributor guide.