Intelligent Order Management Insights reporting
Microsoft Dynamics 365 Intelligent Order Management provides comprehensive, out-of-box reports that are known as Insights. Insights cover a broad range of key performance indicators (KPIs) that are critical for your business.
You can use Insights to find various metrics, such as products by order line, orders that are in jeopardy, returns by return reason, on-time shipped ratio, and fill rate.
Intelligent Order Management Insights are powered by embedded Power BI.
Navigating reports
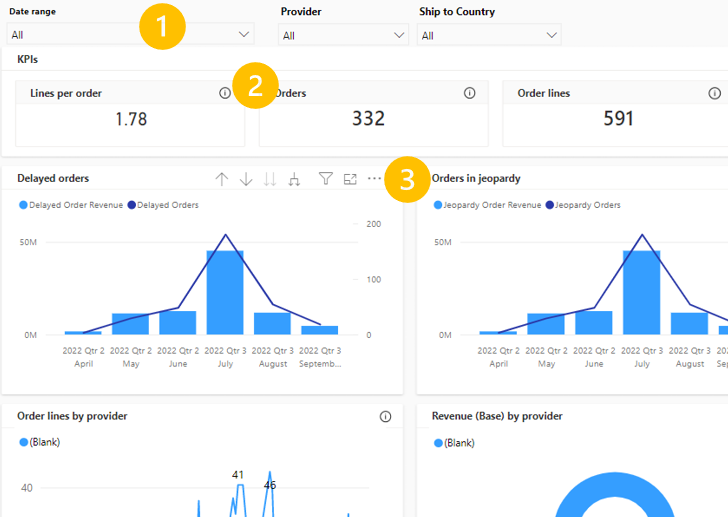
Every Insights dashboard includes filters, help text, and settings. (The numbered paragraphs correspond to the numbered callouts in the illustration.)
Filters – Each dashboard includes a date filter and data filters that are relevant to the page. For example, the Orders Insights page has filters for Providers and Ship to country. Each filter updates the visuals on the whole page.
Help text – Each visual on the dashboard has an i button that shows helpful information about the related visual.
Settings – When each visual is selected, a toolbar of additional settings appears. Here are some of these settings:
- Drill up, Drill down, and Next level in hierarchy – Drill up or down on the visual to view the next level up or down in the data. For example, you can drill up from Months to Year.
- Next level in hierarchy and Expand all down one level in the hierarchy – Expand levels down in the hierarchy of data. For example, you can expand from Months to Quarters.
- Filters on visual – Show the current filters that affect the visual.
- Focus mode – Go to an expanded view of the visual.
- Export data – Export the underlying data to a file in comma-separated values (CSV) format. Any filters that affect the visual will be used in the export.
- Show as a table – View the underlying data for the visual in table format.
- Spotlight – Highlight the visual.
- Get insights – View automatically generated Insights for the visual, if they're available.
- Sort axis – Customize axis information for the visual.
Insights metrics
The following table provides the full list of current metrics and descriptions for Insights. The descriptions in the table match the help text descriptions that are available in the product.
The "Category" column indicates the category in the left navigation. The "Page" column indicates the tab on the actual page where the report exists. For example, select Order dashboard in the left navigation, and then select the Return Insights tab to open the page that shows all the return-related metrics.
| Category | Page | Metric | Type | Description |
|---|---|---|---|---|
| Order dashboard | Overview | Lines per order | KPI | Average order lines per order received. |
| Order dashboard | Overview | Orders mtd | KPI | Total orders received for current month to date (Page date filters don't update this KPI). |
| Order dashboard | Overview | Orders mom growth rate | KPI | Growth rate of orders received month over month. |
| Order dashboard | Overview | Revenue (base) mtd | KPI | Total revenue of all orders for current month to date (Page date filters do not update this KPI). |
| Order dashboard | Overview | Revenue (base) mom growth rate | KPI | Growth rate of revenue from orders month over month. |
| Order dashboard | Overview | Orders by provider | Graph | Orders received grouped by order providers connected to Intelligent Order Management. |
| Order dashboard | Overview | Order details by region | Map | Map view of each order destination region's order details, such as revenue or order count. |
| Order dashboard | Overview | Orders by date | Graph | Order count by date on a trendline. |
| Order dashboard | Overview | Orders by status reason | Graph | Order count grouped by order status. |
| Order dashboard | Overview | Top products by order line | Graph | Top products ordered based on order lines. |
| Order dashboard | Order insights | Lines per order | KPI | Average order lines per order received. |
| Order dashboard | Order insights | Orders | KPI | Total orders received. |
| Order dashboard | Order insights | Order lines | KPI | Total order lines received. |
| Order dashboard | Order insights | Orders past due | KPI | Orders that are past the requested delivery date. |
| Order dashboard | Order insights | Revenue (base) | KPI | Total revenue of all orders. |
| Order dashboard | Order insights | D orders | Graph | Sales orders that are delayed from delivery by revenue and order count. |
| Order dashboard | Order insights | Orders in jeopardy | Graph | Sales orders that are in jeopardy as they haven't been sent to fulfillment and are at risk of being delayed by revenue and order count. |
| Order dashboard | Order insights | Order lines by status reason | Graph | Order lines count grouped by order status. |
| Order dashboard | Order insights | Order lines by provider | Graph | Orders lines count grouped by order providers connected to Intelligent Order Management. |
| Order dashboard | Order insights | Revenue (base) by provider | Graph | Revenue of orders received grouped by order providers connected to Intelligent Order Management. |
| Order dashboard | Order insights | Orders by shipping method | Graph | Order count grouped by shipping method. For example, FedEx or UPS. |
| Order dashboard | Order insights | Order lines by provider | Graph | Order lines count grouped by order providers connected to Intelligent Order Management. |
| Order dashboard | Order insights | Lines per order by provider | Graph | Average orders lines per order, grouped by provider. |
| Order dashboard | Returns insights | Products returned | KPI | Total count of returned products. |
| Order dashboard | Returns insights | Return orders | KPI | Total count of returned orders. |
| Order dashboard | Returns insights | Return order lines | KPI | Total count of returned order lines. |
| Order dashboard | Returns insights | Revenue loss (base) | KPI | Total revenue lost from returns. |
| Order dashboard | Returns insights | Return rate (revenue) | KPI | Return rate by revenue of returns against revenue of sales orders. |
| Order dashboard | Returns insights | Return rate (orders) | KPI | Return rate by order line count of returns against order line count of sales orders. |
| Order dashboard | Returns insights | Returns by customer | Graph | Returns count grouped by highest volume order customers. |
| Order dashboard | Returns insights | Returns by delivery carrier | Graph | Returns count grouped by delivery carriers such as FedEx or UPS. |
| Order dashboard | Returns insights | Top five returned products | Graph | Top five products by quantity returned. |
| Order dashboard | Returns insights | Returns by return reason | Graph | Returns count grouped by return reason. |
| Order dashboard | Returns insights | Returns by order status | Graph | Returns count grouped by order status. |
| Order dashboard | Returns insights | Returns by fulfillment status | Graph | Returns count grouped by fulfillment status. |
| Order dashboard | Returns insights | Returns by warehouse | Graph | Returns count grouped by warehouse. |
| Order dashboard | Returns insights | Returns by country | Graph | Returns count grouped by country on a map view. |
| Order dashboard | Fulfillment insights | Fulfillment lines | KPI | Total fulfillment lines created. |
| Order dashboard | Fulfillment insights | Internal cycle time (hours) | KPI | The average time it takes to ship an order. |
| Order dashboard | Fulfillment insights | Internal cycle time (sla) | KPI | SLA percentage representing orders that have shipped by an internal cycle time goal. |
| Order dashboard | Fulfillment insights | Fulfillment lines shipped | KPI | Total fulfillment lines that have been shipped. |
| Order dashboard | Fulfillment insights | Shipped quantity | KPI | Total orders that have been shipped. |
| Order dashboard | Fulfillment insights | On-time shipped ratio | Graph | On time shipped percentage shows the percentage of orders delivered on time. Orders without a requested ship date are excluded from this metric. |
| Order dashboard | Fulfillment insights | Book to ship ratio | Graph | Book to ship ratio shows the value ratio of orders booked vs shipped. |
| Order dashboard | Fulfillment insights | Fill rate | Graph | Fill rate shows the percentage of orders that have been fulfilled successfully. |
| Order dashboard | Fulfillment insights | Fulfillments by source type | Graph | Fulfillment orders grouped by source type such as Warehouse. |
| Order dashboard | Fulfillment insights | Fulfillments by region | Map | Map view of fulfillment order details grouped by region of order destination. |
| Order dashboard | Fulfillment insights | Fulfillment lines shipped | Graph | Count of fulfillment lines shipped on a trendline. |
| Order dashboard | Fulfillment insights | Internal cycle time (hours) | Graph | The average time it takes to ship an order by date on a trendline. |
| Order dashboard | Fulfillment insights | Internal cycle time (sla) | Graph | SLA percentage representing orders that have shipped by an internal cycle time goal by date on a trendline. |
| Licenses | Overview | Total order lines | KPI | Total order lines received. |
| Licenses | Overview | Orders lines MTD | KPI | Total order lines month to date. Page date filters don't update this KPI. |
| Licenses | Overview | Orders lines mom growth rate | KPI | Growth rate of orders lines received month over month. |
| Licenses | Overview | Order lines by date | Graph | Order lines by date on a trendline. |
| Licenses | Overview | Total order lines by date with 6 month proj | Graph | Count of total order lines by date on a trendline, with a six month projection into the future based on historical data. |
| Product insights | Overview | Orders | KPI | Total orders received. |
| Product insights | Overview | Order lines | KPI | Total order lines received. |
| Product insights | Overview | Lines per order | KPI | Average order lines per order received. |
| Product insights | Overview | Ordered quantity | KPI | Total quantity of products ordered from sales orders. |
| Product insights | Overview | Ordered quantity per order | KPI | Average quantity of products ordered from sales orders. |
| Product insights | Overview | Active products | KPI | Current active products in your inventory. |
| Product insights | Overview | Top products by order lines | Graph | Top products ordered grouped by order lines. |
| Product insights | Overview | Top products by ordered quantity | Graph | Top products ordered grouped by ordered quantity. |
| Product insights | Overview | Top products by revenue (base) | Graph | Top products ordered grouped by revenue. |
| Product insights | Overview | Top products by order lines over time | Graph | Top products ordered grouped by order lines on a trendline. |
| Product insights | Overview | Key influencers/top segments | ? | Key influencers and top segments responsible for product sales. |
| Monitoring | Order anomalies | Order quantities | Graph | Quantity of ordered products on a trendline with any anomalies. Anomalies are defined as any value that is below 70% of the expected range of that value based on historical data. |
| Monitoring | Order anomalies | Revenue | Graph | Revenue from orders on a trendline with any anomalies. Anomalies are defined as any value that is below 70% of the expected range of that value based on historical data. |
| Monitoring | Order anomalies | Top product revenues | Graph | Top products by quantity ordered on a trendline with any anomalies. Anomalies are defined as any value that is below 70% of the expected range of that value based on historical data. |
| Monitoring | Order anomalies | Order delays | Graph | Delayed orders on a trendline with any anomalies. Anomalies are defined as any value that is below 70% of the expected range of that value based on historical data. |
| Monitoring | Order anomalies | Quarterly revenue | Graph | Revenue of orders by quarter on a trendline with any anomalies. Anomalies are defined as any value that is below 70% of the expected range of that value based on historical data. |
| Monitoring | Order anomalies | Orders | Table | Total orders on a trendline with any anomalies. Anomalies are defined as any value that is below 70% of the expected range of that value based on historical data. |
| Provider insights | Overview | Total requests | KPI | Total message and action events associated with providers connected to Intelligent Order Management. For example, big Commerce orders and order updates, FedEx shipping, and delivery notifications. |
| Provider insights | Overview | MTD total request growth rate | KPI | Growth rate month to date of requests associated with providers connected to Intelligent Order Management. Page date filters don't update this KPI. |
| Provider insights | Overview | SLA total requests | KPI | Percentage of requests that met the SLA for a given provider connected to Intelligent Order Management, where the SLA is defined as the length of allowable time for an event to process. |
| Provider insights | Overview | Total requests failed | KPI | Total requests from providers that have failed. |
| Provider insights | Overview | Total requests above threshold | KPI | Total requests that exceeded the allowable time for an event to process for a given provider. |
| Provider insights | Overview | Total requests by provider | Graph | Total requests grouped by providers connected to Intelligent Order Management. |
| Provider insights | Overview | Total requests and message type by provider | Table | Total requests grouped by provider and type/ This includes inbound vs outbound. |
| Provider insights | Overview | Total requests by date | Graph | Total requests by date on a trendline. |
| Provider insights | Overview | Total requests failed by date | Graph | Total failed requests by date on a trendline. |
| Provider insights | Overview | Total requests above threshold by date | Graph | Total requests that exceeded the allowable time for an event to process for a given provider by date on a trendline. |
| Provider insights | Inbound requests | Inbound requests | KPI | Total requests coming FROM providers connected to Intelligent Order Management. For example, an order from Big Commerce or a shipping notification from FedEx. |
| Provider insights | Inbound requests | MTD inbound request growth rate | KPI | Growth rate month to date of requests coming FROM providers connected to Intelligent Order Management. Page date filters don't update this KPI. |
| Provider insights | Inbound requests | SLA inbound requests | KPI | Percentage of inbound requests that met the SLA for a given provider connected to Intelligent Order Management, where the SLA is defined as the length of allowable time for an event to process. |
| Provider insights | Inbound requests | Inbound requests failed | KPI | Total requests coming FROM providers that have failed. |
| Provider insights | Inbound requests | Inbound requests above threshold | KPI | Total inbound requests that exceeded the allowable time for an event to process for a given provider. |
| Provider insights | Inbound requests | inbound requests by provider | Graph | Total requests coming FROM providers, grouped by providers. |
| Provider insights | Inbound requests | Inbound requests and message type by provider | Table | Total requests coming FROM providers, grouped by providers and inbound type. |
| Provider insights | Inbound requests | Inbound requests by date by provider | Graph | Total requests coming FROM providers by date on a trendline. |
| Provider insights | Inbound requests | Inbound requests failed by date by provider | Graph | Total requests coming FROM providers that have failed by date on a trendline. |
| Provider insights | Inbound requests | Inbound request anomalies on execution time | Graph | Providers with inbound requests that exceeded the allowable time for an event to process. |
| Provider insights | Outbound requests | Outbound requests | KPI | Total requests sent TO providers connected to Intelligent Order Management. |
| Provider insights | Outbound requests | MTD outbound requests growth rate | KPI | Growth rate month to date of requests sent TO providers connected to Intelligent Order Management. The Page date filters don't update this KPI. |
| Provider insights | Outbound requests | SLA outbound requests | KPI | Percentage of outbound requests that met the SLA for a given provider connected to Intelligent Order Management, where the SLA is defined as the length of allowable time for an event to process. |
| Provider insights | Outbound requests | Outbound requests failed | KPI | Total requests sent TO providers that have failed. |
| Provider insights | Outbound requests | Outbound requests above threshold | KPI | Total outbound requests that exceeded the allowable time for an event to process for a given provider. |
| Provider insights | Outbound requests | Outbound requests by provider | Graph | Total requests sent TO providers grouped by provider. |
| Provider insights | Outbound requests | Outbound requests and message type by provider | Table | Total requests sent TO providers grouped by provider and outbound type. |
| Provider insights | Outbound requests | Outbound requests by date by provider | Graph | Total requests sent TO providers by date on a trendline. |
| Provider insights | Outbound requests | Outbound requests failed by date by provider | Graph | Total requests sent TO providers that have failed by date on a trendline. |
| Provider insights | Outbound requests | Outbound requests anomalies on execution time | Graph | Providers with outbound requests that exceeded the allowable time for an event to process. |
Customize dashboards
Only users who have administrator and author access can customize your organization's Insights reports or create new reports. For more information about how to administer roles, see What is Power BI administration and Grant users access.
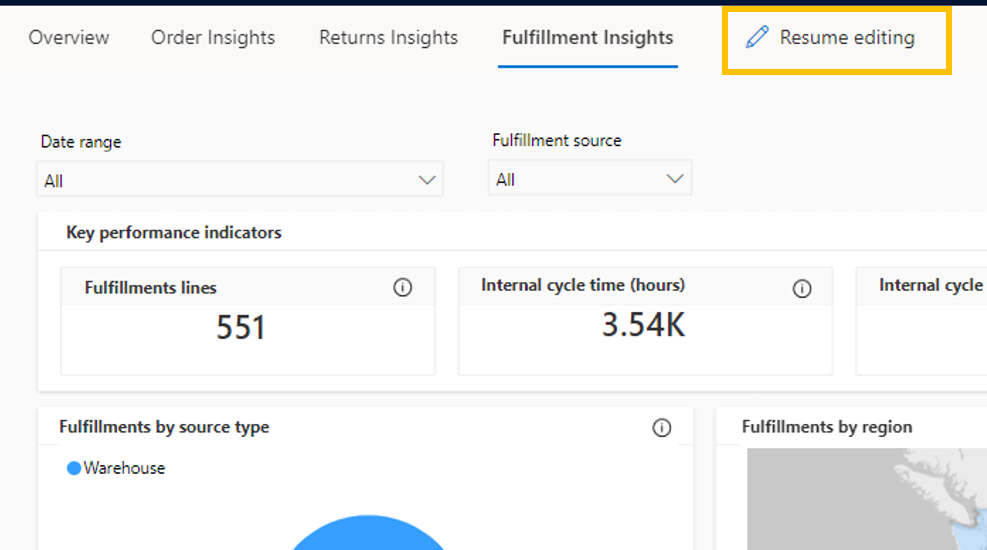
If you have the correct access to customize or create Insights reports, you can select Resume editing on any Insights page to enter edit mode.
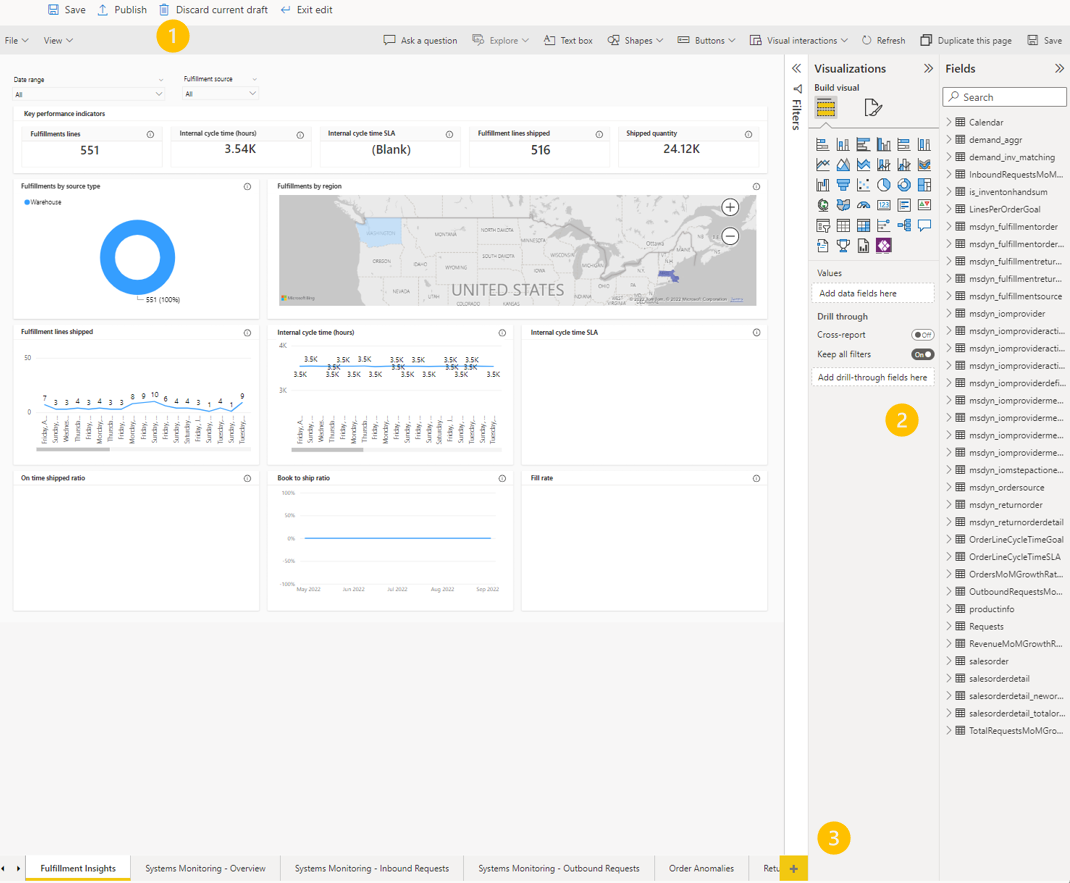
When you enter edit mode, the following controls become available. (The numbered paragraphs correspond to the numbered callouts in the illustration that follows.)
Editing controls – Use the buttons on the top menu bar to save, discard, or publish your current draft. If you select Publish, you'll publish changes for everyone in your organization.
Customization controls – There are three expandable/collapsible panes on the right side of the page:
- Filters – View which filters are currently applied, edit the applied filters, or add more filters.
- Visualizations – Select any visual in the main part of the page, and then select a new visual in this pane to change it. For more information about how to change visuals, see Change the type of visualization in a Power BI report. You can also edit axis information, legends, and more. For detailed instructions, see Customize visualization titles, backgrounds, labels, and legends.
- Fields – View the list of fields that are available for your current schema. If you select a visual in the main part of the page, the fields that are used for it are highlighted in this pane. From this pane, you can add or delete fields, and update the data that powers any visual.
For more information about how to customize Power BI reports, see Customize reports guide.
New page button – Select the plus sign (+) to create a blank page where you can build your own dashboard of visuals. For information about how to add visuals to a page, see Add visuals to a Power BI report.
Feedback
Coming soon: Throughout 2024 we will be phasing out GitHub Issues as the feedback mechanism for content and replacing it with a new feedback system. For more information see: https://aka.ms/ContentUserFeedback.
Submit and view feedback for