Σημείωση
Η πρόσβαση σε αυτή τη σελίδα απαιτεί εξουσιοδότηση. Μπορείτε να δοκιμάσετε να συνδεθείτε ή να αλλάξετε καταλόγους.
Η πρόσβαση σε αυτή τη σελίδα απαιτεί εξουσιοδότηση. Μπορείτε να δοκιμάσετε να αλλάξετε καταλόγους.
Application Gateway logs provide detailed information for events related to a resource and its operations. These logs are available for events such as Access, Activity, Firewall, and Performance (only for V1). The granular information in logs is helpful when troubleshooting a problem or building an analytics dashboard by consuming this raw data.
Logs are available for all resources of Application Gateway; however, to consume them, you must enable their collection in a storage location of your choice. Logging in Azure Application Gateway is enabled by the Azure Monitor service. We recommend using the Log Analytics workspace as you can readily use its predefined queries and set alerts based on specific log conditions.
Types of Resource logs
You can use different types of logs in Azure to manage and troubleshoot application gateways.
- Activity log
- Application Gateway Access Log
- Application Gateway Performance Log (available only for the v1 SKU)
- Application Gateway Firewall Log
Note
Logs are available only for resources deployed in the Azure Resource Manager deployment model. You can't use logs for resources in the classic deployment model. For a better understanding of the two models, see the Understanding Resource Manager deployment and classic deployment article.
Examples of optimizing access logs using Workspace Transformations
Example 1: Selective Projection of Columns: Imagine you have application gateway access logs with 20 columns, but you're interested in analyzing data from only six specific columns. By using workspace transformation, you can project these six columns into your workspace, effectively excluding the other 14 columns. Even though the original data from those excluded columns won't be stored, empty placeholders for them still appear in the Logs blade. This approach optimizes storage and ensures that only relevant data is retained for analysis.
Note
Within the Logs blade, selecting the Try New Log Analytics option gives greater control over the columns displayed in your user interface.
Example 2: Focusing on Specific Status Codes: When analyzing access logs, instead of processing all log entries, you can write a query to retrieve only rows with specific HTTP status codes (such as 4xx and 5xx). Since most requests ideally fall under the 2xx and 3xx categories (representing successful responses), focusing on the problematic status codes narrows down the data set. This targeted approach allows you to extract the most relevant and actionable information, making it both beneficial and cost-effective.
Recommended transition strategy to move from Azure diagnostic to resource specific table:
- Assess current data retention: Determine the duration for which data is presently retained in the Azure diagnostics table (for example: assume the diagnostics table retains data for 15 days).
- Establish resource-specific retention: Implement a new Diagnostic setting with resource specific table.
- Parallel data collection: For a temporary period, collect data concurrently in both the Azure Diagnostics and the resource-specific settings.
- Confirm data accuracy: Verify that data collection is accurate and consistent in both settings.
- Remove Azure diagnostics setting: Remove the Azure Diagnostic setting to prevent duplicate data collection.
Other storage locations:
- Azure Storage account: Storage accounts are best used for logs when logs are stored for a longer duration and reviewed when needed.
- Azure Event Hubs: Event hubs are a great option for integrating with other security information and event management (SIEM) tools to get alerts on your resources.
- Azure Monitor partner integrations.
Learn more about the Azure Monitor's diagnostic settings destinations .
Enable logging through PowerShell
Activity logging is automatically enabled for every Resource Manager resource. You must enable access and performance logging to start collecting the data available through those logs. To enable logging, use the following steps:
Note your storage account's resource ID, where the log data is stored. This value is of the form: /subscriptions/<subscriptionId>/resourceGroups/<resourceGroupName>/providers/Microsoft.Storage/storageAccounts/<storageAccountName>. You can use any storage account in your subscription. You can use the Azure portal to find this information.
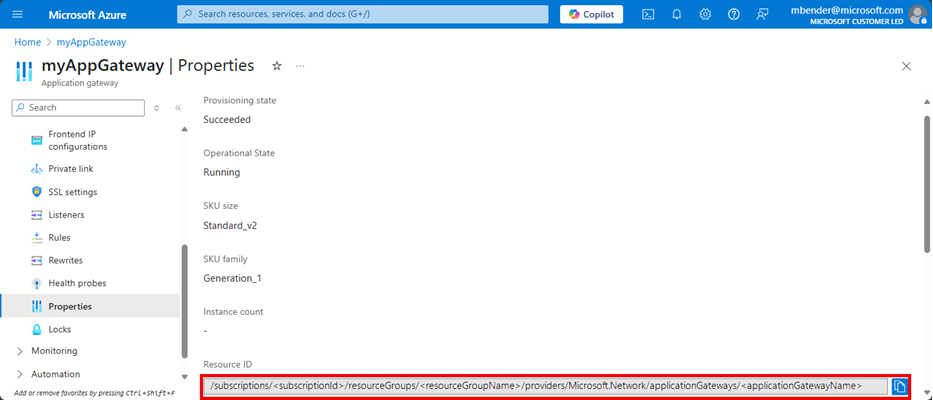
Note your application gateway's resource ID for which logging is enabled. This value is of the form: /subscriptions/<subscriptionId>/resourceGroups/<resourceGroupName>/providers/Microsoft.Network/applicationGateways/<applicationGatewayName>. You can use the portal to find this information.
Enable diagnostic logging by using the following PowerShell cmdlet:
Set-AzDiagnosticSetting -ResourceId /subscriptions/<subscriptionId>/resourceGroups/<resourceGroupName>/providers/Microsoft.Network/applicationGateways/<applicationGatewayName> -StorageAccountId /subscriptions/<subscriptionId>/resourceGroups/<resourceGroupName>/providers/Microsoft.Storage/storageAccounts/<storageAccountName> -Enabled $true
Tip
Activity logs don't require a separate storage account. The use of storage for access and performance logging incurs service charges.
Enable logging through the Azure portal
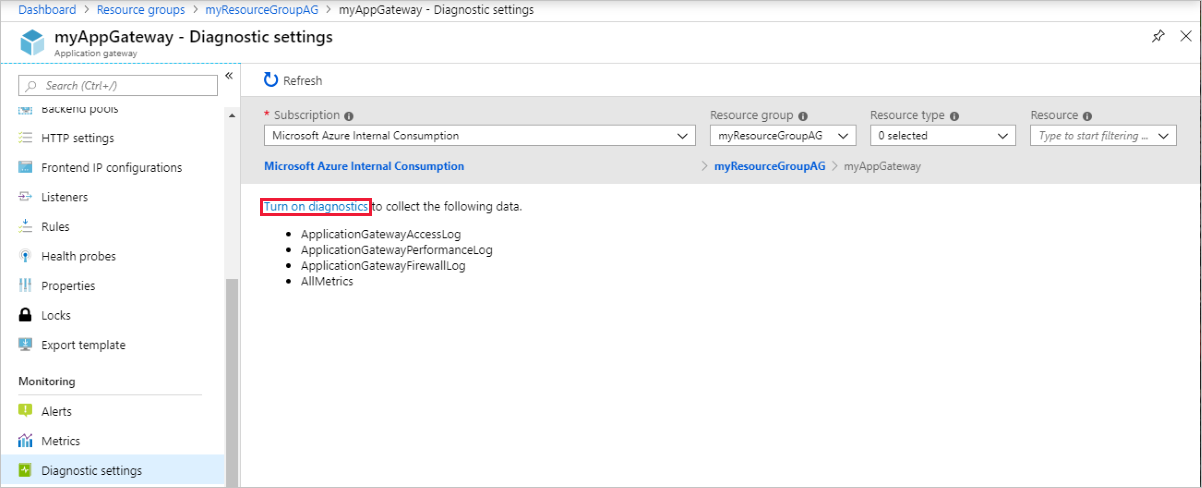
In the Azure portal, find your resource and select Diagnostic settings.
For Application Gateway, three logs are available:
- Access log
- Performance log (available only for the v1 SKU)
- Firewall log
To start collecting data, select Turn on diagnostics.

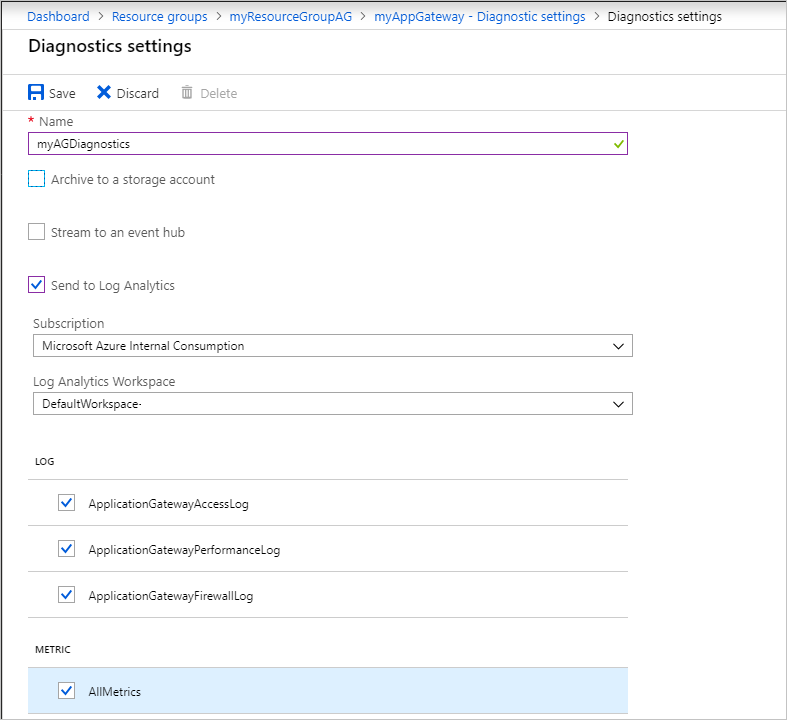
The Diagnostics settings page provides the settings for the diagnostic logs. In this example, Log Analytics stores the logs. You can also use event hubs and a storage account to save the diagnostic logs.

Type a name for the settings, confirm the settings, and select Save.
To view and analyze activity log data, see Analyze monitoring data.
View and analyze the access, performance, and firewall logs
Azure Monitor logs can collect the counter and event log files from your Blob storage account. For more information, see Analyze monitoring data.
You can also connect to your storage account and retrieve the JSON log entries for access and performance logs. After you download the JSON files, you can convert them to CSV and view them in Excel, Power BI, or any other data-visualization tool.
Tip
If you're familiar with Visual Studio and basic concepts of changing values for constants and variables in C#, you can use the log converter tools available from GitHub.
Next steps
- Visualize counter and event logs by using Azure Monitor logs.
- Visualize your Azure activity log with Power BI blog post.
- View and analyze Azure activity logs in Power BI and more blog post.

