Tutorial: Create a log search alert for an Azure resource
Azure Monitor alerts proactively notify you when important conditions are found in your monitoring data. Log search alert rules create an alert when a log query returns a particular result. For example, receive an alert when a particular event is created on a virtual machine, or send a warning when excessive anonymous requests are made to a storage account.
In this tutorial, you learn how to:
- Access prebuilt log queries designed to support alert rules for different kinds of resources
- Create a log search alert rule
- Create an action group to define notification details
Prerequisites
To complete this tutorial, you need the following:
- An Azure resource to monitor. You can use any resource in your Azure subscription that supports diagnostic settings. To determine whether a resource supports diagnostic settings, go to its menu in the Azure portal and verify that there's a Diagnostic settings option in the Monitoring section of the menu.
If you're using any Azure resource other than a virtual machine:
- A diagnostic setting to send the resource logs from your Azure resource to a Log Analytics workspace. See Tutorial: Create Log Analytics workspace in Azure Monitor.
If you're using an Azure virtual machine:
- A data collection rule to send guest logs and metrics to a Log Analytics workspace. See Tutorial: Collect guest logs and metrics from Azure virtual machine.
Select a log query and verify results
Data is retrieved from a Log Analytics workspace using a log query written in Kusto Query Language (KQL). Insights and solutions in Azure Monitor provide log queries to retrieve data for a particular service, but you can work directly with log queries and their results in the Azure portal with Log Analytics.
Select Logs from your resource's menu. Log Analytics opens with the Queries window that includes prebuilt queries for your Resource type. Select Alerts to view queries designed for alert rules.
Note
If the Queries window doesn't open, click Queries in the top right.
Select a query and click Run to load it in the query editor and return results. You may want to modify the query and run it again. For example, the Show anonymous requests query for storage accounts is shown in the following screenshot. You may want to modify the AuthenticationType or filter on a different column.
Create alert rule
Once you verify your query, you can create the alert rule. Select New alert rule to create a new alert rule based on the current log query. The Scope is already set to the current resource. You don't need to change this value.
Configure condition
On the Condition tab, the Log query is already filled in. The Measurement section defines how the records from the log query are measured. If the query doesn't perform a summary, then the only option is to Count the number of Table rows. If the query includes one or more summarized columns, then you have the option to use the number of Table rows or a calculation based on any of the summarized columns. Aggregation granularity defines the time interval over which the collected values are aggregated. For example, if the aggregation granularity is set to 5 minutes, the alert rule evaluates the data aggregated over the last 5 minutes. If the aggregation granularity is set to 15 minutes, the alert rule evaluates the data aggregated over the last 15 minutes. It is important to choose the right aggregation granularity for your alert rule, as it can affect the accuracy of the alert.
Note
The combined size of all data in the log alert rule properties cannot exceed 64KB. This can be caused by too many dimensions, the query being too large, too many action groups, or a long description. When creating a large alert rule, remember to optimize these areas.
Configure dimensions
Split by dimensions allows you to create separate alerts for different resources. This setting is useful when you're creating an alert rule that applies to multiple resources. With the scope set to a single resource, this setting typically isn't used.
If you need certain dimensions included in the alert notification email, you can specify a dimension (for example, "Computer"), the alert notification email will include the computer name that triggered the alert. The alerting engine uses the alert query to determine the available dimensions. If you do not see the dimension you want in the drop-down list for the "Dimension name", it is because the alert query does not expose that column in the results. You can easily add the dimensions you want by adding a Project line to your query that includes the columns you want to use. You can also use the Summarize line to add more columns to the query results.
Configure alert logic
In the alert logic, configure the Operator and Threshold value to compare to the value returned from the measurement. An alert is created when this value is true. Select a value for Frequency of evaluation which defines how often the log query is run and evaluated. The cost for the alert rule increases with a lower frequency. When you select a frequency, the estimated monthly cost is displayed in addition to a preview of the query results over a time period.
For example, if the measurement is Table rows, the alert logic may be Greater than 0 indicating that at least one record was returned. If the measurement is a columns value, then the logic may need to be greater than or less than a particular threshold value. In the following example, the log query is looking for anonymous requests to a storage account. If an anonymous request is made, then we should trigger an alert. In this case, a single row returned would trigger the alert, so the alert logic should be Greater than 0.
Configure actions
Action groups define a set of actions to take when an alert is fired such as sending an email or an SMS message.
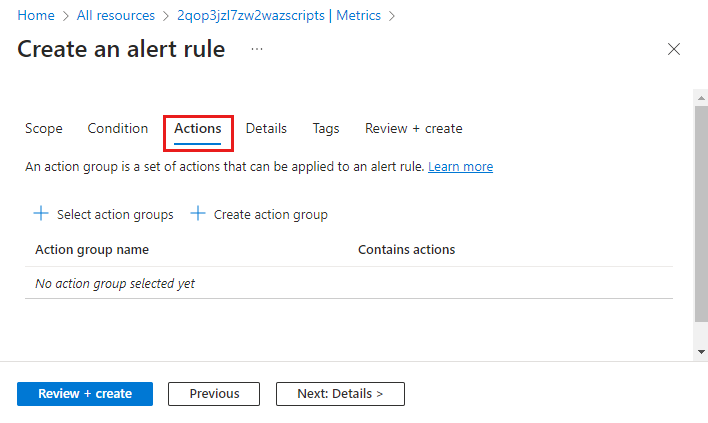
To configure actions, select the Actions tab.
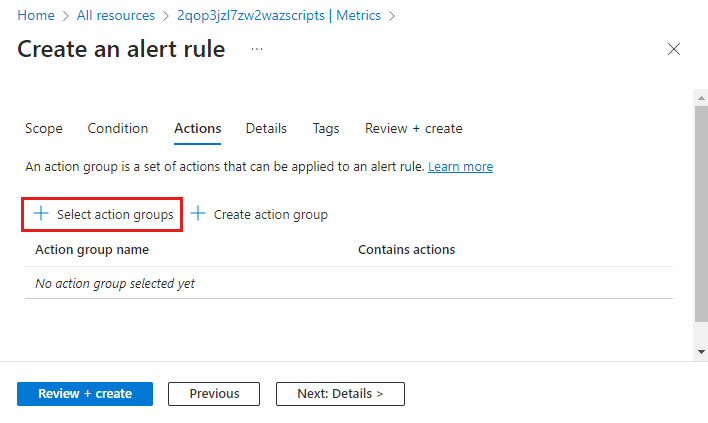
Click Select action groups to add one to the alert rule.
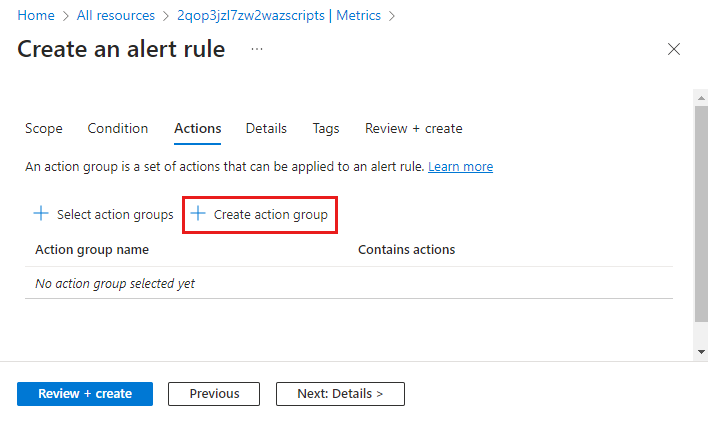
If you don't already have an action group in your subscription to select, then click Create action group to create a new one.
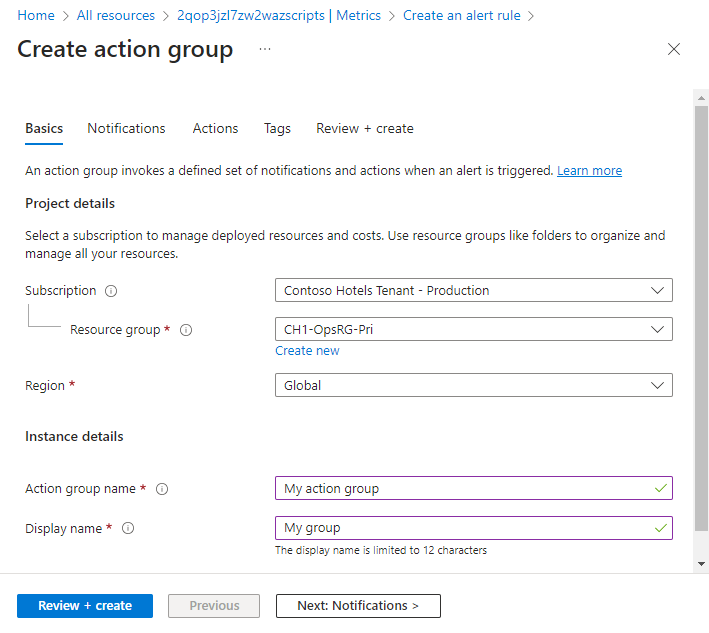
Select a Subscription and Resource group for the action group and give it an Action group name that will appear in the portal and a Display name that will appear in email and SMS notifications.
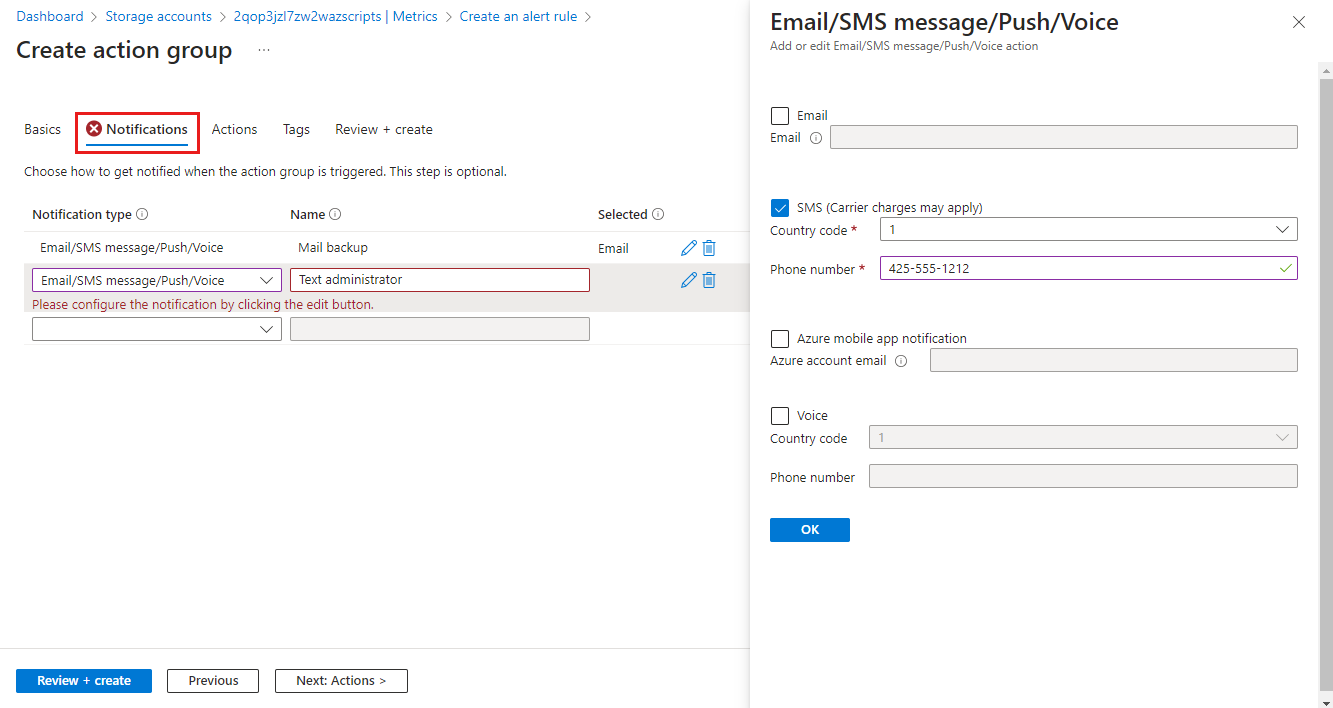
Select the Notifications tab and add one or more methods to notify appropriate people when the alert is fired.
Configure details
Select the Details tab and configure different settings for the alert rule.
- Alert rule name which should be descriptive since it will be displayed when the alert is fired.
- Optionally provide an Alert rule description that's included in the details of the alert.
- Subscription and Resource group where the alert rule will be stored. This doesn't need to be in the same resource group as the resource that you're monitoring.
- Severity for the alert. The severity allows you to group alerts with a similar relative importance. A severity of Error is appropriate for an unresponsive virtual machine.
- Under Advanced options, keep the box checked to Enable upon creation.
- Under Advanced options, keep the box checked to Automatically resolve alerts. This will make the alert stateful, which means that the alert is resolved when the condition isn't met anymore.
Click Create alert rule to create the alert rule.
View the alert
When an alert fires, it sends any notifications in its action groups. You can also view the alert in the Azure portal.
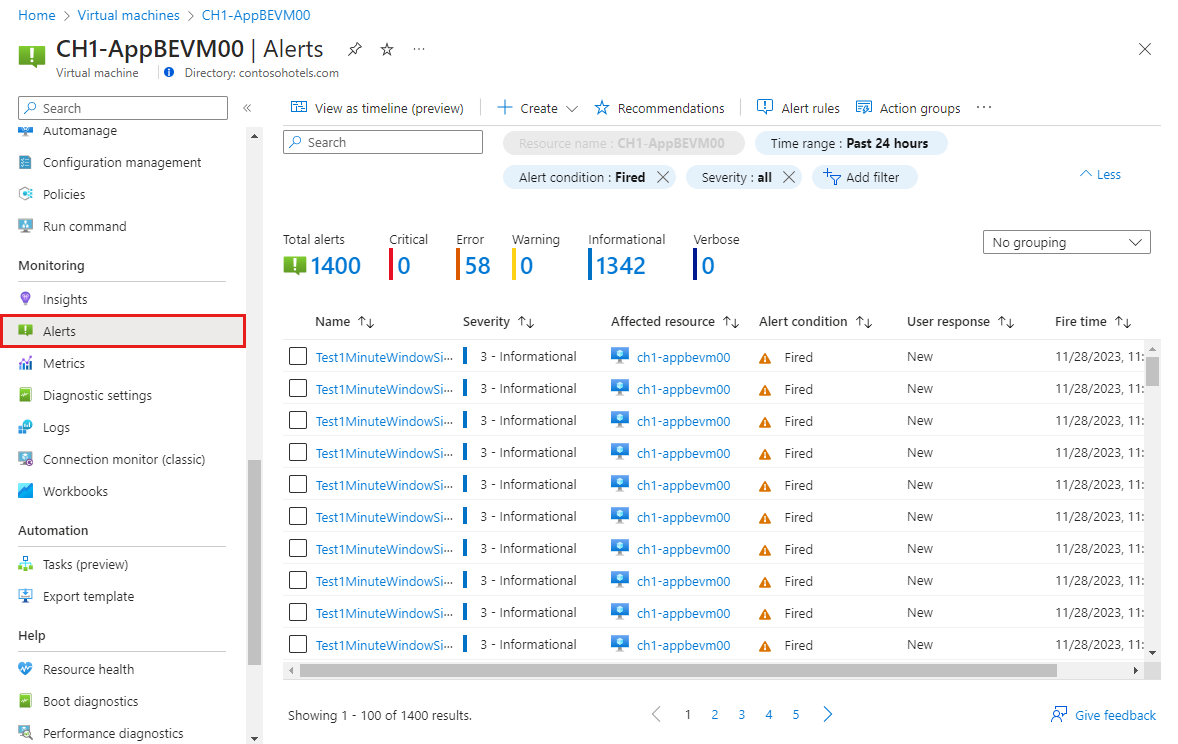
Select Alerts from the resource's menu. If there are any open alerts for the resources, they are included in the view.
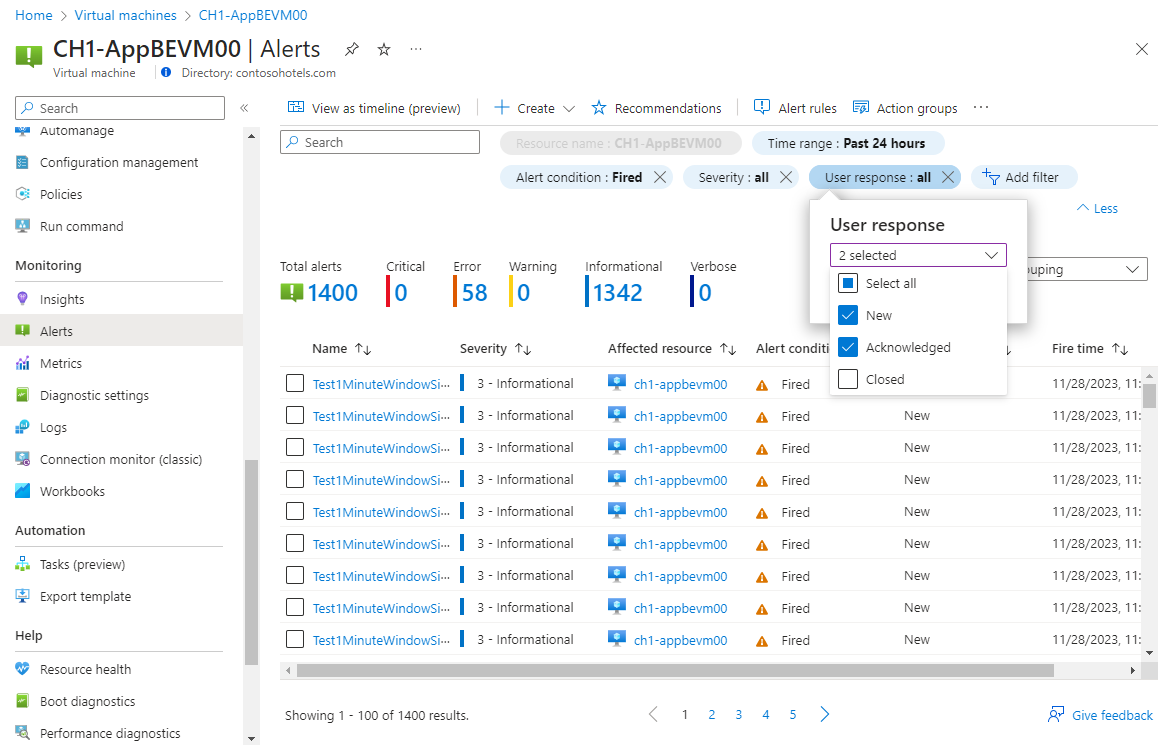
Click on a severity to show the alerts with that severity. Select the User response and unselect Closed to view only open alerts.
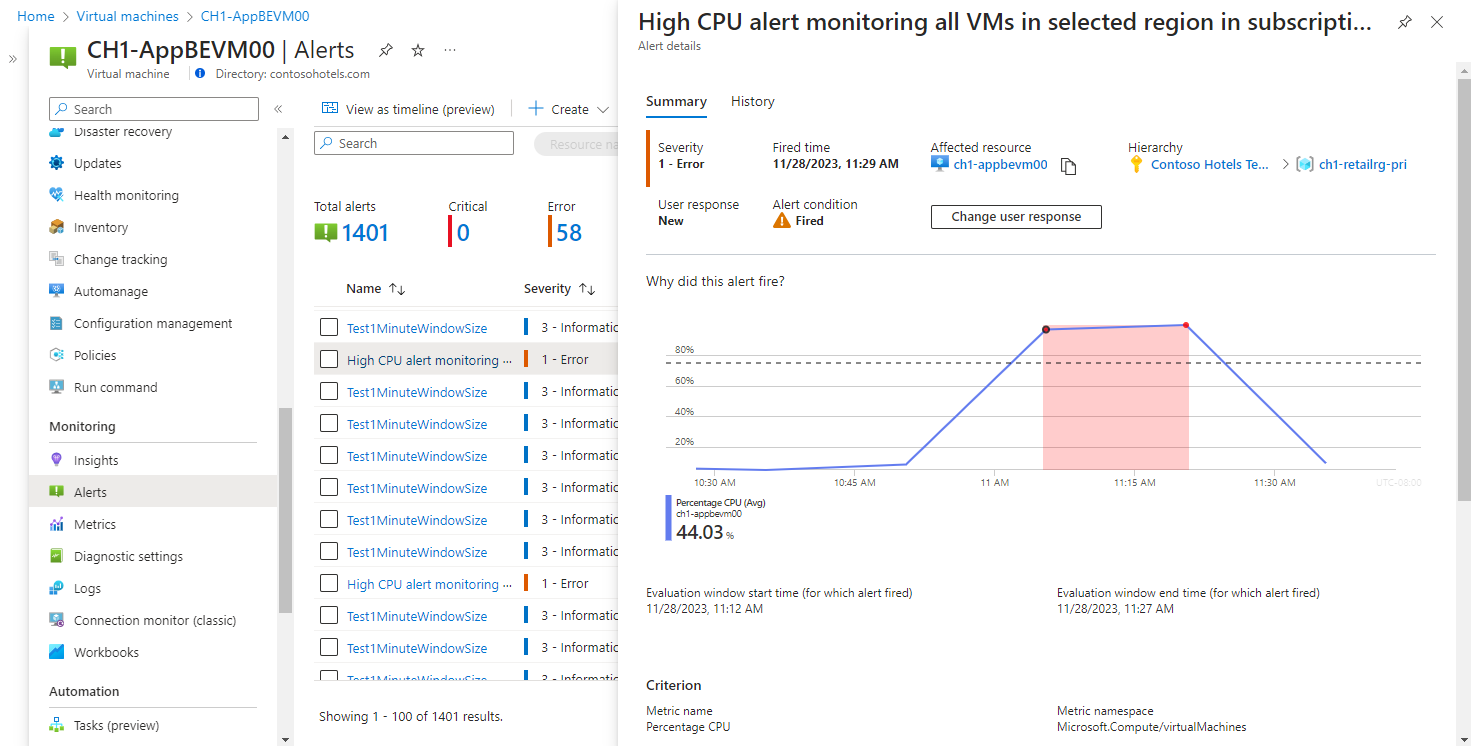
Click on the name of an alert to view its detail.
Next steps
Now that you've learned how to create a log search alert for an Azure resource, have a look at workbooks for creating interactive visualizations of monitoring data.


