Σημείωση
Η πρόσβαση σε αυτήν τη σελίδα απαιτεί εξουσιοδότηση. Μπορείτε να δοκιμάσετε να εισέλθετε ή να αλλάξετε καταλόγους.
Η πρόσβαση σε αυτήν τη σελίδα απαιτεί εξουσιοδότηση. Μπορείτε να δοκιμάσετε να αλλάξετε καταλόγους.
APPLIES TO: SDK v4
A trace activity is an activity that your bot can send to the Bot Framework Emulator. You can use trace activities to interactively debug a bot, as they allow you to view information about your bot while it runs locally.
Trace activities are sent only to the Emulator and not to any other client or channel. The Emulator displays them in the log but not the main chat panel.
- Trace activities sent via the turn context are sent through the send activity handlers registered on the turn context.
- Trace activities sent via the turn context are associated with the inbound activity, by applying the conversation reference, if there was one. For a proactive message, the reply to ID will be a new GUID.
- Regardless of how it's sent, a trace activity never sets the responded flag.
Note
To build agents with your choice of AI services, orchestration, and knowledge, consider using the Microsoft 365 Agents SDK. The Agents SDK has support for C#, JavaScript or Python. You can learn more about the Agents SDK at aka.ms/agents. If you're looking for a SaaS-based agent platform, consider Microsoft Copilot Studio. If you have an existing bot built with the Bot Framework SDK, you can update your bot to the Agents SDK. You can review the core changes and updates at Bot Framework SDK to Agents SDK migration guidance. Support tickets for the Bot Framework SDK will no longer be serviced as of December 31, 2025.
To use a trace activity
In order to see a trace activity in the Emulator, you need a scenario in which your bot will send a trace activity, such as throwing an exception and sending a trace activity from the adapter's on turn error handler.
To send a trace activity from your bot:
- Create a new activity.
- Set its required type property to "trace".
- Optionally, set its name, label, value, and value type properties, as appropriate for the trace.
- Use the turn context object's send activity method to send the trace activity.
- This method adds values for the remaining required properties of the activity, based on the incoming activity. These properties include the channel ID, service URL, from, and recipient properties.
To view a trace activity in the Emulator:
- Run the bot locally on your machine.
- Test it using the Emulator.
- Interact with the bot and use the steps in your scenario to generate the trace activity.
- When your bot emits the trace activity, the trace activity is displayed in the Emulator log.
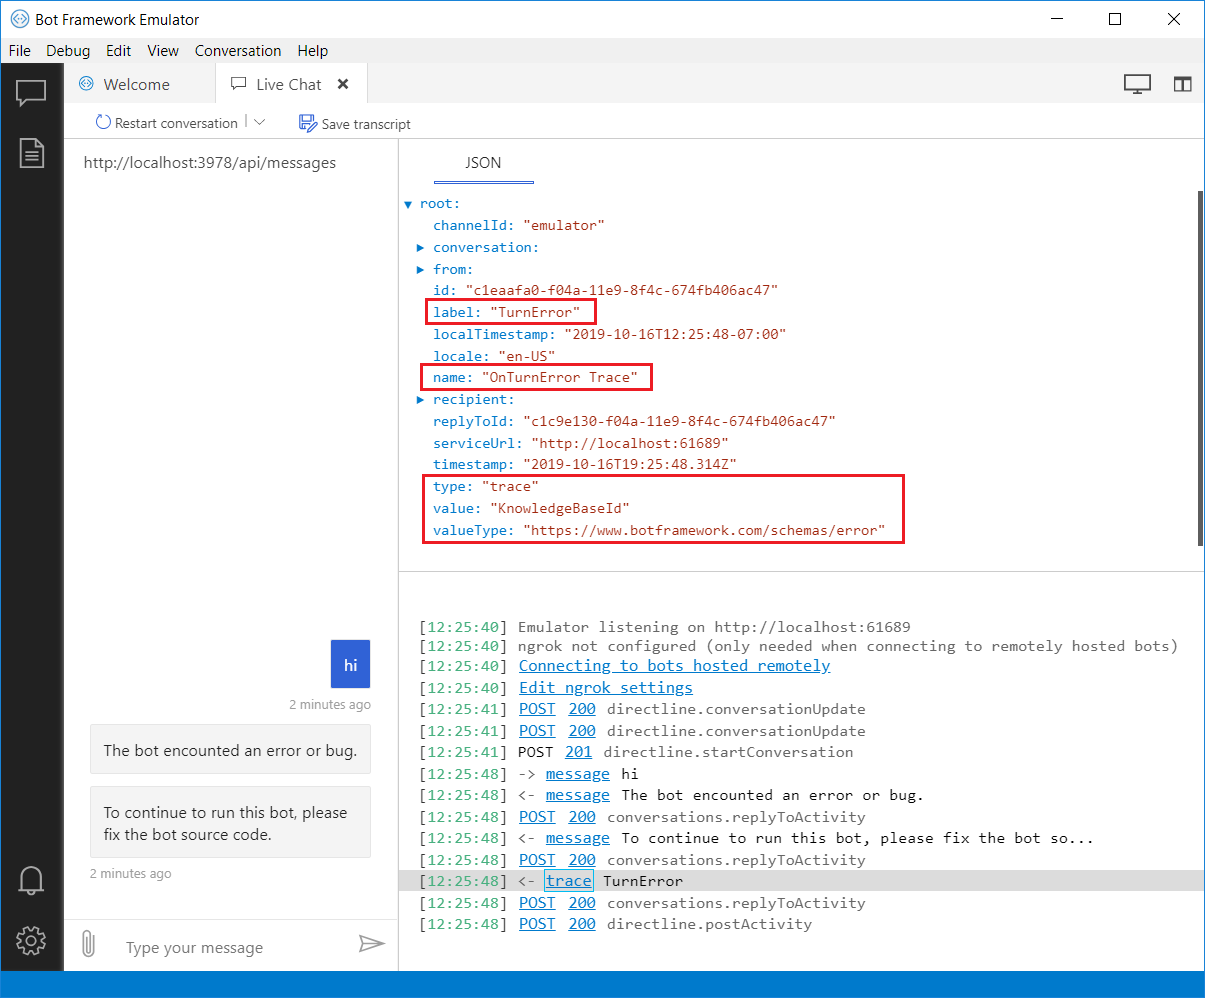
Here's a trace activity you might see if you ran the Core bot without first setting up the QnAMaker knowledge base that the bot relies upon.
Add a trace activity to the adapter's on-error handler
The adapter's on turn error handler catches any otherwise uncaught exception thrown from the bot during a turn. The error handler is a good place for a trace activity, as you can send a user-friendly message to the user and send debugging information about the exception to the Emulator.
This example code is from the Core Bot sample. See the complete sample in C#, JavaScript, Python, or Java.
The adapter's OnTurnError handler creates the trace activity to include the exception information and sends it to the Emulator.
AdapterWithErrorHandler.cs
Warning
It looks like the sample you are looking for has moved! Rest assured we are working on resolving this.
Next steps
- How to Debug a bot with inspection middleware describes how to add middleware that emits trace activities.
- For debugging a deployed bot, you can use Application Insights. For more information, see Add telemetry to your bot.
- For detailed information about each activity type, see the Bot Framework Activity schema.