συμβάν
17 Μαρ, 9 μ.μ. - 21 Μαρ, 10 π.μ.
Συμμετάσχετε στη σειρά meetup για να δημιουργήσετε κλιμακούμενες λύσεις AI που βασίζονται σε πραγματικές περιπτώσεις χρήσης με συναδέλφους προγραμματιστές και ειδικούς.
Εγγραφή τώραΑυτό το πρόγραμμα περιήγησης δεν υποστηρίζεται πλέον.
Κάντε αναβάθμιση σε Microsoft Edge για να επωφεληθείτε από τις τελευταίες δυνατότητες, τις ενημερώσεις ασφαλείας και την τεχνική υποστήριξη.
Azure DevOps Services | Azure DevOps Server 2022 - Azure DevOps Server 2019
Teams use the forecast tool to help in their sprint planning efforts. By plugging in a value for the team velocity, the forecast tool shows which items in the backlog can be completed within future sprints. Both tools are team-specific tools that rely on the team's ability to estimate backlog items. Once your team has completed a sprint or two, they can use the team velocity to forecast how much of the backlog they can finish within the upcoming sprints.
Use this article to learn:
Σημείωση
For more information, see Backlogs, boards, and plans. In case you don't see the desired work items on your backlog or board, see Set up your backlogs and boards.
| Category | Requirements |
|---|---|
| Project membership | Project member. |
| Permissions | Member of the Contributors security group. |
| Access levels | At least Basic access. |
Σημείωση
Users with Stakeholder access for a public project have full access to backlog and board features just like users with Basic access. For more information, see Stakeholder access quick reference.
Here's what you need to have in place before you attempt to forecast your team's backlog.
Required:
Recommended:
Σημείωση
If you work with several teams, and each team wants to work with their own backlog, velocity chart, and forecast tool, you can create additional teams. Each team then gets access to their own set of Agile tools. Each Agile tool filters work items to only include those whose assigned area paths and iteration paths meet those set for the team.
Use the forecast tool to get an idea of how many items you can complete within a sprint. By plugging in a velocity, you can see which items are within scope for the set of sprints the team has activated.
To forecast your product backlog, complete the following actions.
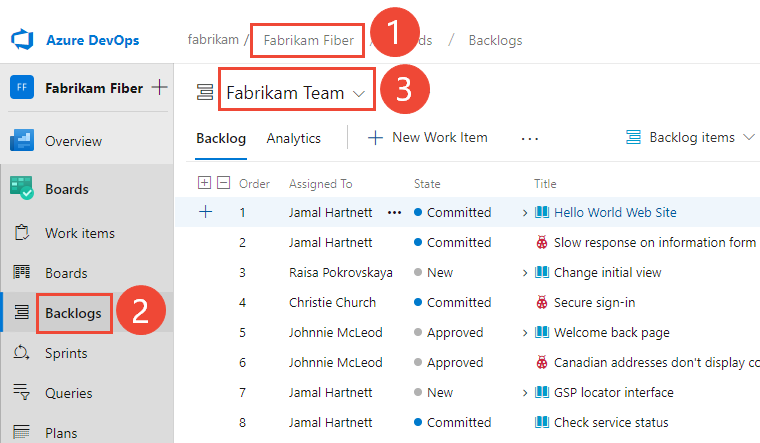
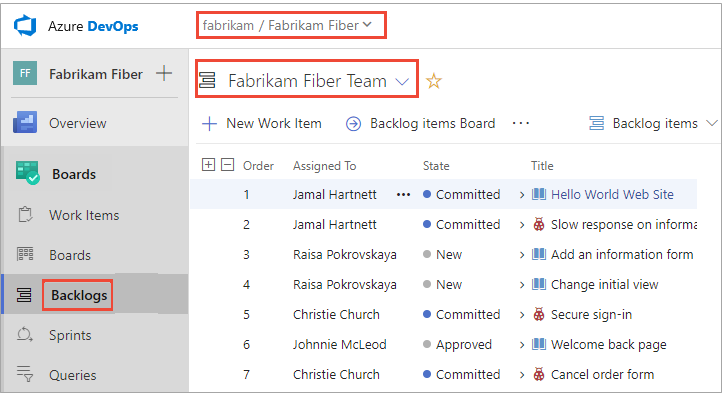
(1) Check that you've selected the right project, (2) choose Boards>Backlogs, and then (3) select the correct team from the team selector menu.
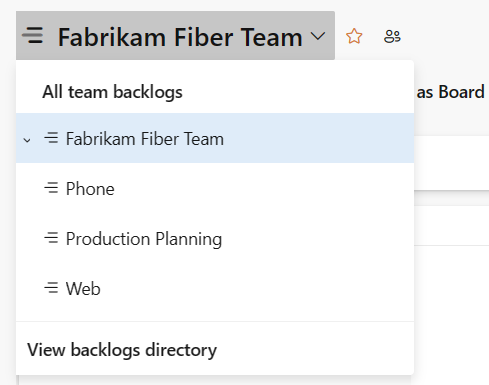
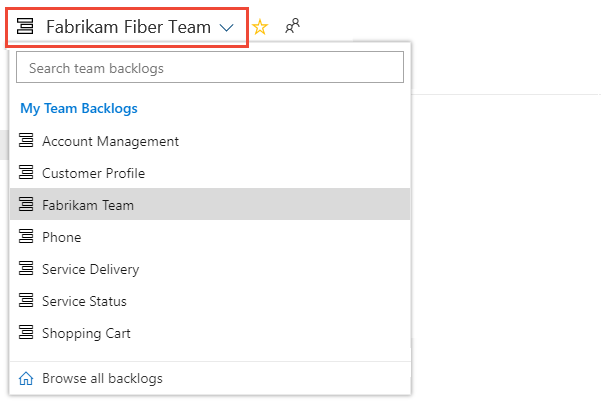
To select another backlog, open the selector and then choose a different team or select the View Backlog directory option. Or, enter a keyword in the search box to filter the list of team backlogs for the project.
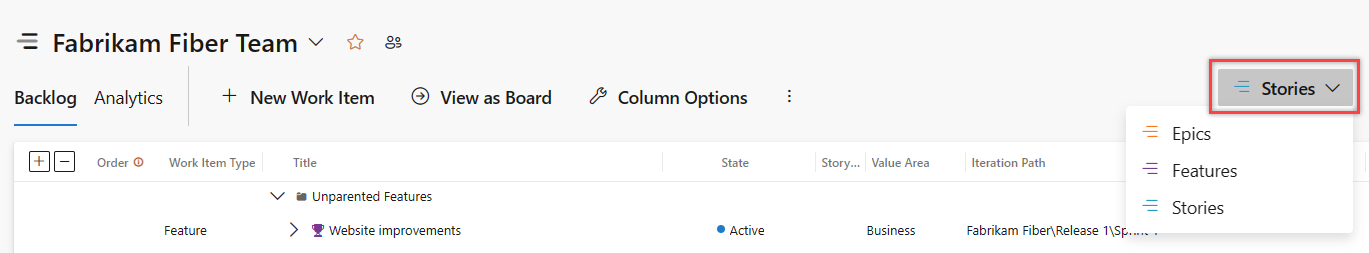
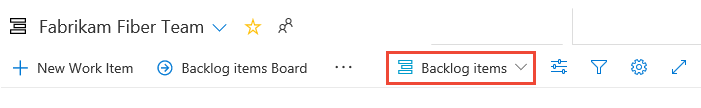
Check that you have selected Stories (for Agile), Issues (for Basic), Backlog items (for Scrum), or Requirements (for CMMI) as the backlog level.
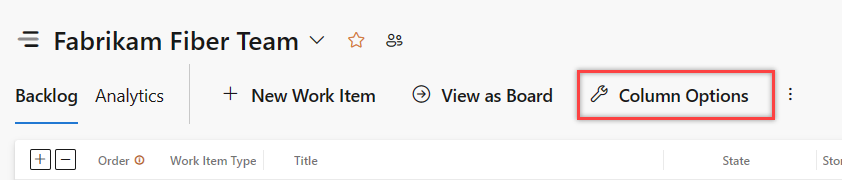
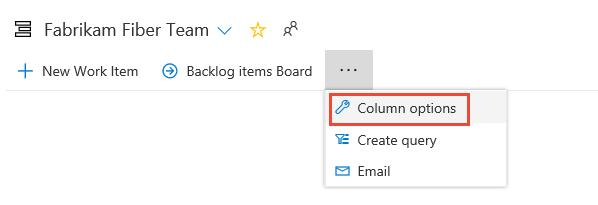
(Optional) To choose which columns should display and in what order, choose the ![]() actions icon and select Column options. For more information, see Change column options.
actions icon and select Column options. For more information, see Change column options.
Choose the ![]() view options icon and slide Forecasting to On. To keep things simple, turn the Mapping and Planning panes Off.
view options icon and slide Forecasting to On. To keep things simple, turn the Mapping and Planning panes Off.
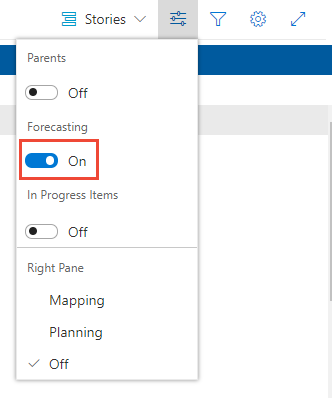
Set In Progress Items to Off to hide those items that won't be counted in the forecast. The forecast tool ignores Scrum items set to Committed or Done and Agile and CMMI items set to Active, Resolved, or Completed.
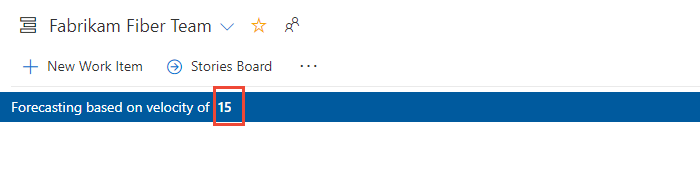
Enter your team's predicted velocity.
Συμβουλή
If your team has been working for several sprints, you can gain an idea of your team's velocity from the Velocity widget.
The tool draws lines for each future sprint selected by the team. The Forecast lines show how much work your team can complete in future sprints. Typically, items above the first line are already in progress for the current sprint. Items that fall between the first and second forecast lines indicate what can be completed in the named sprint.
From your web browser, open your product backlog. (1) Check that you've selected the right project, (2) choose Boards>Backlogs, and then (3) select the correct team from the team selector menu.
To choose another team, open the selector and select a different team or choose the ![]() Browse all team backlogs option. Or, you can enter a keyword in the search box to filter the list of team backlogs for the project.
Browse all team backlogs option. Or, you can enter a keyword in the search box to filter the list of team backlogs for the project.
Check that you have selected Backlog items (for Scrum), Stories (for Agile), or Requirements (for CMMI) as the backlog level. You can only forecast a product backlog. You can't forecast a portfolio backlog such as Features or Epics.
(Optional) To choose which columns should display and in what order, choose the ![]() actions icon and select Column options. You may want to add the Iteration Path to the set of columns that appear on your backlog. For more information, see Change column options.
actions icon and select Column options. You may want to add the Iteration Path to the set of columns that appear on your backlog. For more information, see Change column options.
Choose the ![]() view options icon and slide Forecasting to On. To keep things simple, turn the Mapping and Planning panes Off.
view options icon and slide Forecasting to On. To keep things simple, turn the Mapping and Planning panes Off.
Set In Progress Items to Off to hide those items that won't be counted in the forecast. The forecast tool ignores Scrum items set to Committed or Done and Agile and CMMI items set to Active, Resolved, or Completed.
Enter your team's predicted velocity. If the Forecasting bar doesn't appear.
Συμβουλή
If your team has been working for several sprints, you can gain an idea of your team's velocity from the Velocity widget.
The tool draws lines for each future sprint selected by the team. The Forecast lines show how much work your team can complete in future sprints. Typically, items above the first line are already in progress for the current sprint. Items that fall between the first and second forecast lines indicate what can be completed in the named sprint.
In this example, a Velocity of 20 is used. The forecast tool limits the number of items that are shown between the forecast lines to those items that can be completed within the sprint or using unused velocity points from the previous sprint.
The forecast tool shows between two and four items can be worked on during Iterations 2 through 6 based on the number of Story Points you assigned to each user story or bug. The forecast logic carries over velocity points from one sprint to the next.
Iteration 2: 13 Story Points, items 1 and 2 can be completed; 7 velocity points are carried over to the next sprint
Iteration 3: 24 Story Points, items 3 through 5 can be completed; 3 (=20+7-24) velocity points are carried over to the next sprint
Iteration 4: 21 Story points, items 6 through 8 can be completed; 2 (=20+3-21) velocity points are carried over to the next sprint
Iteration 5: 16 Story points, items 9 through 12 can be completed; 6 (=20+2-16) velocity points are carried over to the next sprint
Iteration 6: 23 Story points, items 13 through 16 can be completed; 3 (=20+6-23) velocity points are carried over to the next sprint

Another way to use the forecast tool is to enter different velocity values until all the backlog items are completed within a given set of sprints. This forecast provides an estimate of what velocity is required to complete your backlog of items.
You can then assess the delta between the current team's velocity and the required velocity. The delta helps determine what other resources are required to meet production demands within a required time.
συμβάν
17 Μαρ, 9 μ.μ. - 21 Μαρ, 10 π.μ.
Συμμετάσχετε στη σειρά meetup για να δημιουργήσετε κλιμακούμενες λύσεις AI που βασίζονται σε πραγματικές περιπτώσεις χρήσης με συναδέλφους προγραμματιστές και ειδικούς.
Εγγραφή τώραΕκπαίδευση
Διαδρομή εκμάθησης
Use advance techniques in canvas apps to perform custom updates and optimization - Training
Use advance techniques in canvas apps to perform custom updates and optimization