Tutorial: Build an Apache Spark machine learning application in Azure HDInsight
In this tutorial, you learn how to use the Jupyter Notebook to build an Apache Spark machine learning application for Azure HDInsight.
MLlib is Spark's adaptable machine learning library consisting of common learning algorithms and utilities. (Classification, regression, clustering, collaborative filtering, and dimensionality reduction. Also, underlying optimization primitives.)
In this tutorial, you learn how to:
- Develop an Apache Spark machine learning application
Prerequisites
An Apache Spark cluster on HDInsight. See Create an Apache Spark cluster.
Familiarity with using Jupyter Notebooks with Spark on HDInsight. For more information, see Load data and run queries with Apache Spark on HDInsight.
Understand the data set
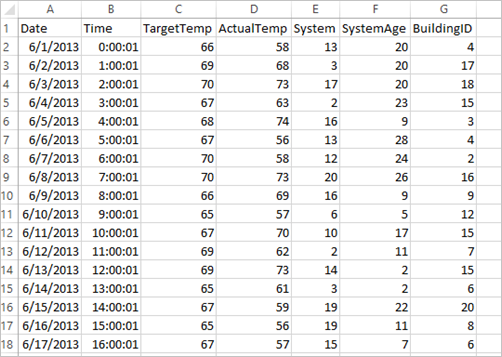
The application uses the sample HVAC.csv data that is available on all clusters by default. The file is located at \HdiSamples\HdiSamples\SensorSampleData\hvac. The data shows the target temperature and the actual temperature of some buildings that have HVAC systems installed. The System column represents the system ID and the SystemAge column represents the number of years the HVAC system has been in place at the building. You can predict whether a building will be hotter or colder based on the target temperature, given system ID, and system age.

Develop a Spark machine learning application using Spark MLlib
This application uses a Spark ML pipeline to do a document classification. ML Pipelines provide a uniform set of high-level APIs built on top of DataFrames. The DataFrames help users create and tune practical machine learning pipelines. In the pipeline, you split the document into words, convert the words into a numerical feature vector, and finally build a prediction model using the feature vectors and labels. Do the following steps to create the application.
Create a Jupyter Notebook using the PySpark kernel. For the instructions, see Create a Jupyter Notebook file.
Import the types required for this scenario. Paste the following snippet in an empty cell, and then press SHIFT + ENTER.
from pyspark.ml import Pipeline
from pyspark.ml.classification import LogisticRegression
from pyspark.ml.feature import HashingTF, Tokenizer
from pyspark.sql import Row

import os
import sys
from pyspark.sql.types import *

from pyspark.mllib.classification import LogisticRegressionWithLBFGS
from pyspark.mllib.regression import LabeledPoint
from numpy import array
Load the data (hvac.csv), parse it, and use it to train the model.
# Define a type called LabelDocument
LabeledDocument = Row("BuildingID", "SystemInfo", "label")

# Define a function that parses the raw CSV file and returns an object of type LabeledDocument
def parseDocument(line):
    values = [str(x) for x in line.split(',')]
    if (values[3] > values[2]):
        hot = 1.0
    else:
        hot = 0.0

    textValue = str(values[4]) + " " + str(values[5])

    return LabeledDocument((values[6]), textValue, hot)

# Load the raw HVAC.csv file, parse it using the function
data = sc.textFile("/HdiSamples/HdiSamples/SensorSampleData/hvac/HVAC.csv")

documents = data.filter(lambda s: "Date" not in s).map(parseDocument)
training = documents.toDF()
In the code snippet, you define a function that compares the actual temperature with the target temperature. If the actual temperature is greater, the building is hot, denoted by the value 1.0. Otherwise the building is cold, denoted by the value 0.0.
Configure the Spark machine learning pipeline that consists of three stages:
tokenizer,hashingTF, andlr.tokenizer = Tokenizer(inputCol="SystemInfo", outputCol="words") hashingTF = HashingTF(inputCol=tokenizer.getOutputCol(), outputCol="features") lr = LogisticRegression(maxIter=10, regParam=0.01) pipeline = Pipeline(stages=[tokenizer, hashingTF, lr])For more information about pipeline and how it works, see Apache Spark machine learning pipeline.
Fit the pipeline to the training document.
model = pipeline.fit(training)Verify the training document to checkpoint your progress with the application.
training.show()The output is similar to:
+----------+----------+-----+
|BuildingID|SystemInfo|label|
+----------+----------+-----+
|         4|     13 20|  0.0|
|        17|      3 20|  0.0|
|        18|     17 20|  1.0|
|        15|      2 23|  0.0|
|         3|      16 9|  1.0|
|         4|     13 28|  0.0|
|         2|     12 24|  0.0|
|        16|     20 26|  1.0|
|         9|      16 9|  1.0|
|        12|       6 5|  0.0|
|        15|     10 17|  1.0|
|         7|      2 11|  0.0|
|        15|      14 2|  1.0|
|         6|       3 2|  0.0|
|        20|     19 22|  0.0|
|         8|     19 11|  0.0|
|         6|      15 7|  0.0|
|        13|      12 5|  0.0|
|         4|      8 22|  0.0|
|         7|      17 5|  0.0|
+----------+----------+-----+
Comparing the output against the raw CSV file. For example, the first row the CSV file has this data:

Notice how the actual temperature is less than the target temperature suggesting the building is cold. The value for label in the first row is 0.0, which means the building isn't hot.
Prepare a data set to run the trained model against. To do so, you pass on a system ID and system age (denoted as SystemInfo in the training output). The model predicts whether the building with that system ID and system age will be hotter (denoted by 1.0) or cooler (denoted by 0.0).
# SystemInfo here is a combination of system ID followed by system age
Document = Row("id", "SystemInfo")
test = sc.parallelize([("1L", "20 25"),
                ("2L", "4 15"),
                ("3L", "16 9"),
                ("4L", "9 22"),
                ("5L", "17 10"),
                ("6L", "7 22")]) \
    .map(lambda x: Document(*x)).toDF()
Finally, make predictions on the test data.
# Make predictions on test documents and print columns of interest
prediction = model.transform(test)
selected = prediction.select("SystemInfo", "prediction", "probability")
for row in selected.collect():
    print (row)
The output is similar to:
Row(SystemInfo=u'20 25', prediction=1.0, probability=DenseVector([0.4999, 0.5001]))
Row(SystemInfo=u'4 15', prediction=0.0, probability=DenseVector([0.5016, 0.4984]))
Row(SystemInfo=u'16 9', prediction=1.0, probability=DenseVector([0.4785, 0.5215]))
Row(SystemInfo=u'9 22', prediction=1.0, probability=DenseVector([0.4549, 0.5451]))
Row(SystemInfo=u'17 10', prediction=1.0, probability=DenseVector([0.4925, 0.5075]))
Row(SystemInfo=u'7 22', prediction=0.0, probability=DenseVector([0.5015, 0.4985]))
Observe the first row in the prediction. For an HVAC system with ID 20 and system age of 25 years, the building is hot (prediction=1.0). The first value for DenseVector (0.49999) corresponds to the prediction 0.0 and the second value (0.5001) corresponds to the prediction 1.0. In the output, even though the second value is only marginally higher, the model shows prediction=1.0.
Shut down the notebook to release the resources. To do so, from the File menu on the notebook, select Close and Halt. This action shuts down and closes the notebook.
Use Anaconda scikit-learn library for Spark machine learning
Apache Spark clusters in HDInsight include Anaconda libraries. It also includes the scikit-learn library for machine learning. The library also includes various data sets that you can use to build sample applications directly from a Jupyter Notebook. For examples on using the scikit-learn library, see https://scikit-learn.org/stable/auto_examples/index.html.
Clean up resources
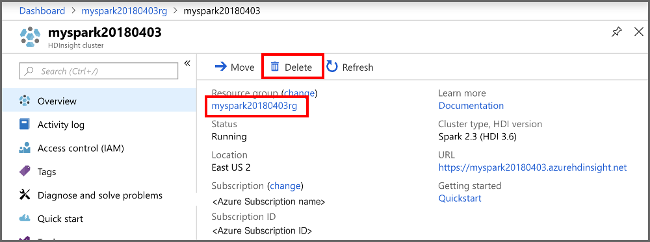
If you're not going to continue to use this application, delete the cluster that you created with the following steps:
Sign in to the Azure portal.
In the Search box at the top, type HDInsight.
Select HDInsight clusters under Services.
In the list of HDInsight clusters that appears, select the ... next to the cluster that you created for this tutorial.
Select Delete. Select Yes.

Next steps
In this tutorial, you learned how to use the Jupyter Notebook to build an Apache Spark machine learning application for Azure HDInsight. Advance to the next tutorial to learn how to use IntelliJ IDEA for Spark jobs.