Azure Usage report - Cloud product performance
Appropriate roles: Admin agent | Report viewer | Executive report viewer
The Azure Usage report presents metrics related to your customers' Azure subscriptions. This report includes Azure consumption revenue and usage by meter categories. You can view the following sections from the Azure Usage report.
- Summary
- Azure usage by geography
- Azure utilization
- Azure services with anomalies
Note
This report is available from the Insights dashboard. To view this report, you must be assigned a specific role in Partner Center, such as Account Admin, Report Viewer or Executive Report Viewer. Specific types of data in this report might also be available only to users with Executive Report Viewer privileges.
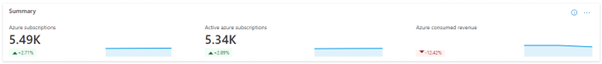
Summary
The summary section presents a snapshot view of the key performance indicators (KPIs) related to Azure subscriptions sold or managed by you for your customers.
- Azure Subscriptions: Current count of Azure customer subscriptions sold or managed by you. Percentage growth or decline of these Azure subscriptions during the selected date range.
The Micro chart presents a month-over-month trend of Azure subscriptions count for your selected date range.
- Active Azure Subscriptions: Current count of Azure subscriptions sold or managed by you that had active usage over the last 30 days. Percentage growth or decline of these subscriptions during the selected date range.
The Micro chart presents a month-over-month trend of the Azure active subscription count during your selected date range.
- Azure Consumed Revenue (ACR): Total Azure Consumed Revenue (in USD) attributed to you over the selected date range. Percentage growth or decline of attributed ACR US$ during the selected date range.
The Micro chart presents a monthly trend of ACR in USD attributed to you over the selected time period
Note
Azure Consumed Revenue (ACR) will only be visible to users who have been assigned the Executive Report Viewer Role.
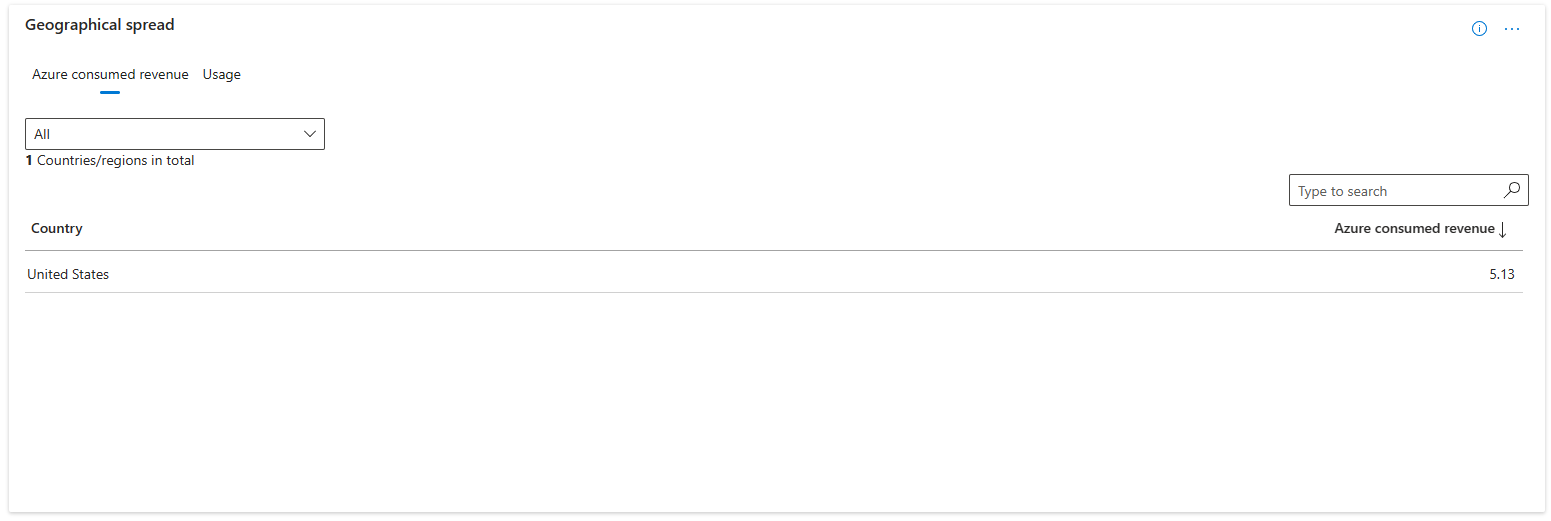
Azure usage by geography
The table presents the Azure consumed revenue and Usage against the countries/regions where the usage events are generated.
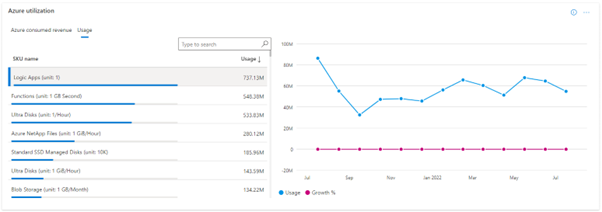
Azure utilization
This view shows the month-over-month Azure consumption revenue or usage hours trends by selected Azure service level/meter categories.
The bar chart presents the monthly revenue/usage hour trend. The line chart presents the growth trend compared to the previous month for the selected Azure service level/meter categories.
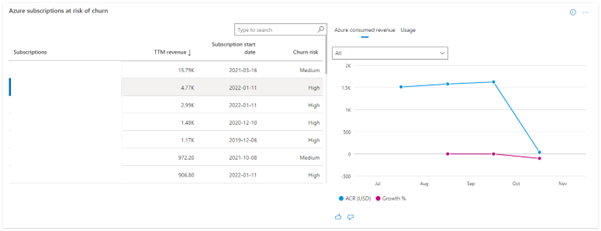
Azure subscriptions at risk of churn
Users can now view the subscriptions which are at the risk of churn and take corrective actions by discussing with the Customers. You can view the ACR trend and usage trend and view the break down by workloads.
Note
You can download the raw data for this report from the Download Reports section in the Insights dashboard.
Related content
- For more reports, see Partner Center Insights.