Display percentage values on pie chart in a paginated report (Report Builder)
Applies to: ![]() Microsoft Report Builder (SSRS)
Microsoft Report Builder (SSRS) ![]() Power BI Report Builder
Power BI Report Builder ![]() Report Designer in SQL Server Data Tools
Report Designer in SQL Server Data Tools
In paginated reports, by default the legend shows categories. You might also want percentages in the legend or the pie slices themselves.
The Tutorial: Add a Pie Chart to Your Report (Report Builder) walks you through adding percentages to pie slices, if you'd like to practice with sample data.
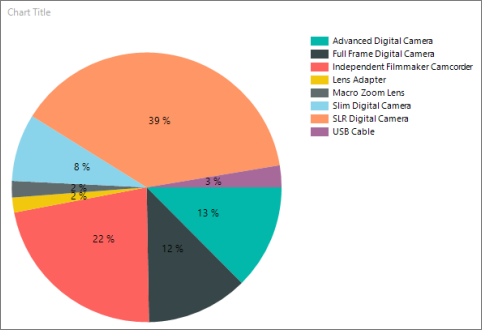
Display percentage values as labels on a pie chart
Add a pie chart to your report. For more information, see Add a Chart to a Report (Report Builder and SSRS).
On the design surface, right-click on the pie and select Show Data Labels. The data labels should appear within each slice on the pie chart.
On the design surface, right-click on the labels and select Series Label Properties. The Series Label Properties dialog box appears.
Type #PERCENT for the Label data option.
(Optional) To specify how many decimal places the label shows, type "#PERCENT{Pn}" where n is the number of decimal places to display. For example, to display no decimal places, type "#PERCENT{P0}".
Display percentage values in the legend of a pie chart
On the design surface, right-click on the pie chart and select Series Properties. The Series Properties dialog box displays.
In Legend, type #PERCENT for the Custom legend text property.
Related content
Σχόλια
Σύντομα διαθέσιμα: Καθ' όλη τη διάρκεια του 2024 θα καταργήσουμε σταδιακά τα ζητήματα GitHub ως μηχανισμό ανάδρασης για το περιεχόμενο και θα το αντικαταστήσουμε με ένα νέο σύστημα ανάδρασης. Για περισσότερες πληροφορίες, ανατρέξτε στο θέμα: https://aka.ms/ContentUserFeedback.
Υποβολή και προβολή σχολίων για