Troubleshooting High CPU in an IIS application pool
Applies to: Internet Information Services
This troubleshooter will help you to identify the cause of sustained high CPU in an Internet Information Services (IIS) application pool. It's important to keep in mind that it is normal for CPU usage to increase as a web application serves requests. However, if you consistently see CPU remain at a high level (in the area of 80% or greater) for prolonged periods, the performance of your application will suffer. For that reason, it's important to understand the cause of sustained high CPU so that it can be addressed and corrected if possible.
Scenario
An application pool in IIS is experiencing a prolonged period of high CPU that exceeds 90%. When the application is tested, no problems are encountered. However, once the application experiences actual user load, CPU climbs to a high percentage and remains. To recover, the application pool must be restarted, but after doing so, CPU again climbs to a high level.
Tools
- Debug Diagnostics (DebugDiag)
- Performance Monitor (Perfmon)
Data collection
The first thing you should do when you encounter high CPU usage issues is to determine the process that is consuming CPU. You can use Processes tab in Task Manager to do this. Make sure that you select the Show processes from all users checkbox. The following image shows this box checked and shows the w3wp.exe process (the process that hosts an IIS application pool) consuming a high level of CPU.

You can also use Performance Monitor to determine what process is using CPU. For more information on using Performance Monitor, see Analyzing performance data.
Tip
If you need to identify which application pool is associated with a particular w3wp.exe process, open an Administrative Command Prompt, switch into the %windir%\System32\inetsrv folder cd %windir%\System32\inetsrv and run appcmd list wp. This will show the process identifier (PID) of the w3wp.exe process in quotes. You can match that PID with the PID available in Task Manager.
Once you have confirmed that a w3wp.exe process is experiencing high CPU, you will need to collect the following information in order to determine what is causing the problem:
- A Performance Monitor data collector set.
- A user-mode memory dump of the w3wp.exe process.
Both of these will need to be collected during the high CPU event.
Collecting a Performance Monitor data collector set
Performance Monitor data is often critical in determining the cause of high CPU issues. It can also be extremely helpful in getting a "big picture" view of how your application performs.
Perfmon data can be viewed in real-time or it can be collected in a data collector set that can be reviewed later. For troubleshooting a high CPU issue, we need to collect a data collector set. To create a data collector set for troubleshooting high CPU, follow these steps.
- Open Administrative Tools from the Windows Control Panel.
- Double-click on Performance Monitor.
- Expand the Data Collector Sets node.
- Right-click on User Defined and select New -> Data Collector Set.
- Enter High CPU as the name of the data collector set.
- Select Create Manually (Advanced).
- Select Next.
- Select Create Data Logs.
- Select the Performance Counter checkbox.
- Select Next.
- Select Add. If your application is not an ASP.NET application, proceed to Step 19.
- Scroll to the top of the list of counters and select .NET CLR Memory.
- In the list of instances, select <all instances>.
- Select Add to add the counters to the list of added counters.
- Select ASP.NET from the list of counters, and then select Add.
- Select ASP.NET Applications from the list of counters.
- Select <all instances> from the list of instances.
- Select Add.
- Expand Process from the list of counters. (Make sure you expand Process and not Processor.)
- Select % Processor Time from the Process object.
- Select <all instances> from the list of instances.
- Select Add.
- Expand Thread from the list of counters.
- Select % Processor Time from the Thread object.
- Select <all instances> from the list of instances.
- Select Add.
- Select ID Thread from the list of instances.
- Select Add.
Your dialog should now look like the following image.

Select OK -> Next. Make note of where the data collector set is being saved. (You can change this location if you need to.) Then select Finish.
The data collector set is not yet running. To start it, right-click on High CPU under the User Defined node and select Start from the menu.
Creating a Debug Diagnostics rule
The easiest way to collect user-mode process dumps when a high CPU condition occurs is to use Debug Diagnostics.
Download DebugDiag, install it on your server and run it. (You'll find it on the Start menu after the installation.) When you run DebugDiag, it will display the Select Rule Type dialog. Follow these steps to create a crash rule for your application pool:
- Select Performance -> Next.
- Select Performance Counters -> Next.
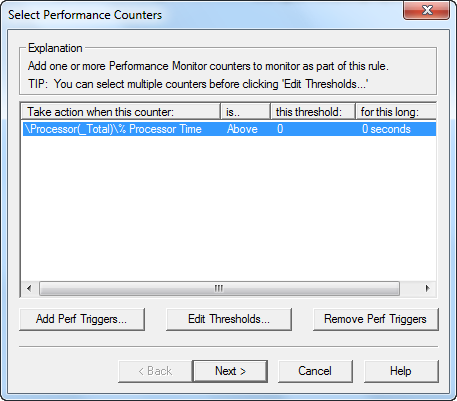
- Select Add Perf Triggers.
- Expand the Processor (not the Process) object and select % Processor Time. Note that if you are on Windows Server 2008 R2 and you have more than 64 processors, choose the Processor Information object instead of the Processor object.
- In the list of instances, select _Total.
- Select Add -> OK.
- Select the newly added trigger, and then select Edit Thresholds.

- Select Above in the dropdown.
- Change the threshold to 80.
- Enter 20 for the number of seconds. (You can adjust this value if needed, but be careful not to specify a small number of seconds in order to prevent false triggers.)
- Select OK.
- Select Next.
- Select Add Dump Target.
- Select Web Application Pool from the dropdown.
- Select your application pool from the list of app pools.
- Select OK.
- Select Next.
- Select Next again.
- Enter a name for your rule if you wish and make note of the location where the dumps will be saved. You can change this location if desired.
- Select Next.
- Select Activate the Rule Now, and then select Finish.
Tip
You can create dumps of multiple application pools by adding multiple dump targets using the same technique used in steps 13-15.
This rule will create 11 dump files. The first 10 will be "mini dumps" which will be fairly small in size. The final dump will be a dump with full memory, and that dumps will be much larger.
Once the high CPU problem has occurred, you will want to stop the Perfmon data collector set from collecting data. To do that, right-click on the High CPU data collector set listed under the User Defined node and select Stop.
Data analysis
After the high CPU event, you will have two sets of data to review; the Perfmon data collector set and the memory dumps. Let's begin by reviewing the Perfmon data.
Analyzing performance data
To review the Perfmon data for your issue, right-click on the High CPU data collector set listed under the User Defined node and select Latest Report. You'll see a report similar to the following screenshot.

The first thing is to remove all of the current counters so that you can add explicit ones that you want to review. Select the first counter in the list. Then scroll to the bottom of the list and select on the last counter while holding the SHIFT key. Once you've selected all counters, press Delete key to remove them.
Now add the Process / % Processor Time counter with these steps:
- Right-click anywhere in the right pane of Perfmon and select Add Counters.
- Expand the Process object.
- Select % Processor Time from the list.
- Select <all instances> from the instance list.
- Select Add.
- Select OK.
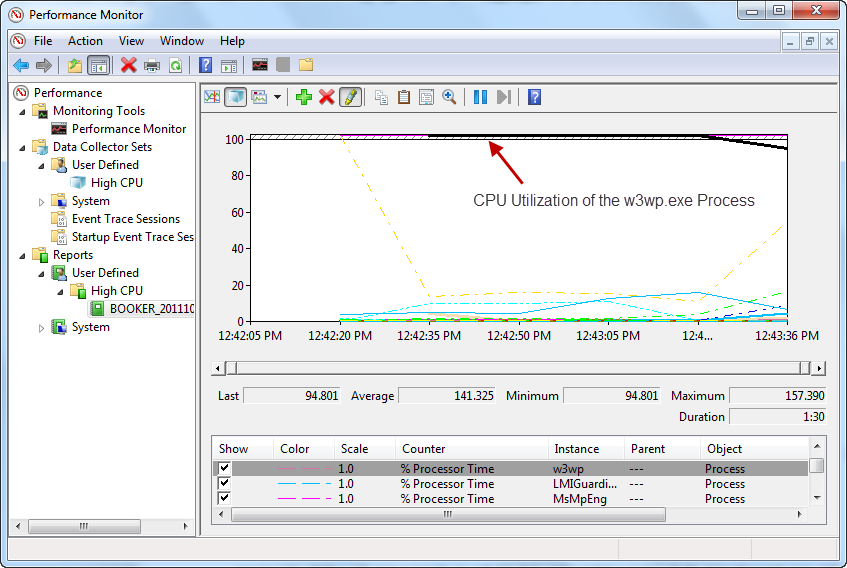
You will now have a display that shows a graph of processor time used by each process on the computer during the time that the data collector set was running. The easiest way to isolate which process was using the highest level of CPU is to enable the highlight feature of Perfmon.
To do that, select the first counter in the list and then press Ctrl + H. After you've done this, the selected process will show as a bolded black line on the graph.
Use the down arrow on your keyboard to move down through the list of processes until you find the process that shows the most CPU usage. In the following screenshot, you can clearly see that the w3wp.exe process was using a large amount of CPU on the machine. This confirms that the IIS application pool is causing high CPU utilization on the computer.

Tip
Perfmon can be very useful in determining performance problems in your application. The data collected in the Perfmon log can show you how many requests are executing (using the ASP.NET and ASP.NET Applications objects) and can also show you other important performance data about how your application is performing.
To get to the root of what is causing the high CPU problem, let's review the dumps that were created using DebugDiag.
Dump analysis with DebugDiag
DebugDiag has the ability to recognize many problems by doing an automated dump analysis. For this particular issue, DebugDiag's Performance Analyzers are well-suited to helping to identify the root cause of the high CPU issue. To use the analyzer, follow these steps
- Select the Advanced Analysis tab in DebugDiag.
- Select the Performance Analyzers.
- Select Add Data Files.
- Browser to the location where the dumps were created. By default, this will be a subfolder of the C:\Program Files\DebugDiag\Logs folder.
- Select one of the dumps and then press Ctrl + A to select all of the dumps in that folder.
- Select Open.
- Select Start Analysis.
DebugDiag takes a few minutes to parse through the dumps and provide an analysis. When it completes the analysis, you see a page similar to that shown in the following image.

Notice that the top of the report tells that high CPU was detected. In the right column, you'll see recommendations which include a link to the top 7 threads by average CPU time. Select that link and you'll see information about what those top CPU consumers were doing. For example, the following screenshot shows what those threads are doing in my application.

In this sample, the default.aspx page in the FastApp application is running. If you look further down the call stack (at the bottom of the page), you can see that this thread is doing string concatenation. (Notice the call to System.String.Concat on the call stack.) If you analyze the other top CPU threads, you see the same pattern.
The next step is to review the Page_Load event in the default.aspx page of the FastApp application. When I do that, I find the following code.
htmlTable += "<table>";
for (int x = 0; x < 5000; x++)
{
htmlTable += "<tr>" + "<td>" + "Cell A" + x.ToString() + "</td>";
    htmlTable += "<td>" + "Cell B" + x.ToString() + "</td>" + "</tr>";
}
htmlTable += "</table>";
This kind of code will definitely cause high CPU.
Conclusion
By using Perfmon and DebugDiag, you can easily collect data that can be helpful in determining the cause of high CPU in application pools. If you are unable to find the root cause using these techniques, you can contact Microsoft support for further assistance. Microsoft support engineers can assist you with determining the cause of your issue. By having the Perfmon data and dumps ready when you open a case, you will dramatically reduce the amount of time necessary for the engineers to assist you.