Note
Access to this page requires authorization. You can try signing in or changing directories.
Access to this page requires authorization. You can try changing directories.
Important
Effective May 1, 2025, Azure AD B2C will no longer be available to purchase for new customers. Learn more in our FAQ.
Before you begin, use the Choose a policy type selector at the top of this page to choose the type of policy you’re setting up. Azure Active Directory B2C offers two methods to define how users interact with your applications: through predefined user flows or through fully configurable custom policies. The steps required in this article are different for each method.
This feature is available only for custom policies. For setup steps, select Custom policy in the preceding selector.
Note
This feature is in public preview.
This article provides steps for collecting logs from Active Directory B2C (Azure AD B2C) so that you can diagnose problems with your custom policies. Application Insights provides a way to diagnose exceptions and visualize application performance issues. Azure AD B2C includes a feature for sending data to Application Insights.
The detailed activity logs described here should be enabled ONLY during the development of your custom policies.
Warning
Do not set the DeploymentMode to Development in production environments. Logs collect all claims sent to and from identity providers. You as the developer assume responsibility for any personal data collected in your Application Insights logs. These detailed logs are collected only when the policy is placed in DEVELOPER MODE.
Set up Application Insights
If you don't already have one, create an instance of Application Insights in your subscription.
Tip
A single instance of Application Insights can be used for multiple Azure AD B2C tenants. Then in your query, you can filter by the tenant, or policy name. For more information, see the logs in Application Insights samples.
To use an existing instance of Application Insights in your subscription, follow these steps:
- Sign in to the Azure portal.
- Make sure you're using the Microsoft Entra directory that has your Azure subscription, and not your Azure AD B2C directory. Select the Directories + subscriptions icon in the portal toolbar.
- On the Portal settings | Directories + subscriptions page, find your Microsoft Entra directory in the Directory name list, and then select Switch.
- Open the Application Insights resource that you created earlier.
- On the Overview page, and record the Connection String
To create an instance of Application Insights in your subscription, follow these steps:
- Sign in to the Azure portal.
- Make sure you're using the Microsoft Entra directory that has your Azure subscription, and not your Azure AD B2C directory. Select the Directories + subscriptions icon in the portal toolbar.
- On the Portal settings | Directories + subscriptions page, find your Microsoft Entra directory in the Directory name list, and then select Switch.
- Select Create a resource in the left-hand navigation menu.
- Search for and select Application Insights, then select Create.
- Complete the form, select Review + create, and then select Create.
- Once the deployment completes, select Go to resource.
- Under Configure in Application Insights menu, select Properties.
- Record the Connection String for use in a later step.
Configure the custom policy
Open the relying party (RP) file, for example SignUpOrSignin.xml.
Add the following attributes to the
<TrustFrameworkPolicy>element:DeploymentMode="Development" UserJourneyRecorderEndpoint="urn:journeyrecorder:applicationinsights"If it doesn't already exist, add a
<UserJourneyBehaviors>child node to the<RelyingParty>node. It must be located after<DefaultUserJourney ReferenceId="UserJourney Id" from your extensions policy, or equivalent (for example:SignUpOrSigninWithAAD" />. See RelyingParty schema reference for a complete order of the RelyingParty child elements.Add the following node as a child of the
<UserJourneyBehaviors>element. Make sure to replace{Your Application Insights Key}with the Application Insights Connection String that you recorded earlier.<JourneyInsights TelemetryEngine="ApplicationInsights" ConnectionString="{Your Application Insights ConnectionString}" DeveloperMode="true" ClientEnabled="false" ServerEnabled="true" TelemetryVersion="1.0.0" />DeveloperMode="true"tells ApplicationInsights to expedite the telemetry through the processing pipeline. Good for development, but constrained at high volumes. In production, set theDeveloperModetofalse.ClientEnabled="true"sends the ApplicationInsights client-side script for tracking page view and client-side errors. You can view this in the browserTimings table in the Application Insights portal. By settingClientEnabled= "true", you add Application Insights to your page script and you get timings of page loads and AJAX calls, counts, details of browser exceptions and AJAX failures, and user and session counts. This field is optional, and is set tofalseby default.ServerEnabled="true"sends the existing UserJourneyRecorder JSON as a custom event to Application Insights.
For example:
<TrustFrameworkPolicy
  ...
  TenantId="fabrikamb2c.onmicrosoft.com"
  PolicyId="SignUpOrSignInWithAAD"
  DeploymentMode="Development"
  UserJourneyRecorderEndpoint="urn:journeyrecorder:applicationinsights"
>
...
<RelyingParty>
  <DefaultUserJourney ReferenceId="UserJourney ID from your extensions policy, or equivalent (for example: SignUpOrSigninWithAzureAD)" />
  <Endpoints>
     <!--points to refresh token journey when app makes refresh token request-->
     <Endpoint Id="Token" UserJourneyReferenceId="RedeemRefreshToken" />
  </Endpoints>
  <UserJourneyBehaviors>
    <JourneyInsights TelemetryEngine="ApplicationInsights" ConnectionString="{Your Application Insights ConnectionString}" DeveloperMode="true" ClientEnabled="false" ServerEnabled="true" TelemetryVersion="1.0.0" />
  </UserJourneyBehaviors>
  ...
</TrustFrameworkPolicy>
Upload the policy.
See the logs in Application Insights
There's a short delay, typically less than five minutes, before you can see new logs in Application Insights.
- Open the Application Insights resource that you created in the Azure portal.
- On the Overview page, select Logs.
- Open a new tab in Application Insights.
Here's a list of queries you can use to see the logs:
| Query | Description |
|---|---|
traces |
Get all of the logs generated by Azure AD B2C |
traces | where timestamp > ago(1d) |
Get all of the logs generated by Azure AD B2C for the last day. |
traces | where message contains "exception" | where timestamp > ago(2h) |
Get all of the logs with errors from the last two hours. |
traces | where customDimensions.Tenant == "contoso.onmicrosoft.com" and customDimensions.UserJourney == "b2c_1a_signinandup" |
Get all of the logs generated by Azure AD B2C contoso.onmicrosoft.com tenant, and user journey is b2c_1a_signinandup. |
traces | where customDimensions.CorrelationId == "aaaa0000-bb11-2222-33cc-444444dddddd" |
Get all of the logs generated by Azure AD B2C for a correlation ID. Replace the correlation ID with your correlation ID. |
The entries may be long. Export to CSV for a closer look.
For more information about querying, see Overview of log queries in Azure Monitor.
See the logs in VS Code extension
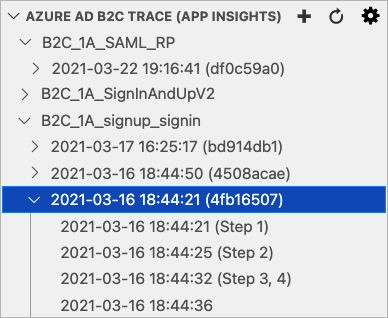
We recommend you to install the Azure AD B2C extension for VS Code. With the Azure AD B2C extension, the logs are organized for you by the policy name, correlation ID (the application insights presents the first digit of the correlation ID), and the log timestamp. This feature helps you to find the relevant log based on the local timestamp and see the user journey as executed by Azure AD B2C.
Note
The community has developed the VS Code extension to help people implementing and maintaining Azure AD B2C solutions. The extension is not supported by Microsoft, and is made available strictly as-is.
Set Application Insights API access
After you set up the Application Insights, and configure the custom policy, you need to get your Application Insights API ID, and create API Key. Both the API ID and API key are used by Azure AD B2C extension to read the Application Insights events (telemetries). Your API keys should be managed like passwords. Keep it secret.
Note
Application Insights Connection String that your create earlier is used by Azure AD B2C to send telemetries to Application Insights. You use the Connection String only in your Azure AD B2C policy, not in the VS Code extension.
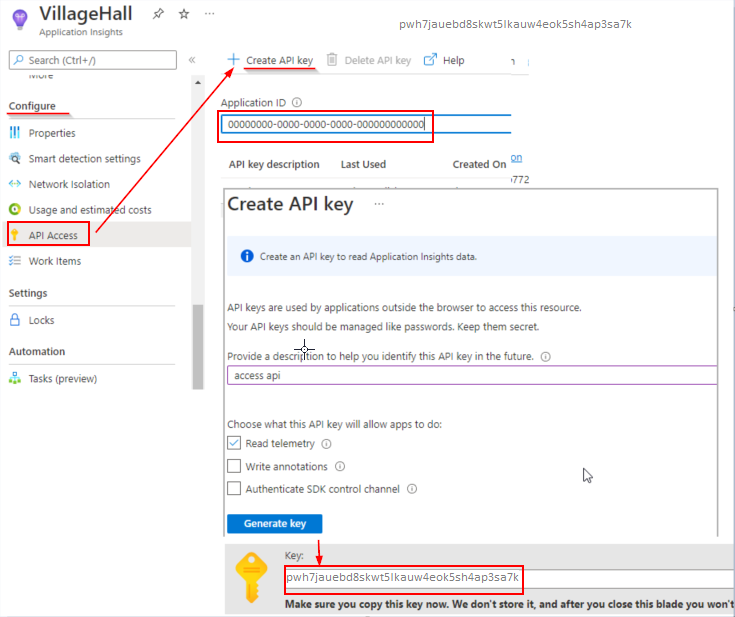
To get Application Insights ID and key:
In Azure portal, open the Application Insights resource for your application.
Select Configure, then select API Access.
Copy the Application ID
Select Create API Key
Check the Read telemetry box.
Copy the Key before closing the Create API key blade and save it somewhere secure. If you lose the key, you need to create another.
Set up Azure AD B2C VS Code extension
Now that you have Azure Application insights API ID and Key, you can configure the VS Code extension to read the logs. Azure AD B2C VS Code extension provides two scopes for settings:
- User Global Settings - Settings that apply globally to any instance of VS Code you open.
- Workspace Settings - Settings stored inside your workspace and only apply when the workspace is opened (using VS Code open folder).
From the Azure AD B2C Trace explorer, click on the Settings icon.
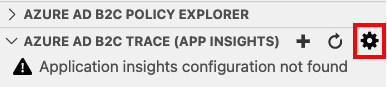
Provide the Azure Application Insights ID and key.
Click Save
After you save the settings, the Application insights logs appear on the Azure AD B2C Trace (App Insights) window.
Configure Application Insights in Production
To improve your production environment performance and better user experience, it's important to configure your policy to ignore messages that are unimportant. You also need to make sure that you don't log Personally Identifiable Information (PII). Use the following configuration in production environments and no logs are sent to your application insights.
Set the
DeploymentModeattribute of the TrustFrameworkPolicy toProduction.<TrustFrameworkPolicy xmlns:xsi="http://www.w3.org/2001/XMLSchema-instance" xmlns:xsd="http://www.w3.org/2001/XMLSchema" xmlns="http://schemas.microsoft.com/online/cpim/schemas/2013/06" PolicySchemaVersion="0.3.0.0" TenantId="yourtenant.onmicrosoft.com" PolicyId="B2C_1A_signup_signin" PublicPolicyUri="http://yourtenant.onmicrosoft.com/B2C_1A_signup_signin" DeploymentMode="Production" UserJourneyRecorderEndpoint="urn:journeyrecorder:applicationinsights">Set the
DeveloperModeof the JourneyInsights tofalse.<UserJourneyBehaviors> <JourneyInsights TelemetryEngine="ApplicationInsights" ConnectionString="{Your Application Insights ConnectionString}" DeveloperMode="false" ClientEnabled="false" ServerEnabled="true" TelemetryVersion="1.0.0" /> </UserJourneyBehaviors>Upload and test your policy.
Next steps
- Learn how to troubleshoot Azure AD B2C custom policies