Hi,
How much RAM do you have on your box where you test this?
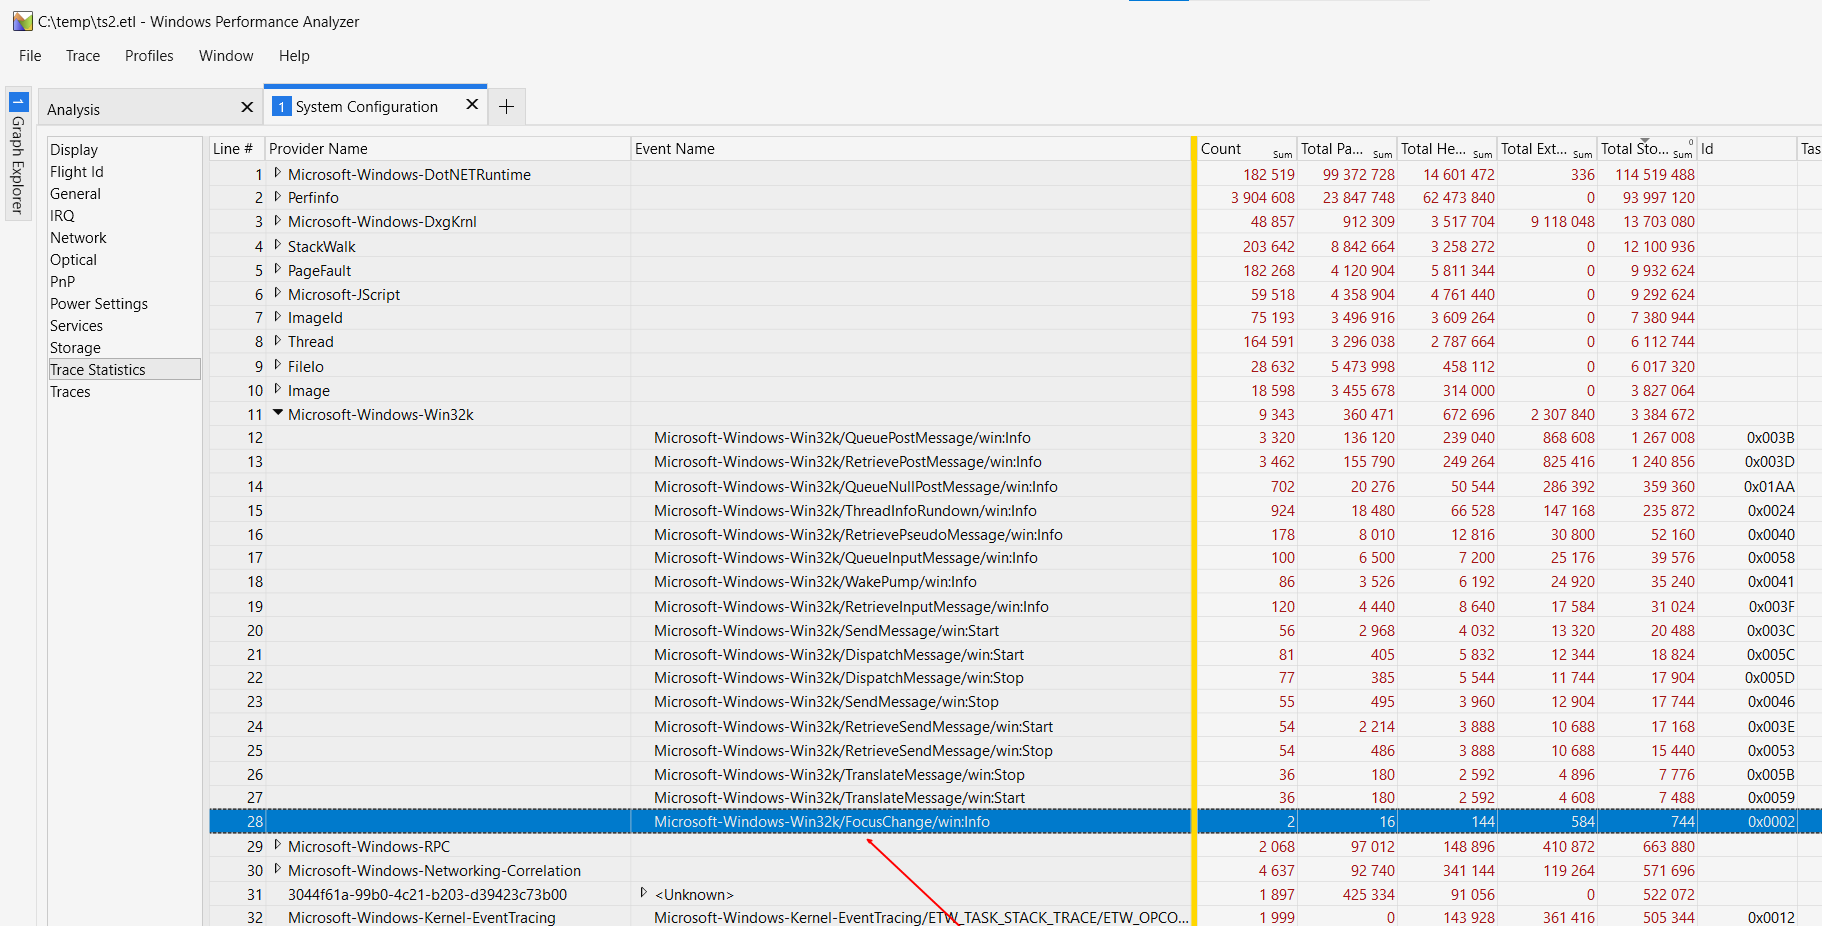
I tried on my 16Gb machine and looks like many event get overwritten at save in WPR_initiated_WprApp_WPR Event Collector session, that's why some event in Microsoft-Windows-Win32k provider are missed even they were captured:

Definition is correct:
xperf -loggers "WPR_initiated_WprApp_WPR Event Collector"
Logger Name : WPR_initiated_WprApp_WPR Event Collector
Logger Id : 2a
Logger Thread Id : 0000000000000000
Buffer Size : 1024
Maximum Buffers : 322
Minimum Buffers : 322
Number of Buffers : 322
Free Buffers : 306
Buffers Written : 0
Events Lost : 0
Log Buffers Lost : 0
Real Time Buffers Lost: 0
Flush Timer : 0
Age Limit : 0
Log File Mode : Buffered PersistOnHybridShutdown IndependentSession
Maximum File Size : 0
Log Filename :
Trace Flags : "Microsoft-Windows-WLAN-AutoConfig":0x200:0xff+"Microsoft-Antimalware-Engine":0xffffffffffffffff:0x5+"Microsoft-Windows-RPCSS":0xffffffffffffffff:0x4+"Microsoft-Windows-COMRuntime":0x3:0xff+"Microsoft-Windows-Search-Core":0xffffffffffffffff:0xff+e7ef96be-969f-414f-97d7-3ddb7b558ccc:0x2000:0xff+"Microsoft-Windows-D3D10Level9":0x1:0xff+"Microsoft-Windows-Immersive-Shell":0x100000:0x4+"Microsoft-WindowsPhone-CoreUIComponents":0x2000000:0xff+"Microsoft-Windows-Direct3D11":0xf:0x6+"Microsoft-Windows-DxgKrnl":0x277:0x5+"Microsoft-Windows-PDC":0x1000000000000:0x4+36b6f488-aad7-48c2-afe3-d4ec2c8b46fa:0x10000:0xff+"Microsoft-Windows-ProcessStateManager":0xffffffffffffffff:0xff+"Microsoft-Windows-Kernel-Power":0x1000000000004:0xff+"Microsoft-JScript":0x1:0xff+".NET Common Language Runtime":0x20098:0x5+"Microsoft-Antimalware-Service":0xffffffffffffffff:0xff+"DX":0x2f:0xff+"Microsoft-Antimalware-AMFilter":0xffffffffffffffff:0xff+"Microsoft-Windows-DXGI":0xf:0x6+"Microsoft-Windows-NCSI":0xffffffffffffffff:0xff+"Microsoft-Antimalware-RTP":0xffffffffffffffff:0xff+"Microsoft-Antimalware-Protection":0xffffffffffffffff:0xff+"Microsoft-Windows-Networking-Correlation":0xffffffffffffffff:0xff+b7a19fcd-15ba-41ba-a3d7-dc352d5f79ba:0xffffffffffffffff:0xff+"Microsoft-Windows-BootUX":0x1000000000000:0x4+"Microsoft-Windows-Kernel-EventTracing":0x40:0xf+"Microsoft-Windows-RPC":0xffffffffffffffff:0x4+a688ee40-d8d9-4736-b6f9-6b74935ba3b1:0xffff:0x5+"Microsoft-Windows-Win32k":0x402000:0xff+"Microsoft-Windows-Shell-Core":0x1000000000000:0x4+"Microsoft-Windows-BrokerInfrastructure":0x1:0xff
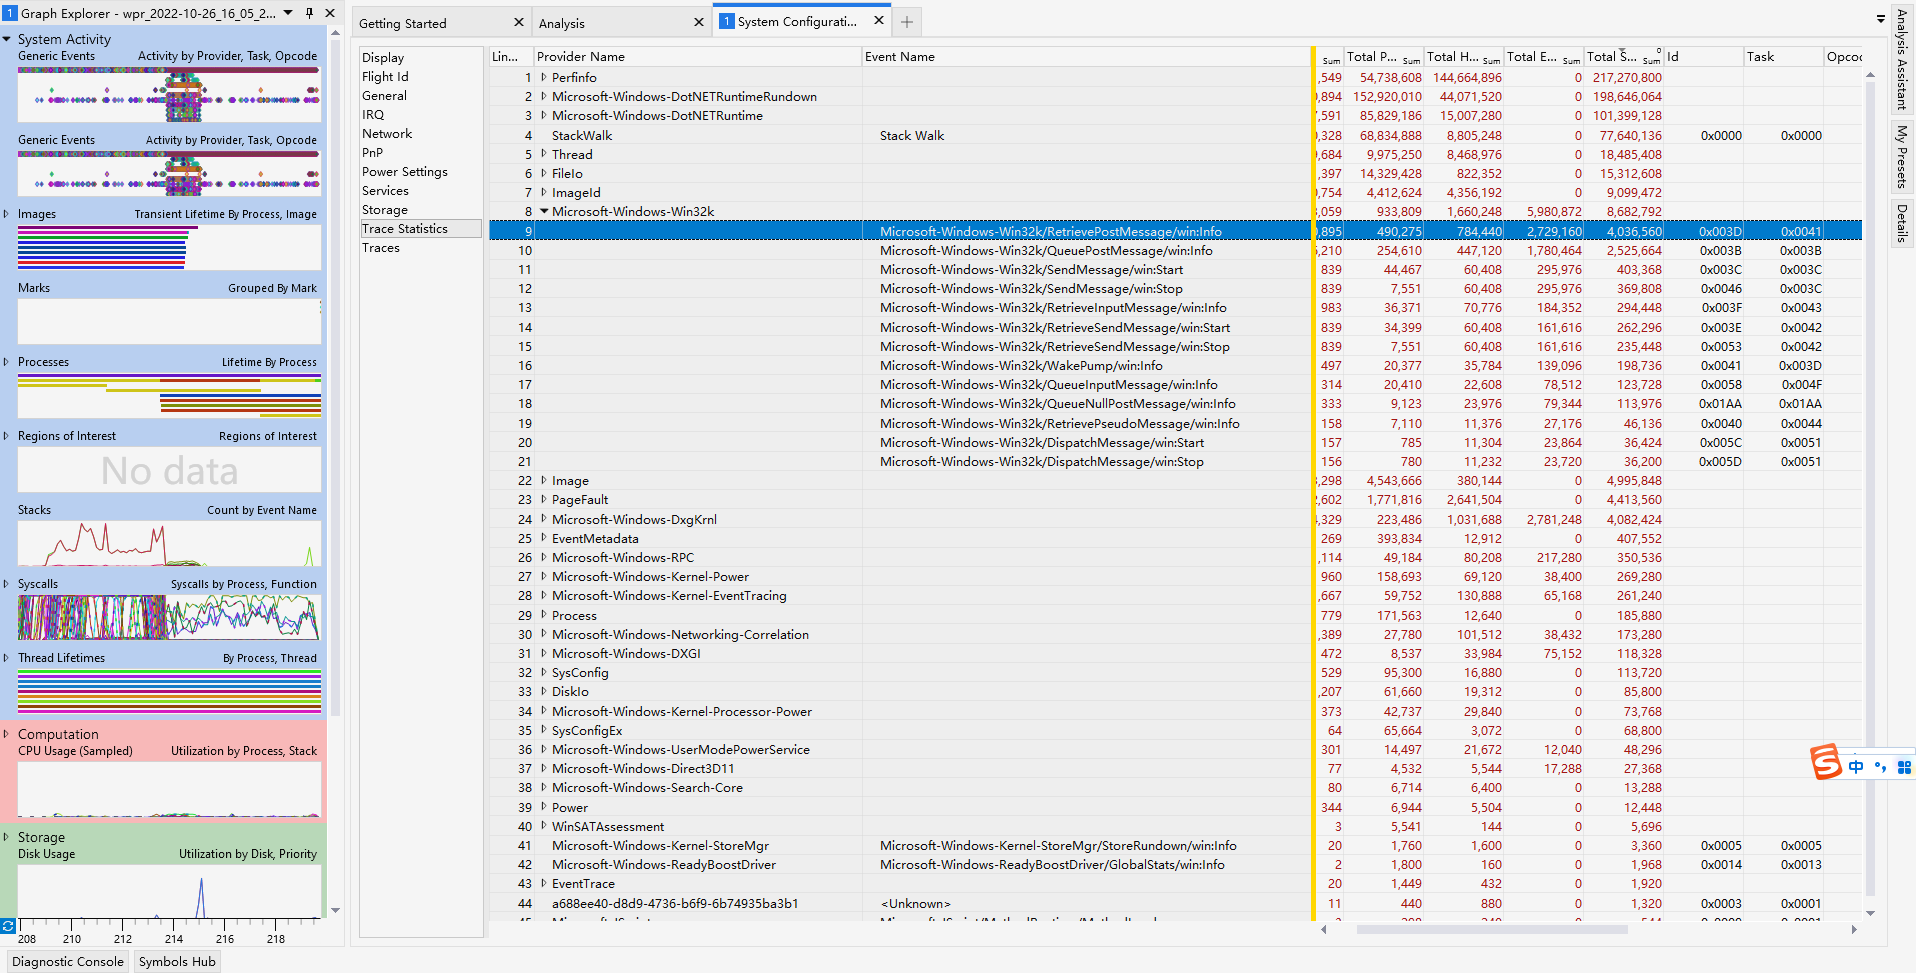
as you can see one of the top provider which consume most of the storage - a669021c-c450-4609-a035-5af59af4df18 : Microsoft-Windows-DotNETRuntimeRundown
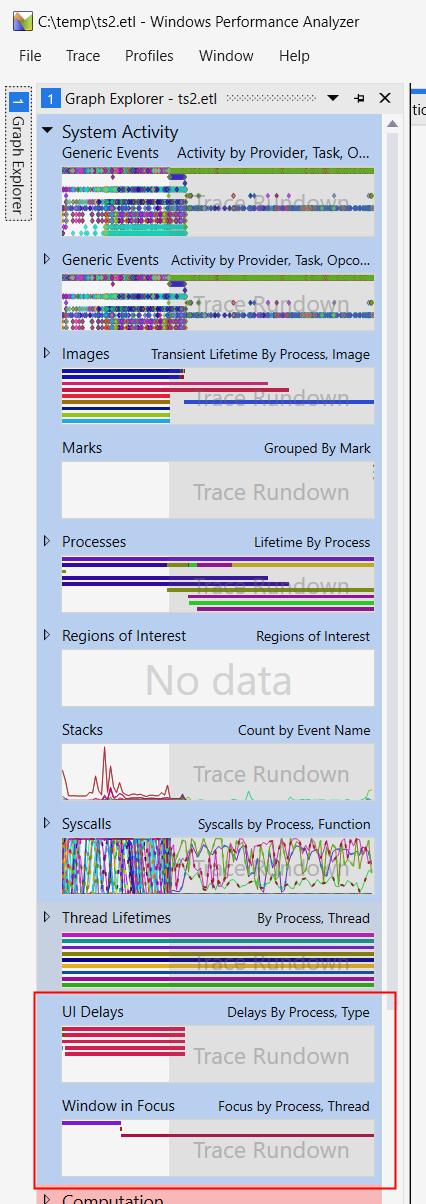
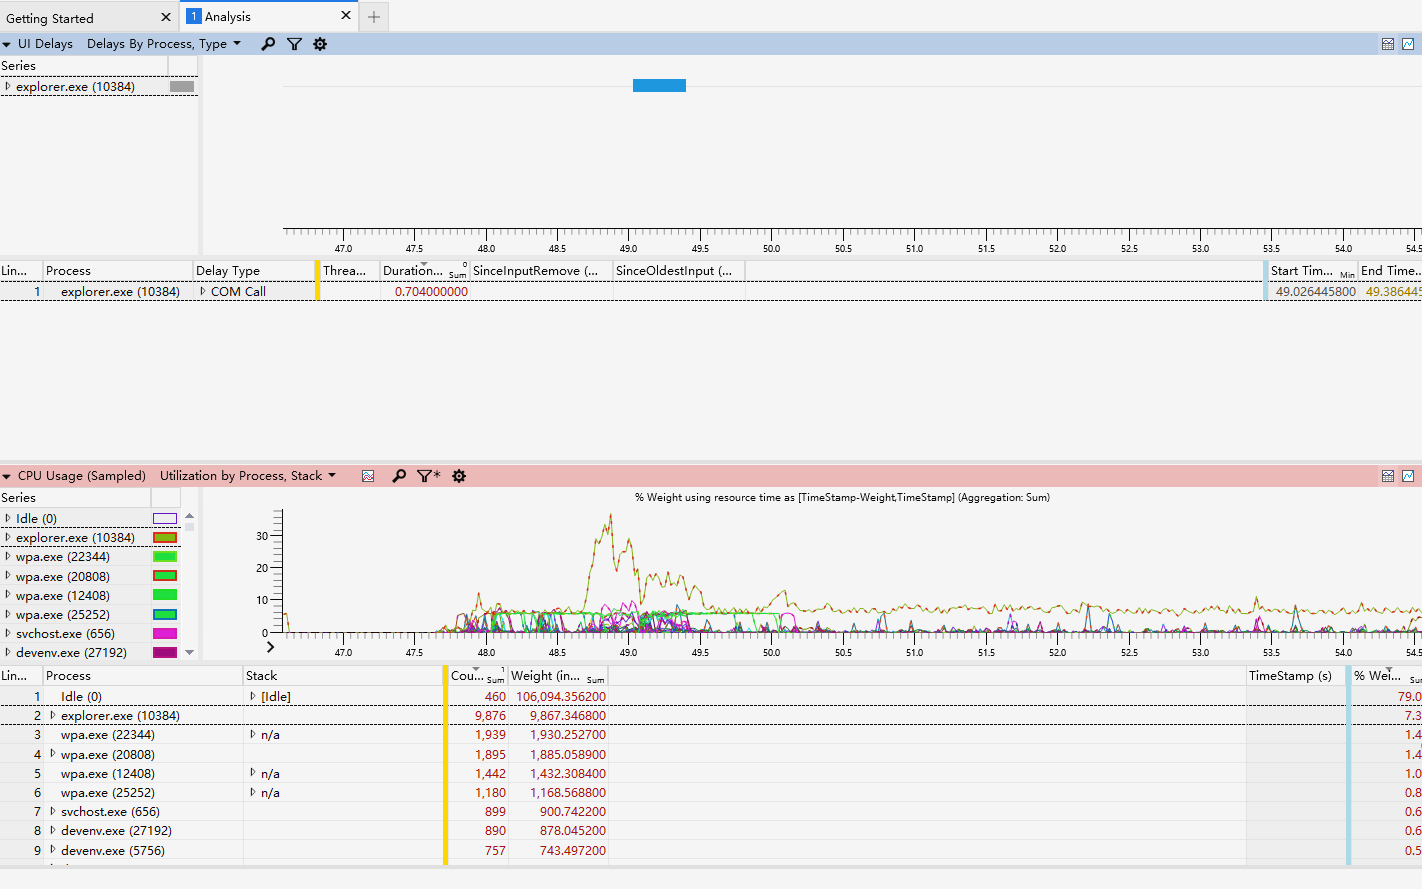
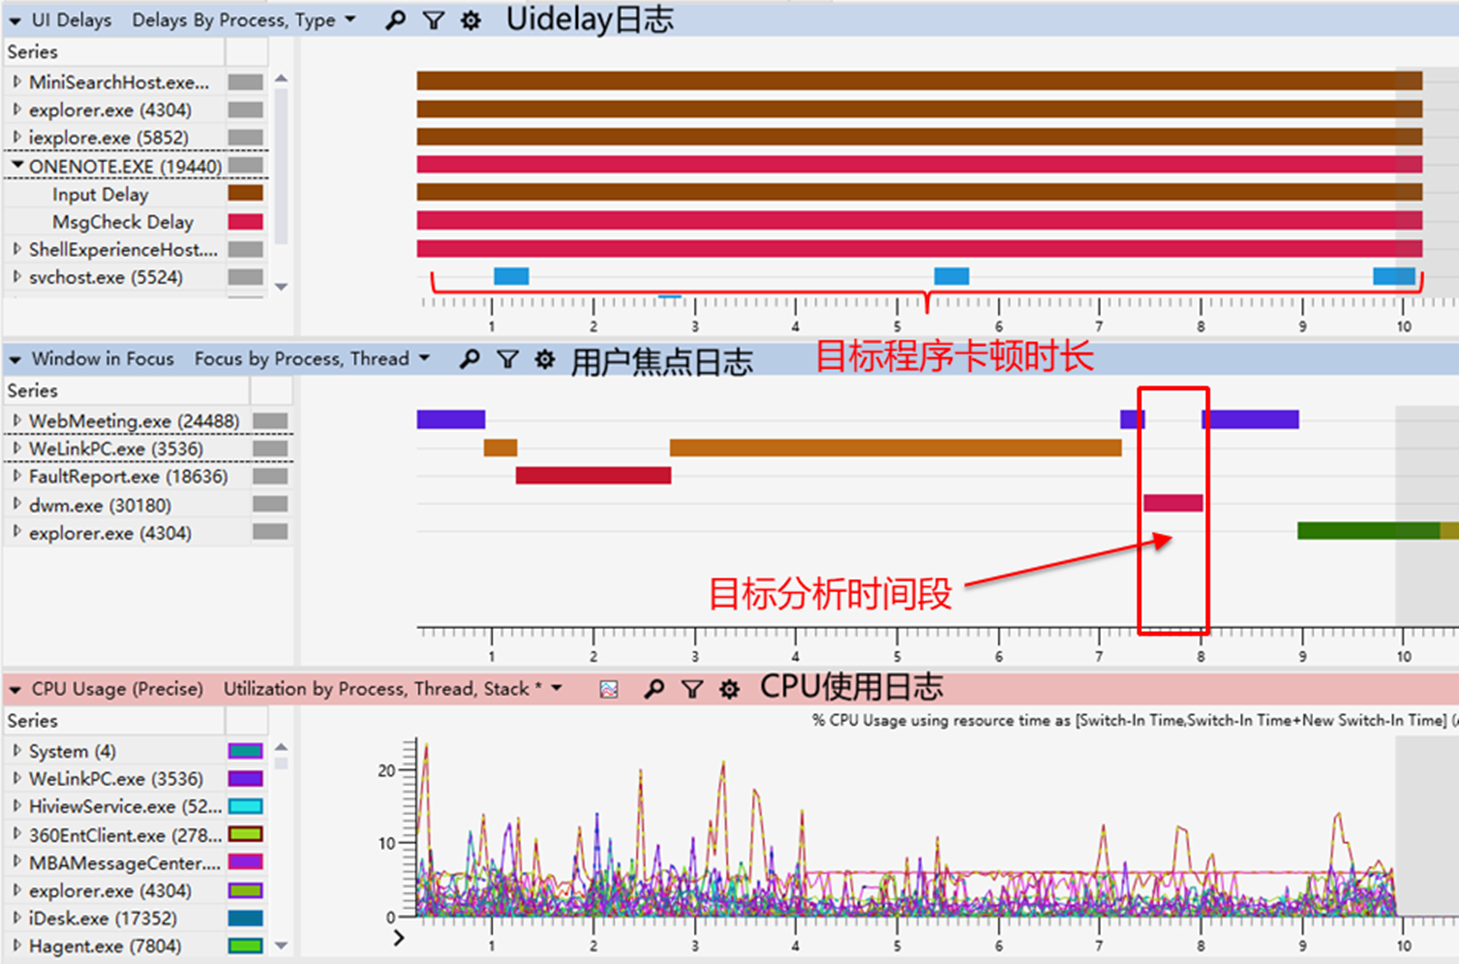
So I removed it from the profile and recollect data, now focus events are there and graph successfully built on top of them:
