Demo Reports
I want to share with you some reports that are using some of the new capabilities that are available for use with RDLC reports in Microsoft Dynamics NAV 2009.
We have prepared 4 reports which uses these capabilities:
Customer - Order Summary:
- Use of Conditional Formatting (Table colors)
- Use of Conditional Formatting (Colors in cells)
- Use of Charts
- Use of Hyperlink External(Click the Dynamics Logo in the bottom)
- Use of Embedding picture into report
Sales Pipeline:
- Use of Conditional Formatting (Icons, expand to see the icons)
- Use of Conditional Formatting (Table colors)
- Use of Visibility toggle
- Use of Hyperlink (Click the Dynamics Logo in the bottom)
- Use of Embedding picture into report
Quantity Explosion of BOM:
- Use of Visibility toggle. Notice that this is Visibility toggle for “Expand All” replaces the previous table shown. Look for Table 1 and Table 2 in Visual Studio to see how that is done.
- Use of Conditional Formatting (Table colors)
- Use of Drill Through to Page(Click “Where used?”)
- Use of Hyperlink (Click the Dynamics Logo in the bottom)
- Use of Embedding picture into report
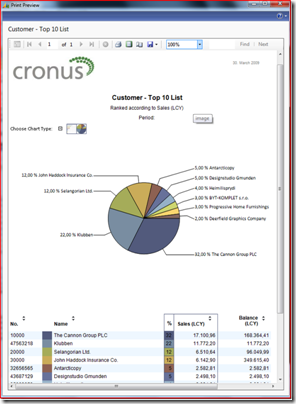
Customer - Top 10 List:
With Bar Chart
With Pie Chart
- Use of Visibility toggle. Now you can switch between Bar chart and Pie Chart in the Report Viewer and are not required to run the Request Page to make this change.
- Use of Percent
- Use of Point Labels
- Use of Hyperlink (Client the Dynamics Logo in the bottom)
- Use of Embedding picture into report
The reports can be downloaded from here.
Thanks,
Claus Lundstrøm, Program Manager, Microsoft Dynamics NAV
Comments
Anonymous
March 30, 2009
Thank you very much for sharing that Claus, excellent ideasAnonymous
April 05, 2009
Spring has come. You can tell it. Okay, to be totally honest, nature and weather, at least over hereAnonymous
May 12, 2009
Some of you have noticed that the Chart displayed in “Customer Order - Summary” contained a series label


