Publication of the PerfView performance analysis tool!
I know it is has been a while since my last posting, but long ago I decided that I would not write just to have something to write about but rather only when I had something I really something useful to say.
Well do have something really useful to say. For a long time I have wanted to give very specific advice about how to do various performance investigations, however, it was hard to do so as the only public tools Microsoft had for CPU investigation we had were Visual Studio's profiler (which until recently was available on for relatively expensive versions of Visual Studio), or XPERF (which did not have support for decoding symbolic information for managed code). For memory investigations we had CLRProfiler tool, however that tool had scaling problems (it really could not handle GB sized heaps which have become common), and I always found the node-arc visualization of the data to hard to use effectively.
Well, that all has changed. After months of work to get it published, I am happy to announce that a VERY useful performance tool called PerfView is now available at the Microsoft downloads center. You can download this tool for free at the PerfView Download site right now. I do alot of performance investigation on a daily basis, and this is the single most useful tool I have to do my job, do recommend you give it a spin.
To get started
- Goto the PerfView download site https://www.microsoft.com/download/en/details.aspx?id=28567 (if this does not work, go to the Microsoft download center and search for PerfView)
- Click the Download button (the download is a ZIP file), and open the ZIP file.
- Inside you will find the PerfView.exe file. You can simply double click on it to run it, or you can open some other local directory on your machine and copy it (drag an drop) there.
- You are then up and running. After OKing the EULA, you should get something that looks like this.
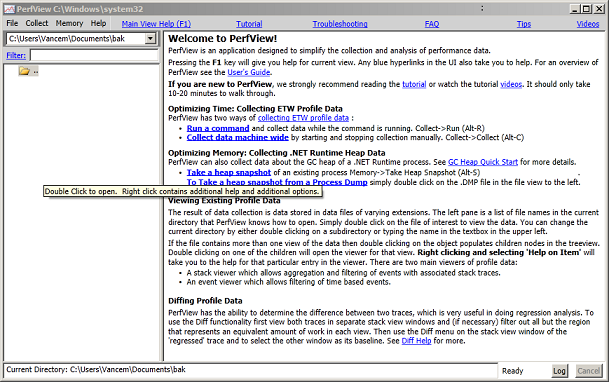
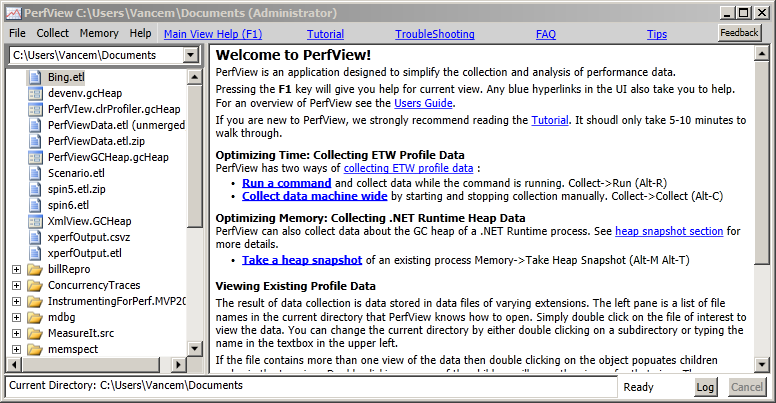
To give it a spin, simply click on the 'Tutorial' link on the main page (either at the top or in the 3rd paragraph in the body), and minutes later you are doing your first PerfView performance analysis.
Notable features of PerfView:
- Good help. We went to some trouble to put a lot of 'just in time' information into the tool. You can see even from the screenshot above there are a bunch of blue hyperlinks scattered in the UI. Each of these take you the relevant part of the user’s guide, and the user's guide is even more packed with hyperlinks to related information (there is also full text search). There are even videos of PerfView in use, however we are still in the process of getting these published externally, so for now you can use the videos (I will post soon when that works). Please take a look at the links at the top of the views, as they give you important 'perf theory' that you REALLY do need to understand to insure that don't misinterpret the data you collect.
- Super easy deployment. Simply copy the single EXE and run. It will work on any Vista+ Windows OS (Win2k8, Win7). This makes it easy to put PerfView on a USB drive or a network share, and take it wherever you need to to collect the data. It really can't get easier.
- Support for both CPU and Memory Investigations. PerfView is based on the same technology as the XPERF/WPR tool called ETW. In fact data generated by one two can be viewed in the other, so if you like XPERF you are more than welcome to use whichever tool you prefer. However for managed code expecially PerfView has some advantages. In particular PerfView allows you to take snapshots of the GC heap (even 50GB heaps), without interrupting the process (great for servers), to understand the memory performance of your application.
- Excellent grouping facilities. After you have investigated your 'trivial' performance problems (were 50%+ of your time is spent in a small amount of code), your profiles quickly become 'flat' and it is harder to find additional optimization opportunities. One reason it is hard is because your performance cost is 'scattered' among hundreds (or thousands), of 'helper' functions operating system routines, so that it is hard to find 'big' chunks of lost perf. The solution to this is to group functions together into logical groups (that perform some recognizable semantic action), so that you can highlight how much each semantic action is costing you. PerfView has the best facilities for doing this that I have ever seen in any performance tool, and it is the main reason why I use this tool over any other (once you have grouping, you can never go back to a tool without it).
- Drilling into feature. Performance investigations typically have two phases. In the first phase you are interested in grouping costs until you have a small number (< 10) of semantically relevant nodes that account for a majority of your cost. Once you have done this, you want to investigate each of these (now known to be very relevant), nodes in turn. PerfView has a feature called 'Drill Into' that lets you do just this. It allows you to identify a set of samples (a cost), and open a new viewer for JUST THOSE SAMPLES), which can then be grouped and filtered in new ways (typically removing some of the grouping to reveal one deeper level of abstraction), so you can understand that cost (and just that cost), in more detail. Super useful.
- Diffing. Tracking down regressions is a common operation for performance professionals, and so the ability to do a diff of two traces is an important feature. However, PerfView’s grouping features are even more valuable here, because when you compare two runs there are typically 'expected' differences (after all the builds did change), and you need a way of 'ignoring' differences that you understand, and don't care about. PerfView's grouping and drilling into features give you powerful ways of ignoring differences you don't care about and highlighting those you do care about. Again, no other tool I have ever used comes close to doing the job that PerfView does.
Now that the PerfView tool is public, you can expect to hear a lot more from me from my blog, as I expound more on performance best practices (now that there is no excuse for getting some data!).
So what you are waiting for? You should be downloading PerfView....
Vance
P.S: The goal of this (and subsequent) articles is to get people doing sucessful performance analsysis. You can use PerfView for this, but there are other good tools as well. In particular, the WPR.exe tool (the new tool by the XPERF team), released as part of the windows 8 //build conference, also handles symbolic information associated with managed code (e.g. you get stack traces with method names). You are also more then welcome to use this tool to do managed code analysis (and as mentioned, the data from WPR and PerfView is interchangable). See the Windows Performance Analsysis Center for more on that tool.
Comments
Anonymous
December 28, 2011
Tried to analyze dump with no luck. Error taking heap dump: System.ArgumentNullException: Value cannot be null. Parameter name: dacFilename at RealtimeMemDiag.DumpDataTarget.Create(String dacFilename) at GCHeapDumper.DumpHeapFromProcessDump(String processDumpFile, String outputFileName) at Program.Main(String[] args) Symbols are correct and set in environmentAnonymous
December 28, 2011
The comment has been removedAnonymous
December 28, 2011
Link you left for XPERF/WPR in section 3 of notes seems to be wrongAnonymous
December 29, 2011
The link listed under number 1. above is broken (but the one just above it labeled PerfView Download Site works).Anonymous
December 29, 2011
Trying to set the symbol path from the menu locks up the UI because the PerfView.StackViewer.StackWindow.UserOKWithSymbolServer does not work when called on the UI thread (it calls Dispatcher.BeginInvoke and then waits for the result with Thread.Sleep...).Anonymous
December 29, 2011
The comment has been removedAnonymous
December 31, 2011
I have fixed the links people complained about. Please let me know if they break again. tobi's problem with collecting data is actually compaining that there is already a ETW session running (you can only have a single Kernel ETW session running. The most common issue is that previous session was left running (although there is logic that is supposed to deal with this). Anyway, the work-around is to insure that all sessions are stopped by using the Collect -> Abort function and then try again. Pent's issue setting the symbol path is indeed because of some unfortunate code put in late in response to privacy concerns (basically asking you if you want to contact Microsoft symbol servers). It will be fixed, however, the simple work-around is to not set the symbol server path in the gui until AFTER you have done a 'Lookup Symbols' operation (which will force the prompt of whether you want to use the Microsoft symbol server).Anonymous
December 31, 2011
The workaround works for my problem. Thanks.Anonymous
January 01, 2012
I have tried only the GC Snapshot part. It can take GC dumps and diff them that is very good. But when I look what other commercial profilers do offer it is still light years behind. The most needed feature is to look into specific object instances to see the actual values of its members. I want to know how many objects this big list has and what the first 3 values are and I want to drill down further.... This is a must have feature for any memory profiler. The Visual Studio Profiler is so slow that I could download YourKit Profiler, install it, activate it, start the process again with the profiler, take two memory snapshots and diff them while Visual Studio is still analyzing my small NUnit process.... This brings me to the second point. The Memory profiler is quite slow when taking a dump and much slower when loading and diffing it. Commercial tools are much faster. This is not so much of an issue for small GC heap s (30MB) but if you have a real app gone wrong with hundreds of MB it will take forever to load.Anonymous
January 02, 2012
I noticed I overlooked 'SloNN' issue. When dumps are examined on machines that don't have the same version of the runtime as the machine where the dump was collected, you go down code paths that are relatively hard to test (you have to set up machines with different CLR versions). From the stack trace I was able to make a fix, however testing it properly will take longer. In the mean time, the work-around is insure that the same version of the runtime is on the machine that extracts the GCHeap as the one where the process dump was taken. An easy way to do this is to simply do the extraction on the machine where the dump was taken.Anonymous
January 04, 2012
Excellent tool, Vance. I'm able to analyze performance for my target application, however, PerfView is also collecting data from every other process running on my computer (even when I specify the target with Collect->Run). Is there a workaround for this? Thanks. -Robert.Anonymous
January 30, 2012
Is there a list of what all I need to have ngen'd when analyzing a 64 bit process on Windows 7? I ngen'd all my binaires for my process, but when I capture dumps I still get the stack broken error. The ngen command I ran is: for /r %i in (*.dll) do ngen install %i Do I need to ngen all the system binaries as well? (System.core, etc....)Anonymous
January 31, 2012
On windows 7, all DLLs that ship with the .NET Framework should already be NGENed. Thus you should not have to worry about those. It is your own code (your ASP.NET page, or your application), that is typically the issue. Also note that there are other reasons for broken stacks other than not having NGENed images. You can tell it is the NGEN issue because the first child of the 'BROKEN stack is a managed DLL and does not end in .ni.dll. Please see the docs for more information. (search for 'BROKEN'). Finally as mentioned int the docs, even if you have broken stacks, you typically can do alot of useful analysis.Anonymous
October 25, 2012
I have a situation similar to the one in your GC mem leak video: in my WPF app, I do an operation and close an item (call it TaskClipboard for clarity, that's the class name). I find that everytime I do that, the instance of TaskClipboard is not in fact destroyed: after N times doing this, N-1 instances of TaskClipboard exist that are not in visual tree, and have IsLoaded and IsVisible false. One instance has IsLoaded and IsVisible. Now a diff of GC heap with PerfView shows TaskClipboard with Inc % at 50%. When sorting on Inc%, objects below it are much less, like 2%, and those above are either app/MainWindow or some things contained in the TaskClipboard instances, so surely this is a good sign. But if I double-click the TaskClipboard row, there are only two children that show up: one is a FrameworkElement that is in the TaskClipboard, but it has very low Inc% (0.3%) so I'm thinking it is not the culprit; the other is a [Strong Handle] with almost the same metrics as the TaskClipboard row, so I'm thinking that's what is holding the extra instances alive. So the question is of course: how do I find out what is that [Strong Handle]?Anonymous
November 17, 2012
The comment has been removedAnonymous
November 25, 2014
I am trying to get hands on with PerfView I tried doing the "Tutorial.exe" but the CPU stack did not show me anything after the PerfView completed its processing. More ever in the Process Summary page in PerfView it shows me "Tutorial Process did nto live for the entire trace. In the log I see the ERROR: could not find any CPU in focus processes, using machine wide total. Helps appreciated to resolve this.Anonymous
November 25, 2014
Hmm, this is very surprising. If you copy your ETL.ZIP file that got generated to http://1drv.ms/1xoq5bU and send mail to vancem@microsoft.com I can take a look. You may also wish to try other programs besides the built in tutorial just to see if it is specific to that app.Anonymous
September 28, 2015
The comment has been removedAnonymous
September 28, 2015
Sounds like your machine is running with a special security configuration. Is that possible? Does PerfView work on more other machines where there is no group policy or other things that might have tightened security?Anonymous
September 28, 2015
I would imagine my company has done a special security configuration on these VM resources. The primary reason to try this VM is to get Admin access, something that has be removed from our local workstations, but available in the VM offering. I was hoping to be able to circumvent the hardening, but I'm not clear on which privilege it is trying to access at the point of exception.