Use Log Analytics to examine Application Gateway Logs
Once your Application Gateway is operational, you can enable logs to inspect the events that occur for your resource. For example, the Application Gateway Firewall logs give insight to what the Web Application Firewall (WAF) is evaluating, matching, and blocking. With Log Analytics, you can examine the data inside the firewall logs to give even more insights. For more information about log queries, see Overview of log queries in Azure Monitor.
In this article, we will look at the Web Application Firewall (WAF) logs. You can set up other Application Gateway logs in a similar way.
Prerequisites
- An Azure account with an active subscription is required. If you don't already have an account, you can create an account for free.
- An Azure Application Gateway WAK SKU. For more information, see Azure Web Application Firewall on Azure Application Gateway.
- A Log Analytics workspace. For more information about creating a Log Analytics workspace, see Create a Log Analytics workspace in the Azure portal.
Sending logs
To export your firewall logs into Log Analytics, see Diagnostic logs for Application Gateway. When you have the firewall logs in your Log Analytics workspace, you can view data, write queries, create visualizations, and add them to your portal dashboard.
Explore data with examples
When using AzureDiagnostics table, you can view the raw data in the firewall log by running the following query:
AzureDiagnostics
| where ResourceProvider == "MICROSOFT.NETWORK" and Category == "ApplicationGatewayFirewallLog"
| limit 10
This looks similar to the following query:

When using Resource-specific table, you can view the raw data in the firewall log by running the following query. To know about the resource-specific tables, visit Monitoring data reference.
AGWFirewallLogs
| limit 10
You can drill down into the data, and plot graphs or create visualizations from here. Here are some more examples of AzureDiagnostics queries that you can use.
Matched/Blocked requests by IP
AzureDiagnostics
| where ResourceProvider == "MICROSOFT.NETWORK" and Category == "ApplicationGatewayFirewallLog"
| summarize count() by clientIp_s, bin(TimeGenerated, 1m)
| render timechart
Matched/Blocked requests by URI
AzureDiagnostics
| where ResourceProvider == "MICROSOFT.NETWORK" and Category == "ApplicationGatewayFirewallLog"
| summarize count() by requestUri_s, bin(TimeGenerated, 1m)
| render timechart
Top matched rules
AzureDiagnostics
| where ResourceProvider == "MICROSOFT.NETWORK" and Category == "ApplicationGatewayFirewallLog"
| summarize count() by ruleId_s, bin(TimeGenerated, 1m)
| where count_ > 10
| render timechart
Top five matched rule groups
AzureDiagnostics
| where ResourceProvider == "MICROSOFT.NETWORK" and Category == "ApplicationGatewayFirewallLog"
| summarize Count=count() by details_file_s, action_s
| top 5 by Count desc
| render piechart
Add to your dashboard
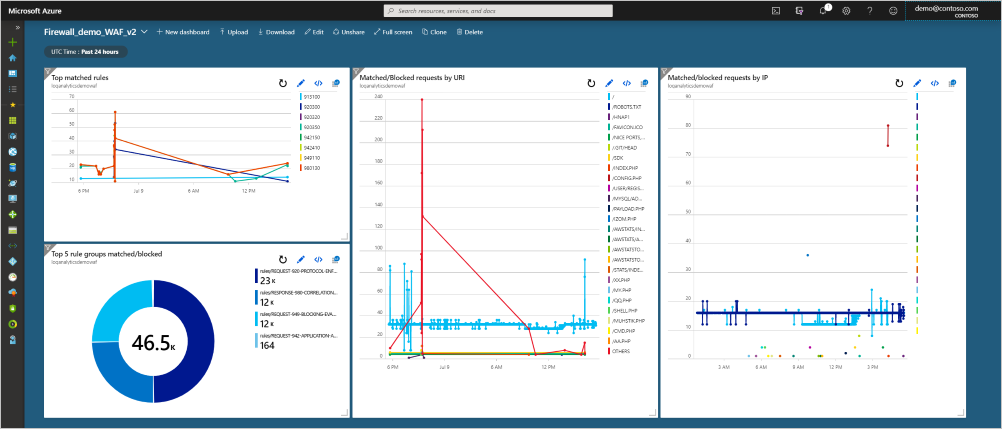
Once you create a query, you can add it to your dashboard. Select the Pin to dashboard in the top right of the log analytics workspace. With the previous four queries pinned to an example dashboard, this is the data you can see at a glance:
Next steps
Backend health, diagnostic logs, and metrics for Application Gateway