Create or edit an activity log, service health, or resource health alert rule
This article shows you how to create or edit an activity log, service health, or resource health alert rule in Azure Monitor. To learn more about alerts, see the alerts overview.
You create an alert rule by combining the resources to be monitored, the monitoring data from the resource, and the conditions that you want to trigger the alert. You can then define action groups and alert processing rules to determine what happens when an alert is triggered.
Alerts triggered by these alert rules contain a payload that uses the common alert schema.
Access the alert rule wizard in the Azure portal
There are multiple ways to create or edit an alert rule.
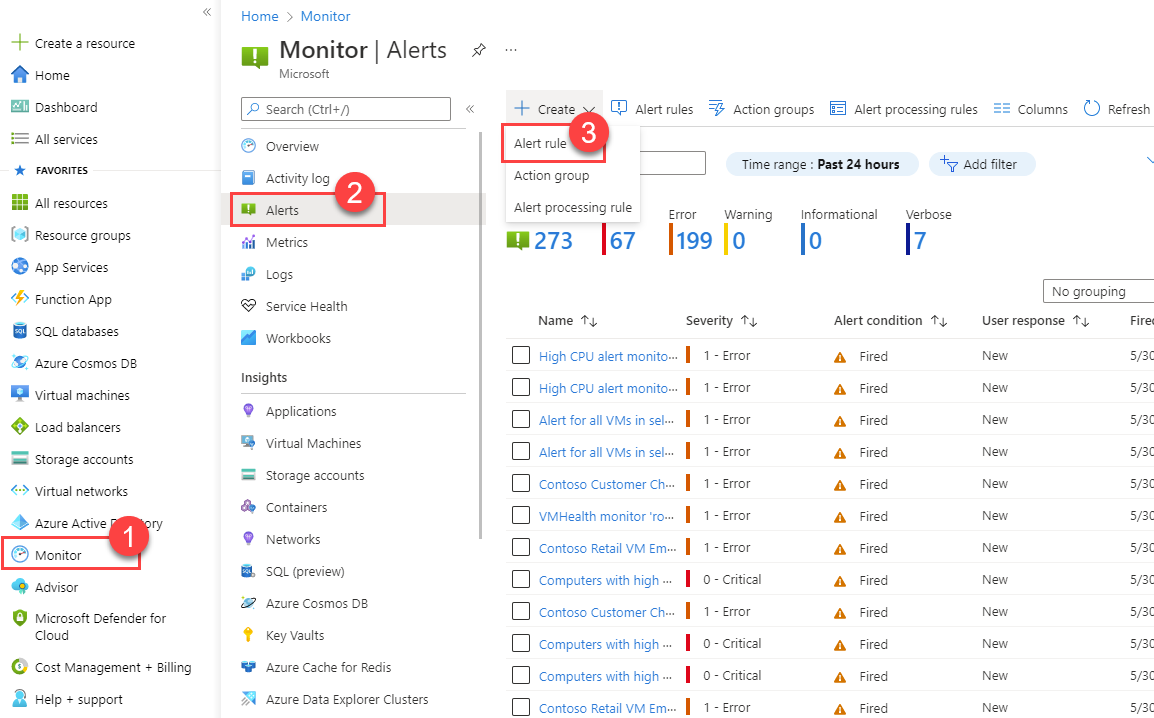
Create or edit an alert rule from the portal home page
- In the Azure portal, select Monitor.
- On the left pane, select Alerts.
- Select + Create > Alert rule.
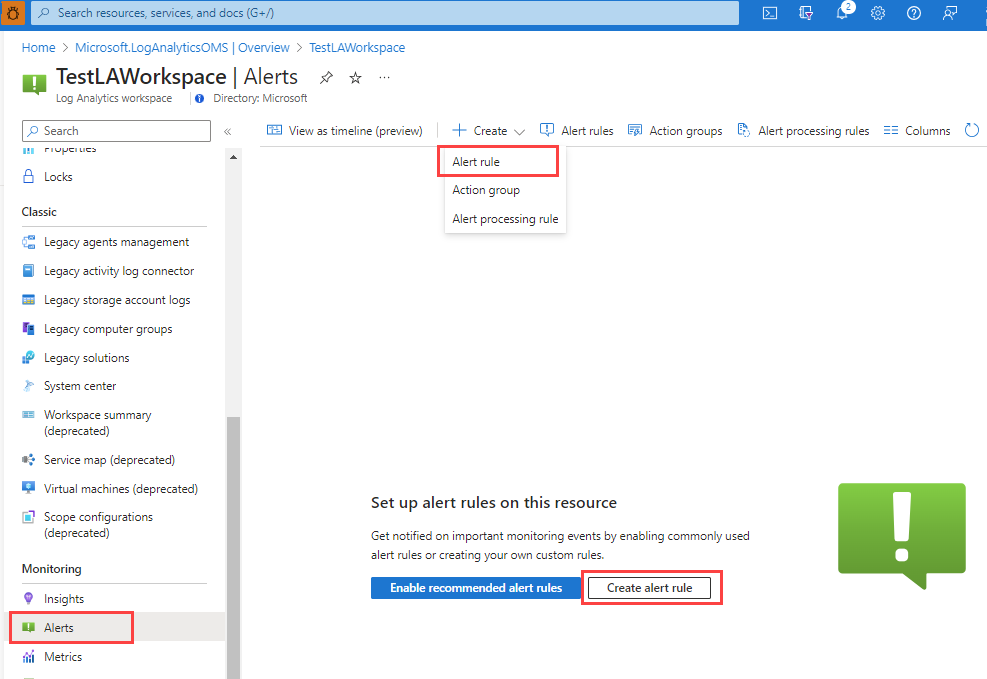
Create or edit an alert rule from a specific resource
- In the Azure portal, go to the resource.
- On the left pane, select Alerts.
- Select + Create > Alert rule.
Edit an existing alert rule
In the Azure portal, either from the home page or from a specific resource, select Alerts on the left pane.
Select Alert rules.
Select the alert rule you want to edit, and then select Edit.
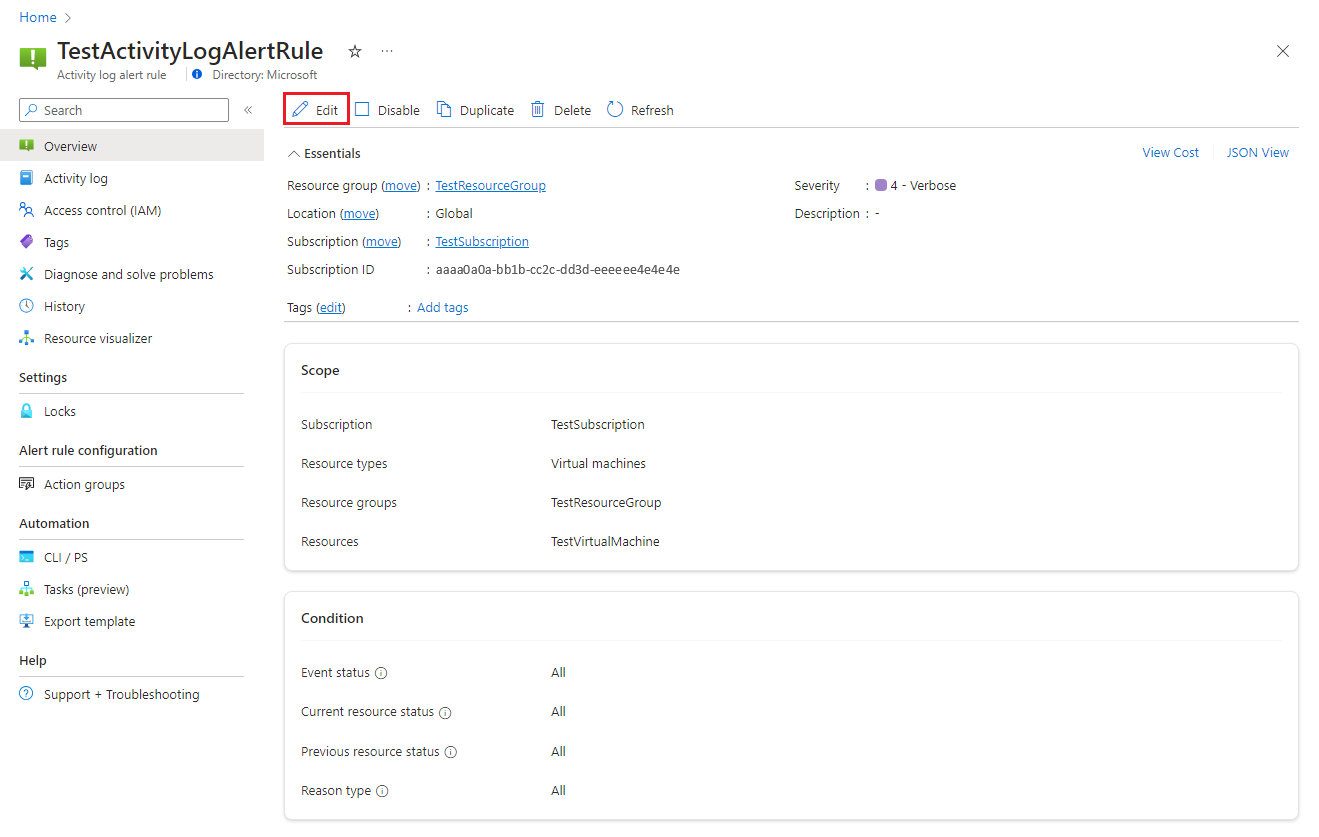
Select any of the tabs for the alert rule to edit the settings.
Configure the scope of the alert rule
On the Select a resource pane, set the scope for your alert rule. You can filter by subscription, resource type, or resource location.
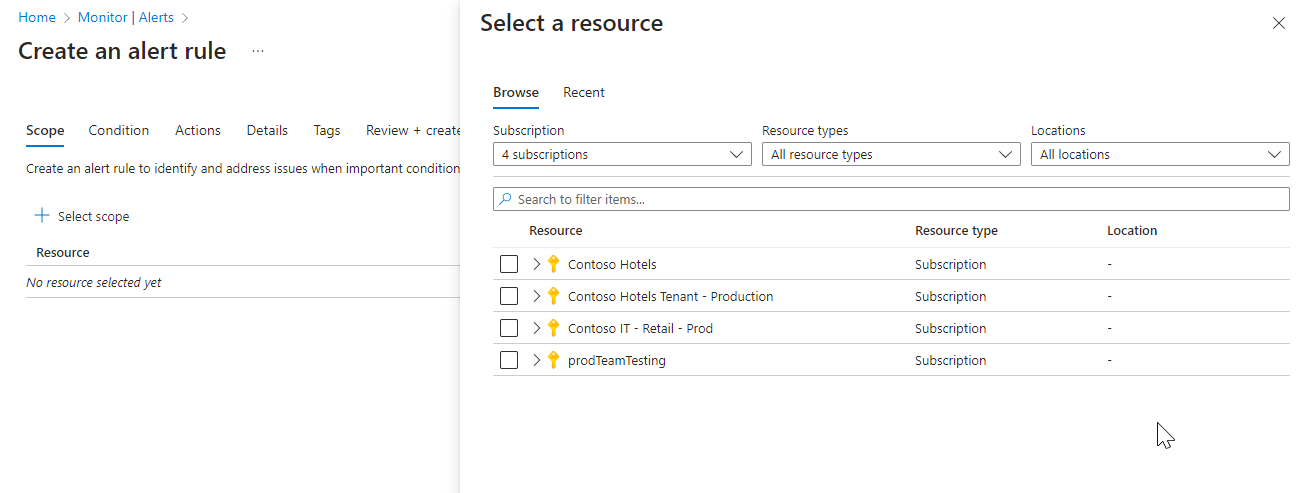
Select Apply.
Configure alert rule conditions
On the Condition tab, select Activity log, Resource health, or Service health. Or select See all signals if you want to choose a different signal for the condition.
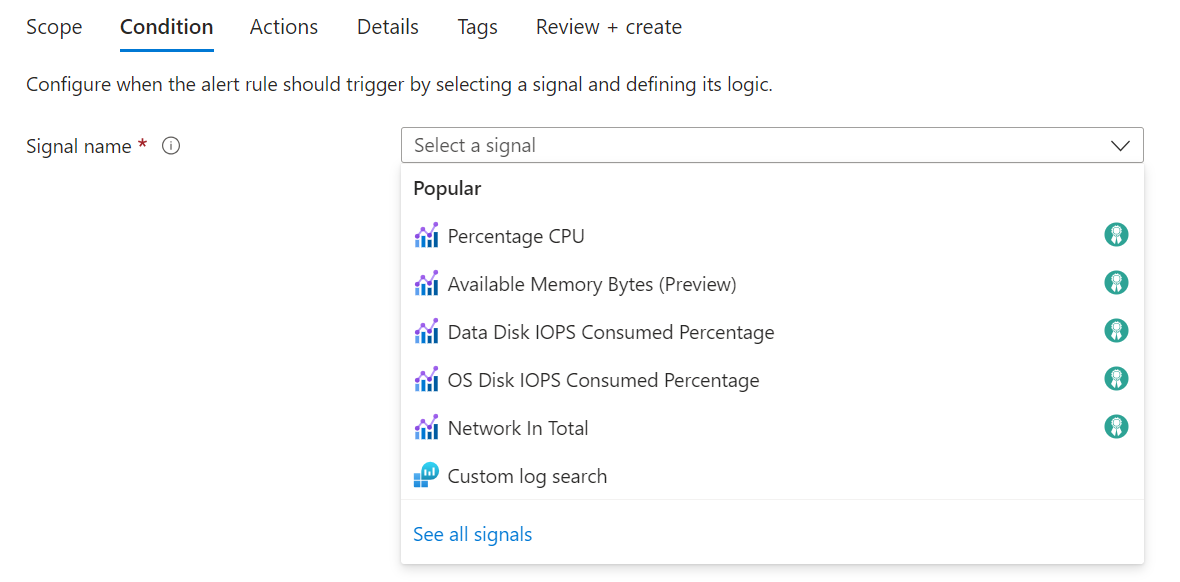
(Optional) If you selected See all signals in the previous step, use the Select a signal pane to search for the signal name or filter the list of signals. Filter by:
- Signal type: The type of alert rule that you're creating.
- Signal source: The service that sends the signal.
This table describes the available services for activity log alert rules:
Signal source Description Activity log – Policy The service that provides the policy-related activity log events. Activity log – Autoscale The service that provides the autoscale-related activity log events. Activity log – Security The service that provides the security-related activity log events. Resource health The service that provides the resource-level health status. Service health The service that provides the subscription-level health status. Select the signal name, and then select Apply.
On the Conditions pane, select the Chart period value.
The Preview chart shows the results of your selection.
In the Alert logic section, select values for each of these fields:
Field Description Event level Select the level of the events for this alert rule. Values are Critical, Error, Warning, Informational, Verbose, and All. Status Select the status levels for the alert. Event initiated by Select the user principal or service principal that initiated the event.
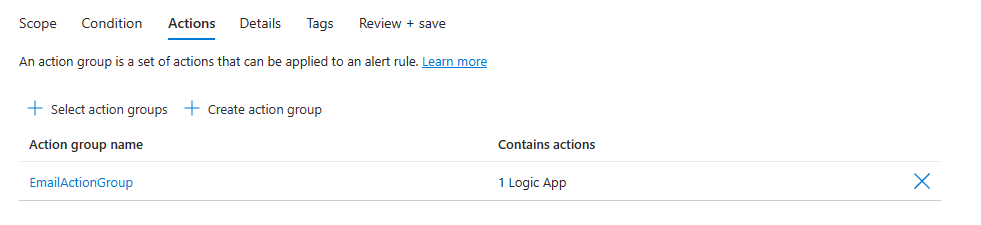
Configure alert rule actions
On the Actions tab, select or create the required action groups.
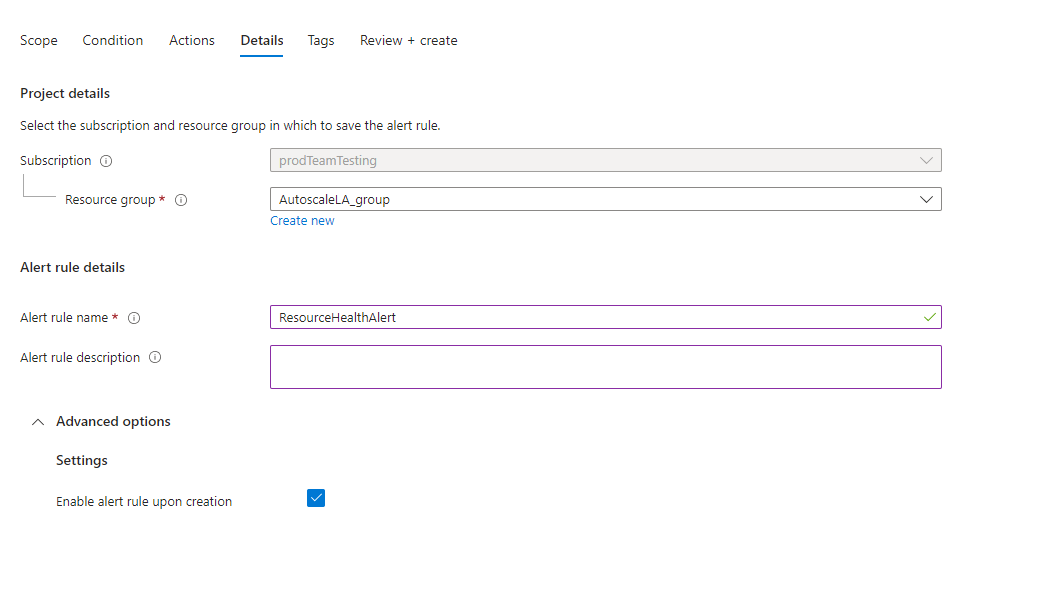
Configure alert rule details
On the Details tab, enter values for Alert rule name and Alert rule description.
Select Enable alert rule upon creation for the alert rule to start running as soon as you finish creating it.
(Optional) For Region, select a region in which your alert rule will be processed. If you need to make sure the rule is processed within the EU Data Boundary, select the North Europe or West Europe region. In all other cases, you can select the Global region (which is the default).
Note
Service Health alert rules can only be located in the Global region.
-
(Optional) In the Custom properties section, if this alert rule contains action groups, you can add your own properties to include in the alert notification payload. You can use these properties in the actions that the action group calls, such as by a webhook, Azure function, or logic app action.
The custom properties are specified as key/value pairs by using static text, a dynamic value extracted from the alert payload, or a combination of both.
The format for extracting a dynamic value from the alert payload is:
${<path to schema field>}. For example:${data.essentials.monitorCondition}.Use the format of the common alert schema to specify the field in the payload, whether or not the action groups configured for the alert rule use the common schema.
Note
- The common alert schema overwrites custom configurations. You can't use both custom properties and the common schema.
- Custom properties are added to the payload of the alert, but they don't appear in the email template or in the alert details in the Azure portal.
- Azure Service Health alerts don't support custom properties.
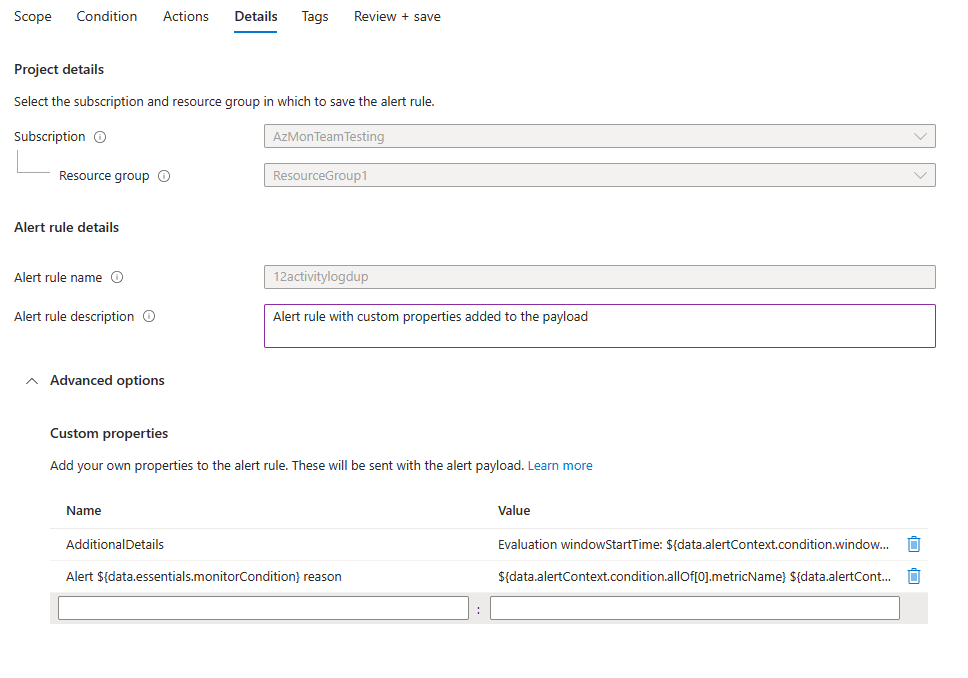
The following examples use values in Custom properties to utilize data from a payload that uses the common alert schema.
This example creates an Additional Details tag with data regarding the window start time and window end time:
- Name:
Additional Details - Value:
Evaluation windowStartTime: \${data.alertContext.condition.windowStartTime}. windowEndTime: \${data.alertContext.condition.windowEndTime} - Result:
AdditionalDetails:Evaluation windowStartTime: 2023-04-04T14:39:24.492Z. windowEndTime: 2023-04-04T14:44:24.492Z
This example adds data regarding the reason for resolving or firing the alert:
- Name:
Alert \${data.essentials.monitorCondition} reason - Value:
\${data.alertContext.condition.allOf[0].metricName} \${data.alertContext.condition.allOf[0].operator} \${data.alertContext.condition.allOf[0].threshold} \${data.essentials.monitorCondition}. The value is \${data.alertContext.condition.allOf[0].metricValue} - Potential results:
Alert Resolved reason: Percentage CPU GreaterThan5 Resolved. The value is 3.585Alert Fired reason": "Percentage CPU GreaterThan5 Fired. The value is 10.585
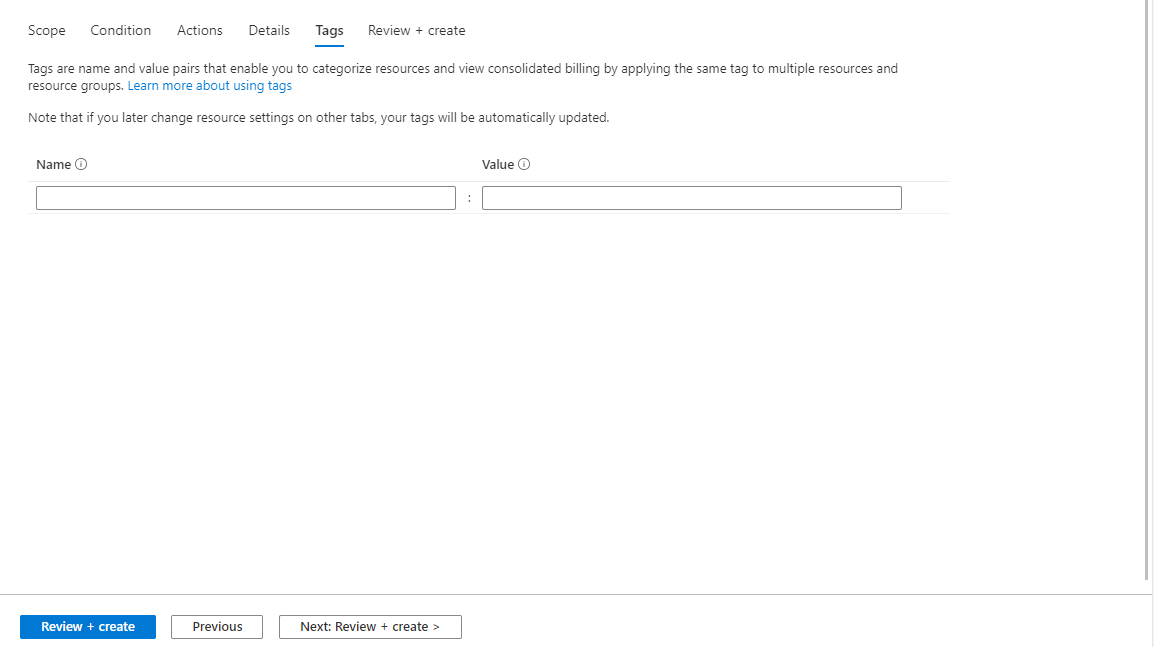
Configure alert rule tags
On the Tags tab, set any required tags on the alert rule resource.
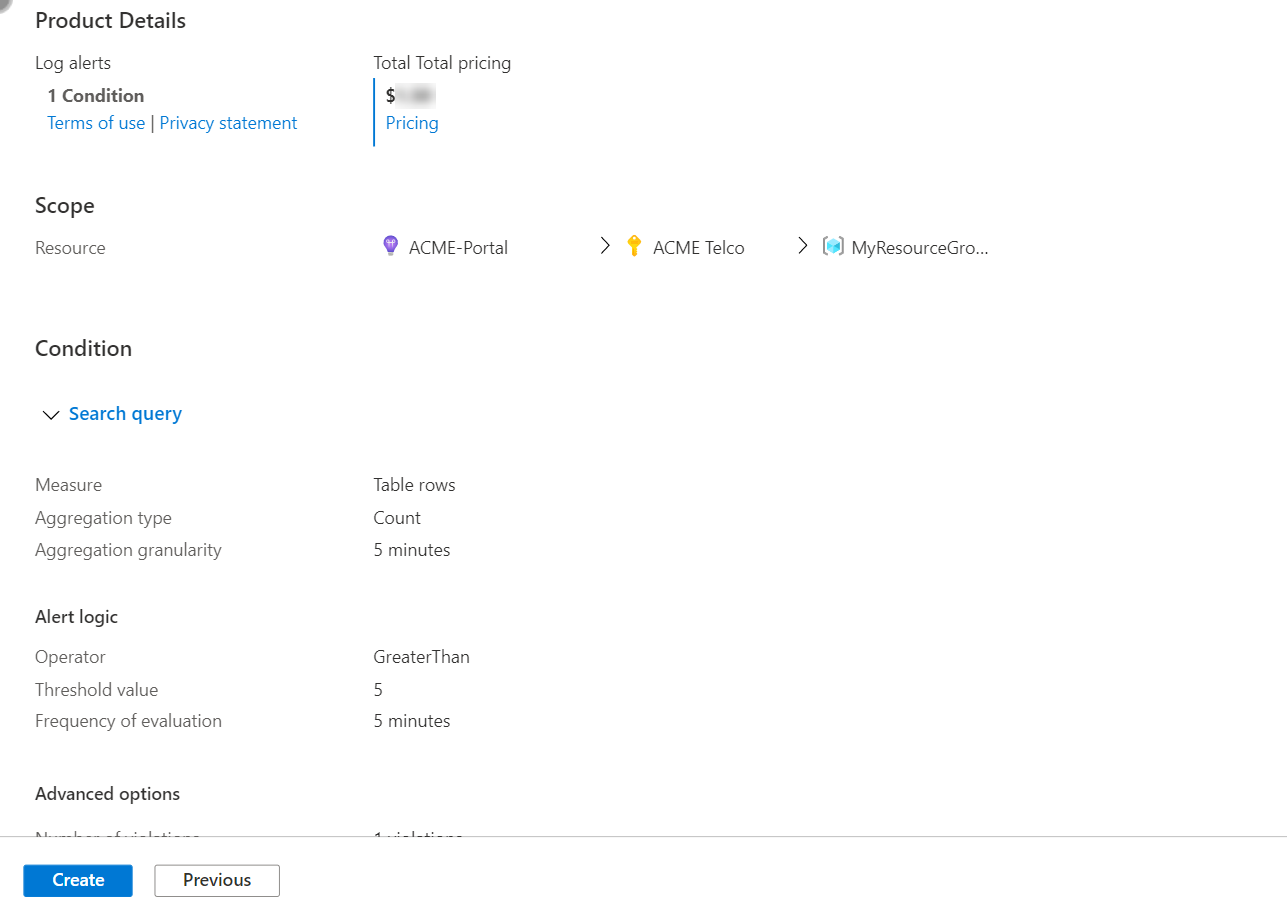
Review and create the alert rule
On the Review + create tab, the rule is validated. If there's a problem, go back and fix it.
When validation passes and you've reviewed the settings, select the Create button.
Related content
Feedback
Coming soon: Throughout 2024 we will be phasing out GitHub Issues as the feedback mechanism for content and replacing it with a new feedback system. For more information see: https://aka.ms/ContentUserFeedback.
Submit and view feedback for