Troubleshoot collection of Prometheus metrics in Azure Monitor
Follow the steps in this article to determine the cause of Prometheus metrics not being collected as expected in Azure Monitor.
Replica pod scrapes metrics from kube-state-metrics, custom scrape targets in the ama-metrics-prometheus-config configmap and custom scrape targets defined in the Custom Resources. DaemonSet pods scrape metrics from the following targets on their respective node: kubelet, cAdvisor, node-exporter, and custom scrape targets in the ama-metrics-prometheus-config-node configmap. The pod that you want to view the logs and the Prometheus UI for it depends on which scrape target you're investigating.
Troubleshoot using PowerShell script
If you encounter an error while you attempt to enable monitoring for your AKS cluster, follow these instructions to run the troubleshooting script. This script is designed to do a basic diagnosis for any configuration issues on your cluster and you can attach the generated files while creating a support request for faster resolution for your support case.
Metrics Throttling
Azure Monitor Managed service for Prometheus has default limits and quotas for ingestion. When you reach the ingestion limits, throttling can occur. You can request an increase in these limits. For information on Prometheus metrics limits, see Azure Monitor service limits.
In the Azure portal, navigate to your Azure Monitor Workspace. Go to Metrics, and select the metrics Active Time Series % Utilization and Events Per Minute Received % Utilization. Verify that both are below 100%.
For more information on monitoring and alerting on your ingestion metrics, see Monitor Azure Monitor workspace metrics ingestion.
Intermittent gaps in metric data collection
During node updates, you may see a 1 to 2-minute gap in metric data for metrics collected from our cluster level collector. This gap is because the node it runs on is being updated as part of a normal update process. It affects cluster-wide targets such as kube-state-metrics and custom application targets that are specified. It occurs when your cluster is updated manually or via autoupdate. This behavior is expected and occurs due to the node it runs on being updated. None of our recommended alert rules are affected by this behavior.
Pod status
Check the pod status with the following command:
kubectl get pods -n kube-system | grep ama-metrics
When the service is running correctly, the following list of pods in the format ama-metrics-xxxxxxxxxx-xxxxx are returned:
ama-metrics-operator-targets-*ama-metrics-ksm-*ama-metrics-node-*pod for each node on the cluster.
Each pod state should be Running and have an equal number of restarts to the number of configmap changes that have been applied. The ama-metrics-operator-targets-* pod might have an extra restart at the beginning and this is expected:

If each pod state is Running but one or more pods have restarts, run the following command:
kubectl describe pod <ama-metrics pod name> -n kube-system
- This command provides the reason for the restarts. Pod restarts are expected if configmap changes have been made. If the reason for the restart is
OOMKilled, the pod can't keep up with the volume of metrics. See the scale recommendations for the volume of metrics.
If the pods are running as expected, the next place to check is the container logs.
Check for relabeling configs
If metrics are missing, you can also check if you have relabeling configs. With relabeling configs, ensure that the relabeling doesn't filter out the targets, and the labels configured correctly match the targets. For more information, see Prometheus relabel config documentation.
Container logs
View the container logs with the following command:
kubectl logs <ama-metrics pod name> -n kube-system -c prometheus-collector
At startup, any initial errors are printed in red, while warnings are printed in yellow. (Viewing the colored logs requires at least PowerShell version 7 or a linux distribution.)
- Verify if there's an issue with getting the authentication token:
- The message No configuration present for the AKS resource gets logged every 5 minutes.
- The pod restarts every 15 minutes to try again with the error: No configuration present for the AKS resource.
- If so, check that the Data Collection Rule and Data Collection Endpoint exist in your resource group.
- Also verify that the Azure Monitor Workspace exists.
- Verify that you don't have a private AKS cluster and that it's not linked to an Azure Monitor Private Link Scope for any other service. This scenario is currently not supported.
Config Processing
View the container logs with the following command:
kubectl logs <ama-metrics-operator-targets pod name> -n kube-system -c config-reader
- Verify there are no errors with parsing the Prometheus config, merging with any default scrape targets enabled, and validating the full config.
- If you did include a custom Prometheus config, verify that it's recognized in the logs. If not:
- Verify that your configmap has the correct name:
ama-metrics-prometheus-configin thekube-systemnamespace. - Verify that in the configmap your Prometheus config is under a section called
prometheus-configunderdatalike shown here:kind: ConfigMap apiVersion: v1 metadata: name: ama-metrics-prometheus-config namespace: kube-system data: prometheus-config: |- scrape_configs: - job_name: <your scrape job here>
- Verify that your configmap has the correct name:
- If you did create Custom Resources, you should have seen any validation errors during the creation of pod/service monitors. If you still don't see the metrics from the targets make sure that the logs show no errors.
kubectl logs <ama-metrics-operator-targets pod name> -n kube-system -c targetallocator
- Verify there are no errors from
MetricsExtensionregarding authenticating with the Azure Monitor workspace. - Verify there are no errors from the
OpenTelemetry collectorabout scraping the targets.
Run the following command:
kubectl logs <ama-metrics pod name> -n kube-system -c addon-token-adapter
- This command shows an error if there's an issue with authenticating with the Azure Monitor workspace. The example below shows logs with no issues:


If there are no errors in the logs, the Prometheus interface can be used for debugging to verify the expected configuration and targets being scraped.
Prometheus interface
Every ama-metrics-* pod has the Prometheus Agent mode User Interface available on port 9090.
Custom config and Custom Resources targets are scraped by the ama-metrics-* pod and the node targets by the ama-metrics-node-* pod.
Port-forward into either the replica pod or one of the daemon set pods to check the config, service discovery and targets endpoints as described here to verify the custom configs are correct, the intended targets have been discovered for each job, and there are no errors with scraping specific targets.
Run the command kubectl port-forward <ama-metrics pod> -n kube-system 9090.
Open a browser to the address
127.0.0.1:9090/config. This user interface has the full scrape configuration. Verify all jobs are included in the config.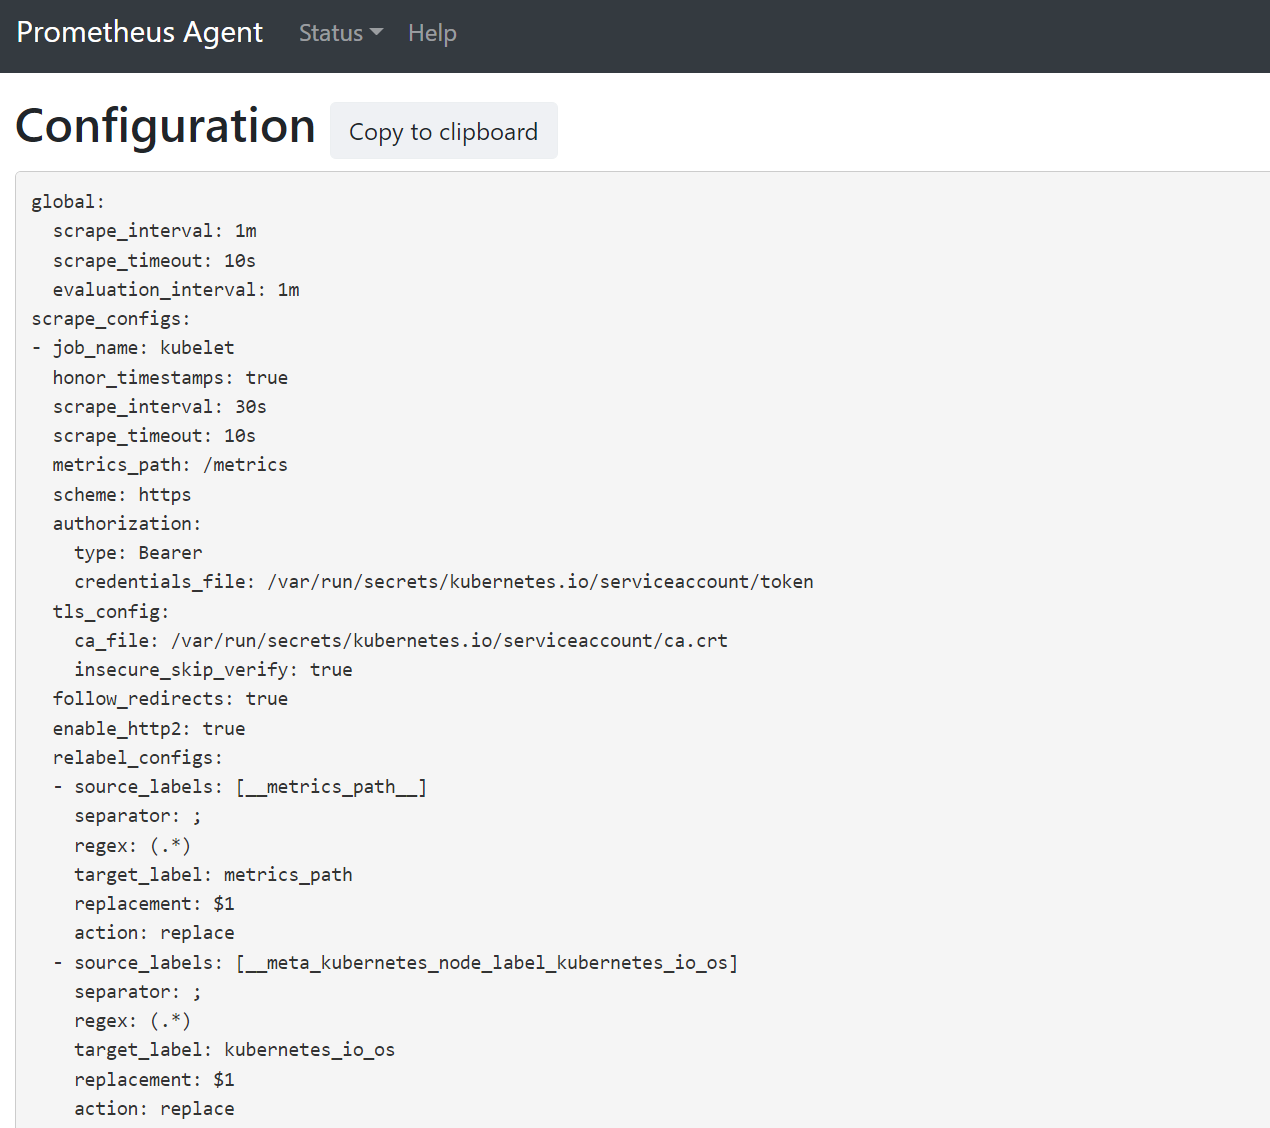
Go to
127.0.0.1:9090/service-discoveryto view the targets discovered by the service discovery object specified and what the relabel_configs have filtered the targets to be. For example, when missing metrics from a certain pod, you can find if that pod was discovered and what its URI is. You can then use this URI when looking at the targets to see if there are any scrape errors.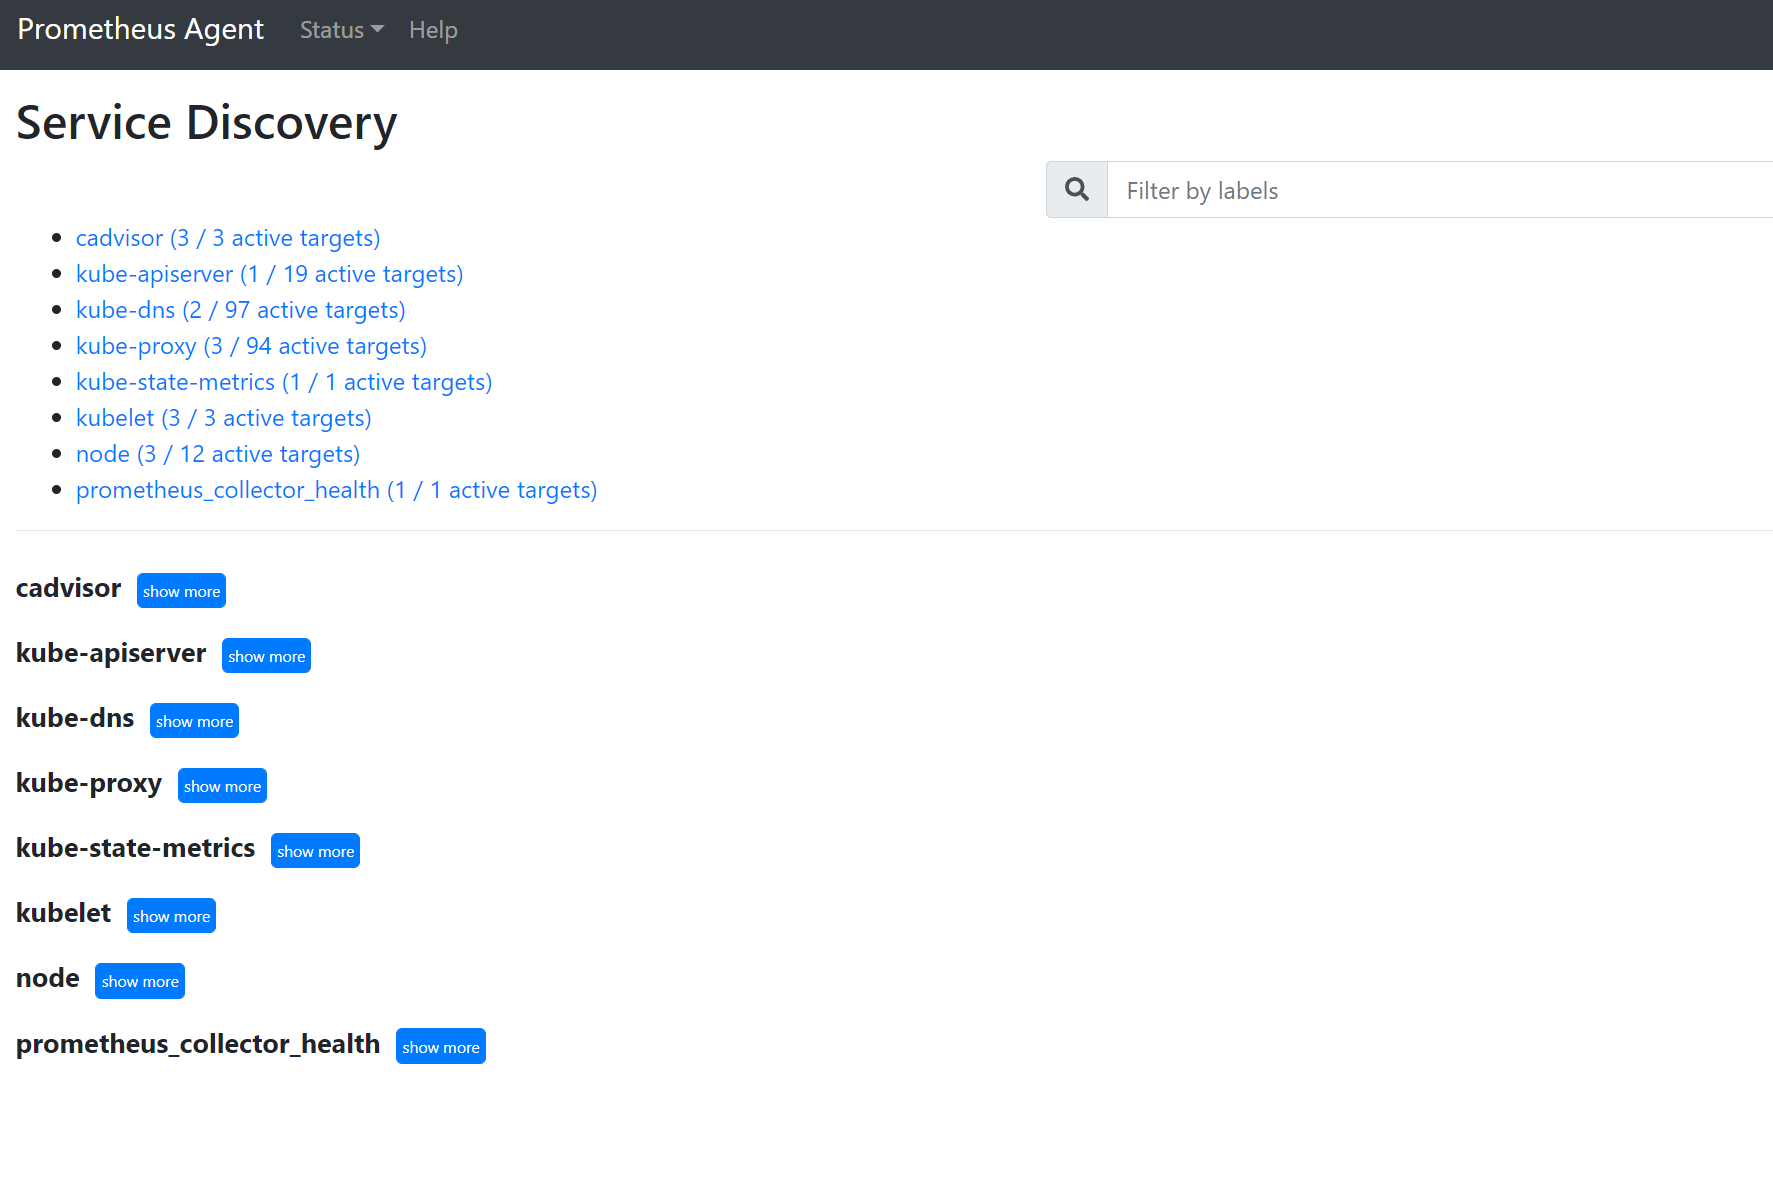
Go to
127.0.0.1:9090/targetsto view all jobs, the last time the endpoint for that job was scraped, and any errors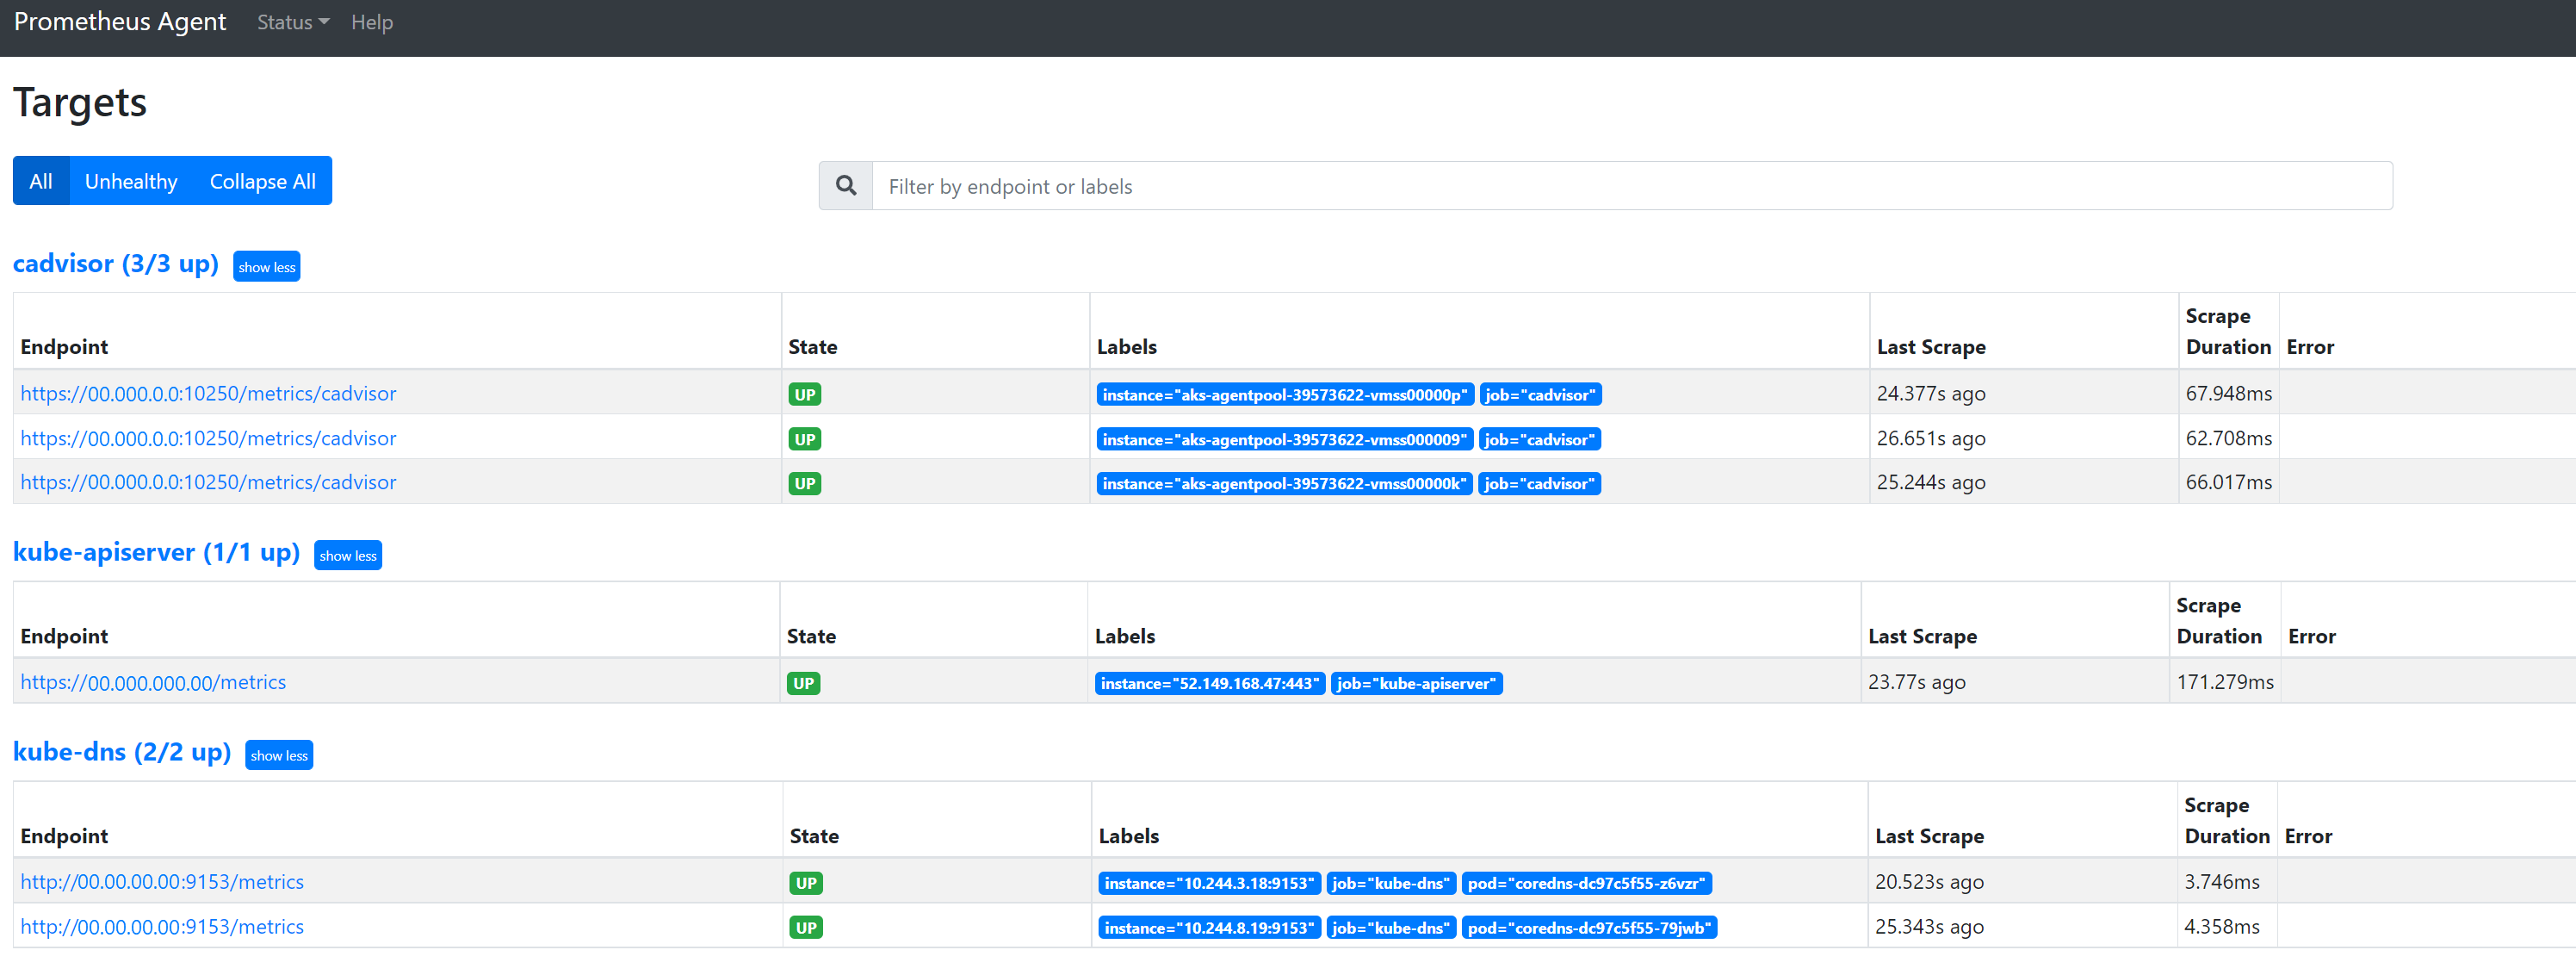


Custom Resources
- If you did include Custom Resources, make sure they show up under configuration, service discovery and targets.
Configuration

Service Discovery

Targets

If there are no issues and the intended targets are being scraped, you can view the exact metrics being scraped by enabling debug mode.
Debug mode
Warning
This mode can affect performance and should only be enabled for a short time for debugging purposes.
The metrics addon can be configured to run in debug mode by changing the configmap setting enabled under debug-mode to true by following the instructions here.
When enabled, all Prometheus metrics that are scraped are hosted at port 9091. Run the following command:
kubectl port-forward <ama-metrics pod name> -n kube-system 9091
Go to 127.0.0.1:9091/metrics in a browser to see if the metrics were scraped by the OpenTelemetry Collector. This user interface can be accessed for every ama-metrics-* pod. If metrics aren't there, there could be an issue with the metric or label name lengths or the number of labels. Also check for exceeding the ingestion quota for Prometheus metrics as specified in this article.
Metric names, label names & label values
Metrics scraping currently has the limitations in the following table:
| Property | Limit |
|---|---|
| Label name length | Less than or equal to 511 characters. When this limit is exceeded for any time-series in a job, the entire scrape job fails, and metrics get dropped from that job before ingestion. You can see up=0 for that job and also target Ux shows the reason for up=0. |
| Label value length | Less than or equal to 1023 characters. When this limit is exceeded for any time-series in a job, the entire scrape fails, and metrics get dropped from that job before ingestion. You can see up=0 for that job and also target Ux shows the reason for up=0. |
| Number of labels per time series | Less than or equal to 63. When this limit is exceeded for any time-series in a job, the entire scrape job fails, and metrics get dropped from that job before ingestion. You can see up=0 for that job and also target Ux shows the reason for up=0. |
| Metric name length | Less than or equal to 511 characters. When this limit is exceeded for any time-series in a job, only that particular series get dropped. MetricextensionConsoleDebugLog has traces for the dropped metric. |
| Label names with different casing | Two labels within the same metric sample, with different casing is treated as having duplicate labels and are dropped when ingested. For example, the time series my_metric{ExampleLabel="label_value_0", examplelabel="label_value_1} is dropped due to duplicate labels since ExampleLabel and examplelabel are seen as the same label name. |
Check ingestion quota on Azure Monitor workspace
If you see metrics missed, you can first check if the ingestion limits are being exceeded for your Azure Monitor workspace. In the Azure portal, you can check the current usage for any Azure monitor Workspace. You can see current usage metrics under Metrics menu for the Azure Monitor workspace. Following utilization metrics are available as standard metrics for each Azure Monitor workspace.
- Active Time Series - The number of unique time series recently ingested into the workspace over the previous 12 hours
- Active Time Series Limit - The limit on the number of unique time series that can be actively ingested into the workspace
- Active Time Series % Utilization - The percentage of current active time series being utilized
- Events Per Minute Ingested - The number of events (samples) per minute recently received
- Events Per Minute Ingested Limit - The maximum number of events per minute that can be ingested before getting throttled
- Events Per Minute Ingested % Utilization - The percentage of current metric ingestion rate limit being util
To avoid metrics ingestion throttling, you can monitor and set up an alert on the ingestion limits. See Monitor ingestion limits.
Refer to service quotas and limits for default quotas and also to understand what can be increased based on your usage. You can request quota increase for Azure Monitor workspaces using the Support Request menu for the Azure Monitor workspace. Ensure you include the ID, internal ID, and Location/Region for the Azure Monitor workspace in the support request, which you can find in the `Properties' menu for the Azure Monitor workspace in the Azure portal.
Creation of Azure Monitor Workspace failed due to Azure Policy evaluation
If creation of Azure Monitor Workspace fails with an error saying "Resource 'resource-name-xyz' was disallowed by policy", there might be an Azure policy that is preventing the resource to be created. If there's a policy that enforces a naming convention for your Azure resources or resource groups, you'll need to create an exemption for the naming convention for creation of an Azure Monitor Workspace.
When you create an Azure Monitor workspace, by default a data collection rule and a data collection endpoint in the form "azure-monitor-workspace-name" will automatically be created in a resource group in the form "MA_azure-monitor-workspace-name_location_managed". Currently there's no way to change the names of these resources, and you'll need to set an exemption on the Azure Policy to exempt the above resources from policy evaluation. See Azure Policy exemption structure.