View and manage alerts on your OT sensor
Microsoft Defender for IoT alerts enhance your network security and operations with real-time details about events logged in your network. OT alerts are triggered when OT network sensors detect changes or suspicious activity in network traffic that needs your attention.
This article describes how to view Defender for IoT alerts directly on an OT network sensor. You can also view OT alerts on the Azure portal or an on-premises management console.
For more information, see Microsoft Defender for IoT alerts.
Prerequisites
To have alerts on your OT sensor, you must have a SPAN port configured for your sensor and Defender for IoT monitoring software installed. For more information, see Install OT agentless monitoring software.
To view alerts on the OT sensor, sign into your sensor as an Admin, Security Analyst, or Viewer user.
To manage alerts on an OT sensor, sign into your sensor as an Admin or Security Analyst user. Alert management activities include modifying their statuses or severities, learning or muting an alert, accessing PCAP data, or adding pre-defined comments to an alert.
For more information, see On-premises users and roles for OT monitoring with Defender for IoT.
View alerts on an OT sensor
Sign into your OT sensor console and select the Alerts page on the left.
By default, the following details are shown in the grid:
Name Description Severity A predefined alert severity assigned by the sensor that you can modify as needed, including: Critical, Major, Minor, Warning. Name The alert title Engine The Defender for IoT detection engine that detected the activity and triggered the alert. Last detection The last time the alert was detected.
- If an alert's status is New, and the same traffic is seen again, the Last detection time is updated for the same alert.
- If the alert's status is Closed and traffic is seen again, the Last detection time is not updated, and a new alert is triggered.
Note: While the sensor console displays an alert's Last detection field in real-time, Defender for IoT in the Azure portal may take up to one hour to display the updated time. This explains a scenario where the last detection time in the sensor console isn't the same as the last detection time in the Azure portal.Status The alert status: New, Active, Closed
For more information, see Alert statuses and triaging options.Source Device The source device IP address, MAC, or device name. Id The unique alert ID, aligned with the ID on the Azure portal.
Note: If the alert was merged with other alerts from sensors that detected the same alert, the Azure portal displays the alert ID of the first sensor that generated the alerts.To view more details, select the
 Edit Columns button.
In the Edit Columns pane on the right, select Add Column and any of the following extra columns:
Name Description Destination Device The destination device IP address. First detection The first time the alert activity was detected. ID The alert ID. Last activity The last time the alert was changed, including manual updates for severity or status, or automated changes for device updates or device/alert de-duplication
Filter alerts displayed
Use the Search box, Time range, and Add filter options to filter the alerts displayed by specific parameters or help locate a specific alert.
For example:
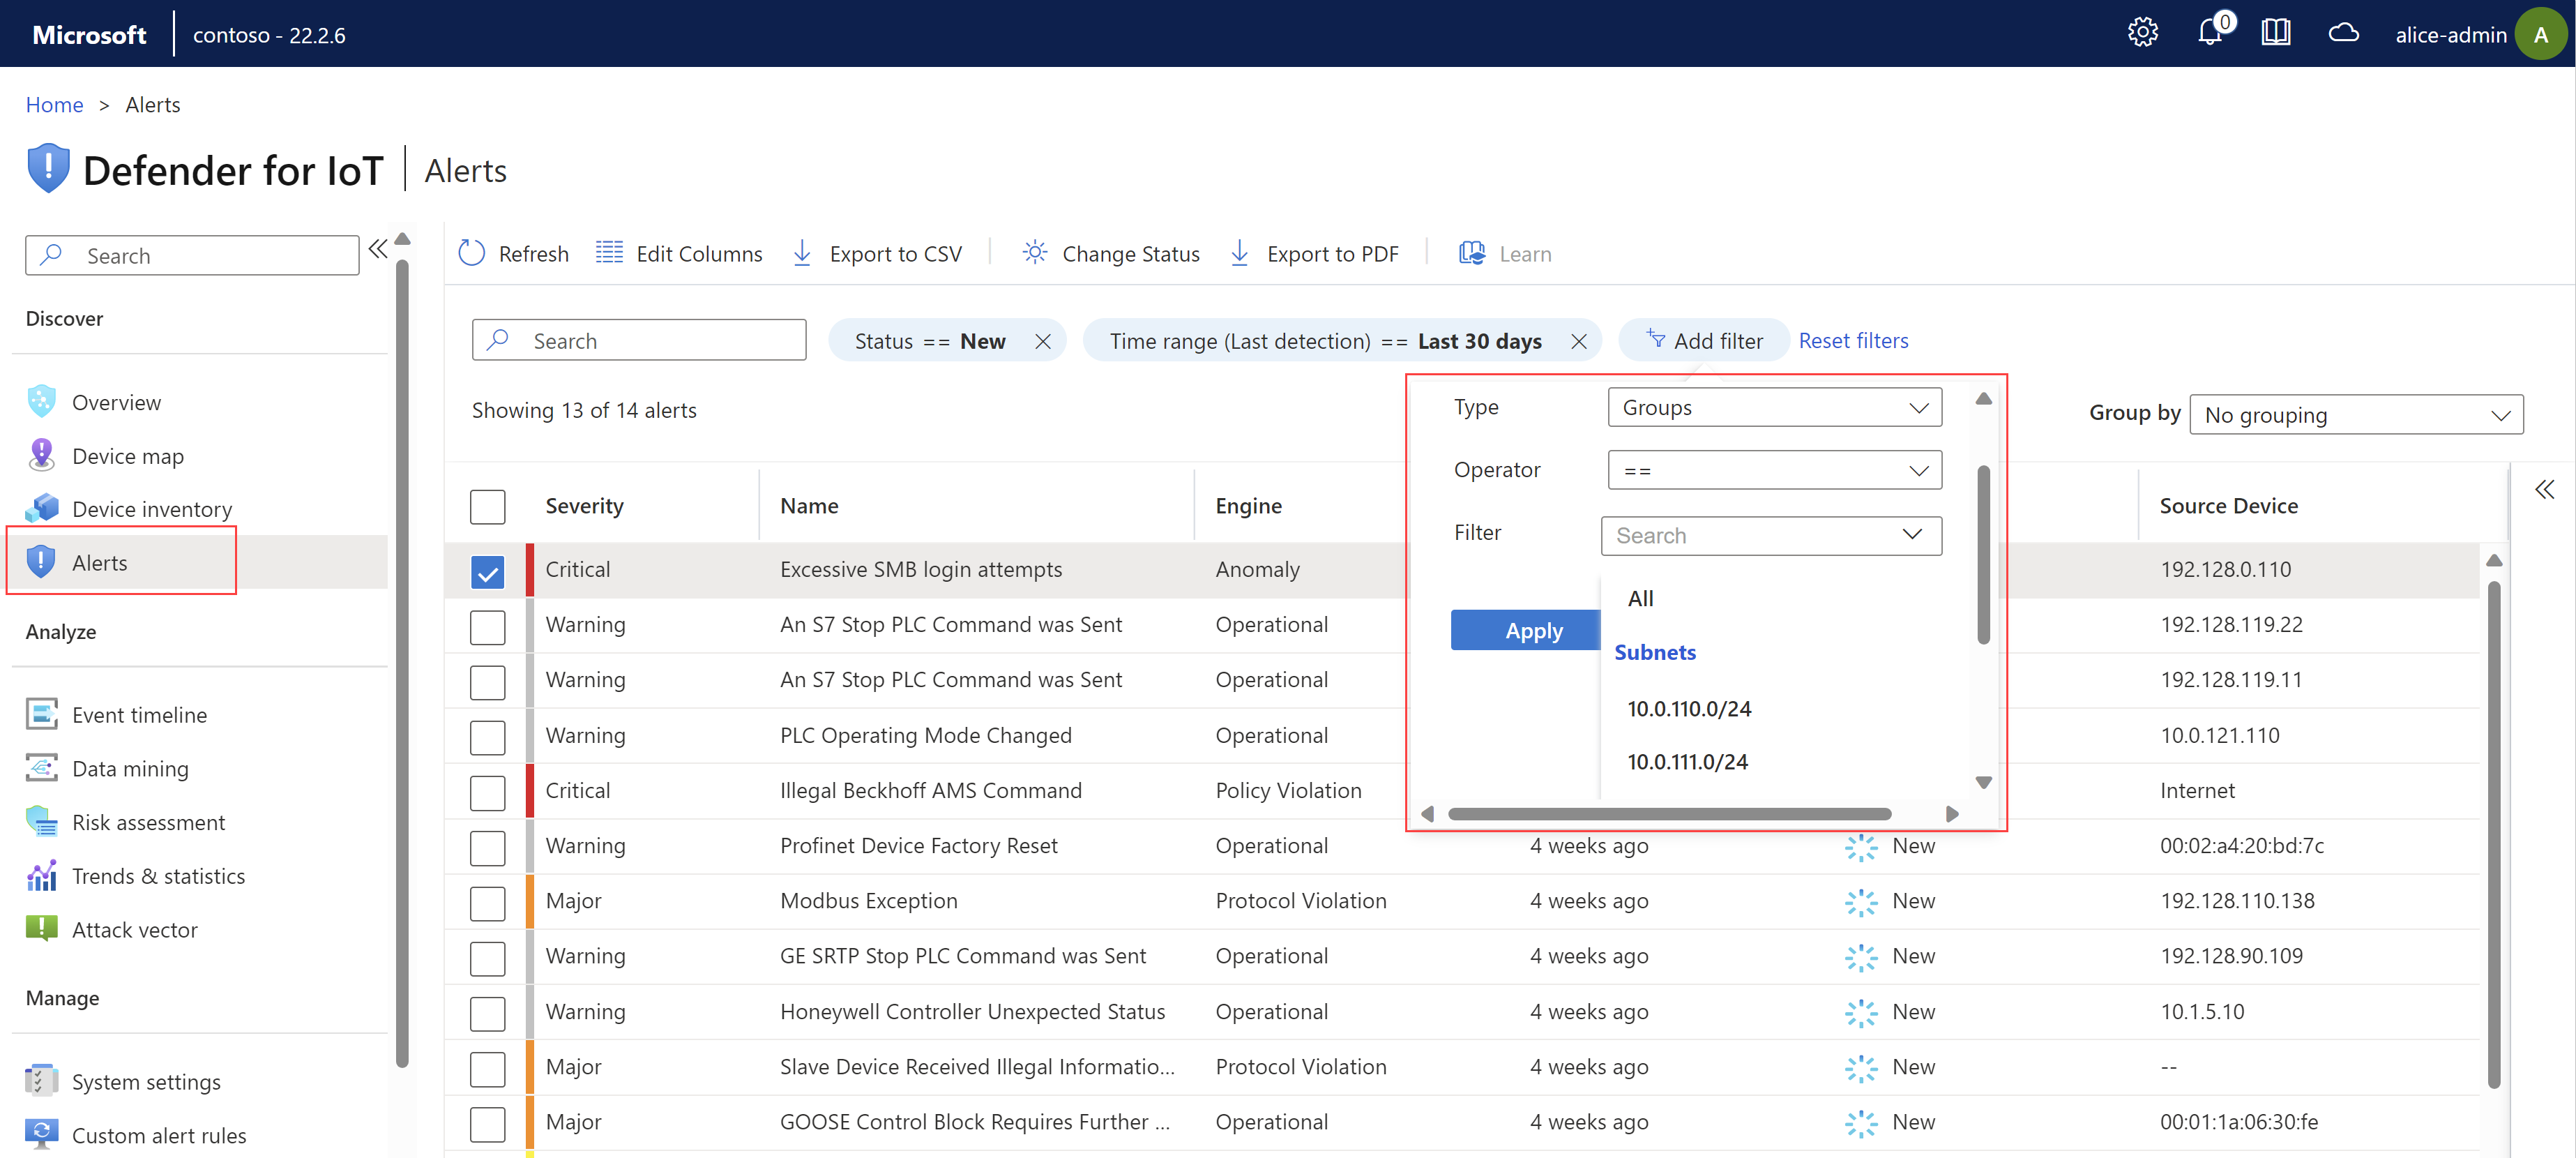
Filtering alerts by Groups uses any custom groups you may have created in the Device inventory or the Device map pages.
Group alerts displayed
Use the Group by menu at the top right to collapse the grid into subsections based on Severity, Name, Engine, or Status.
For example, while the total number of alerts appears above the grid, you may want more specific information about alert count breakdown, such as the number of alerts with a specific severity or status.
View details and remediate a specific alert
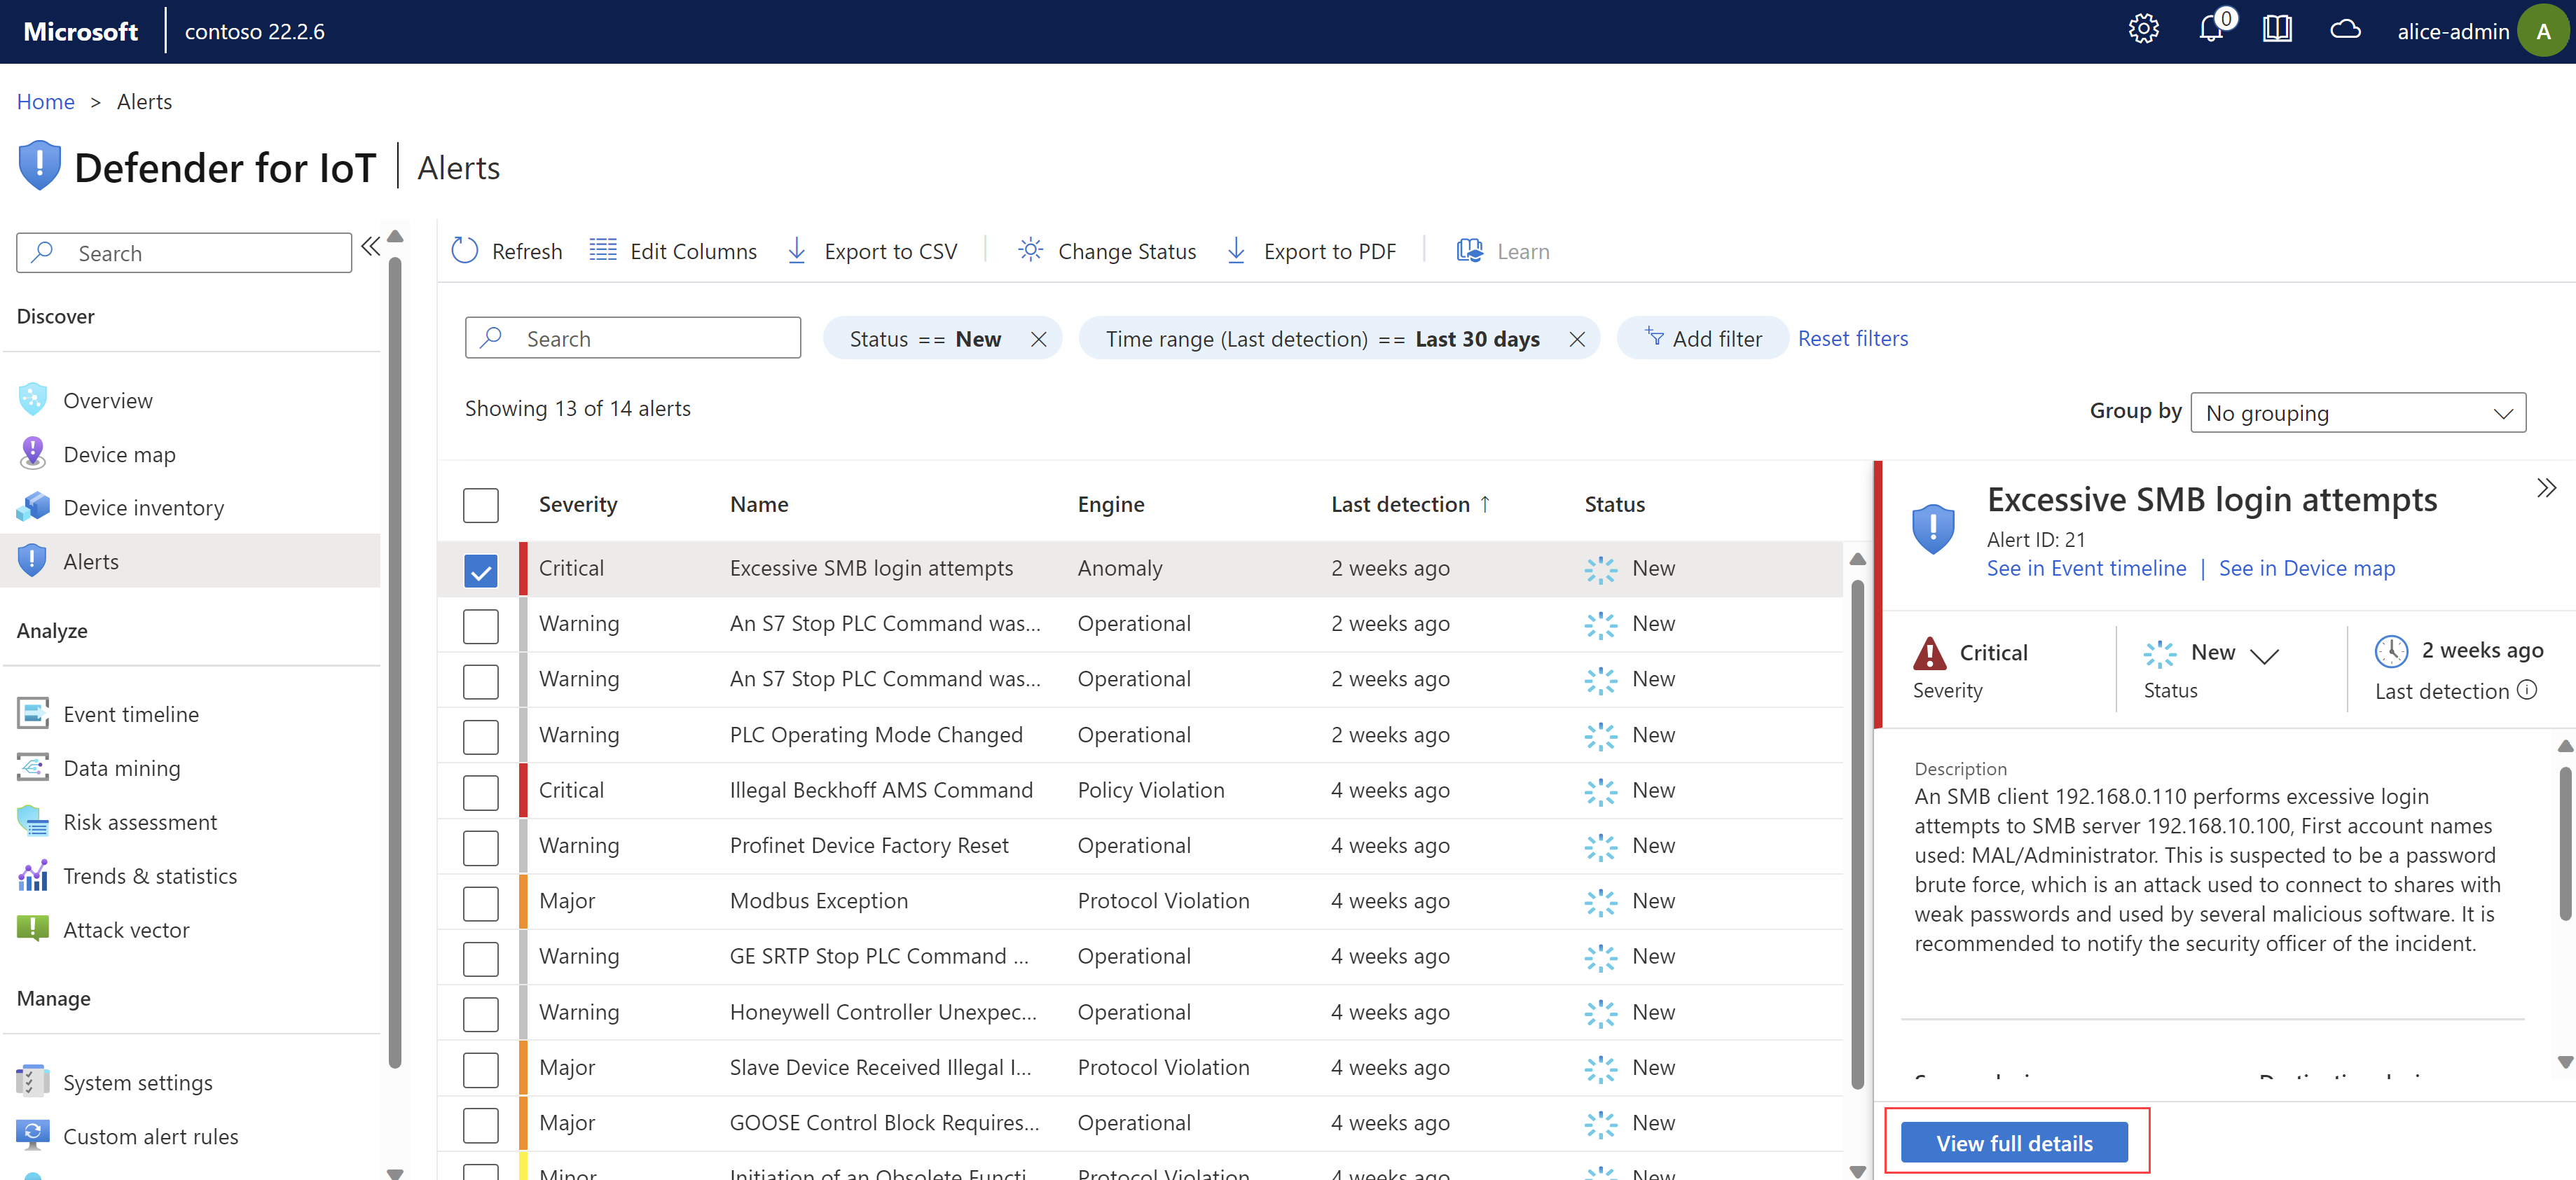
Sign into the OT sensor and select Alerts on the left-hand menu.
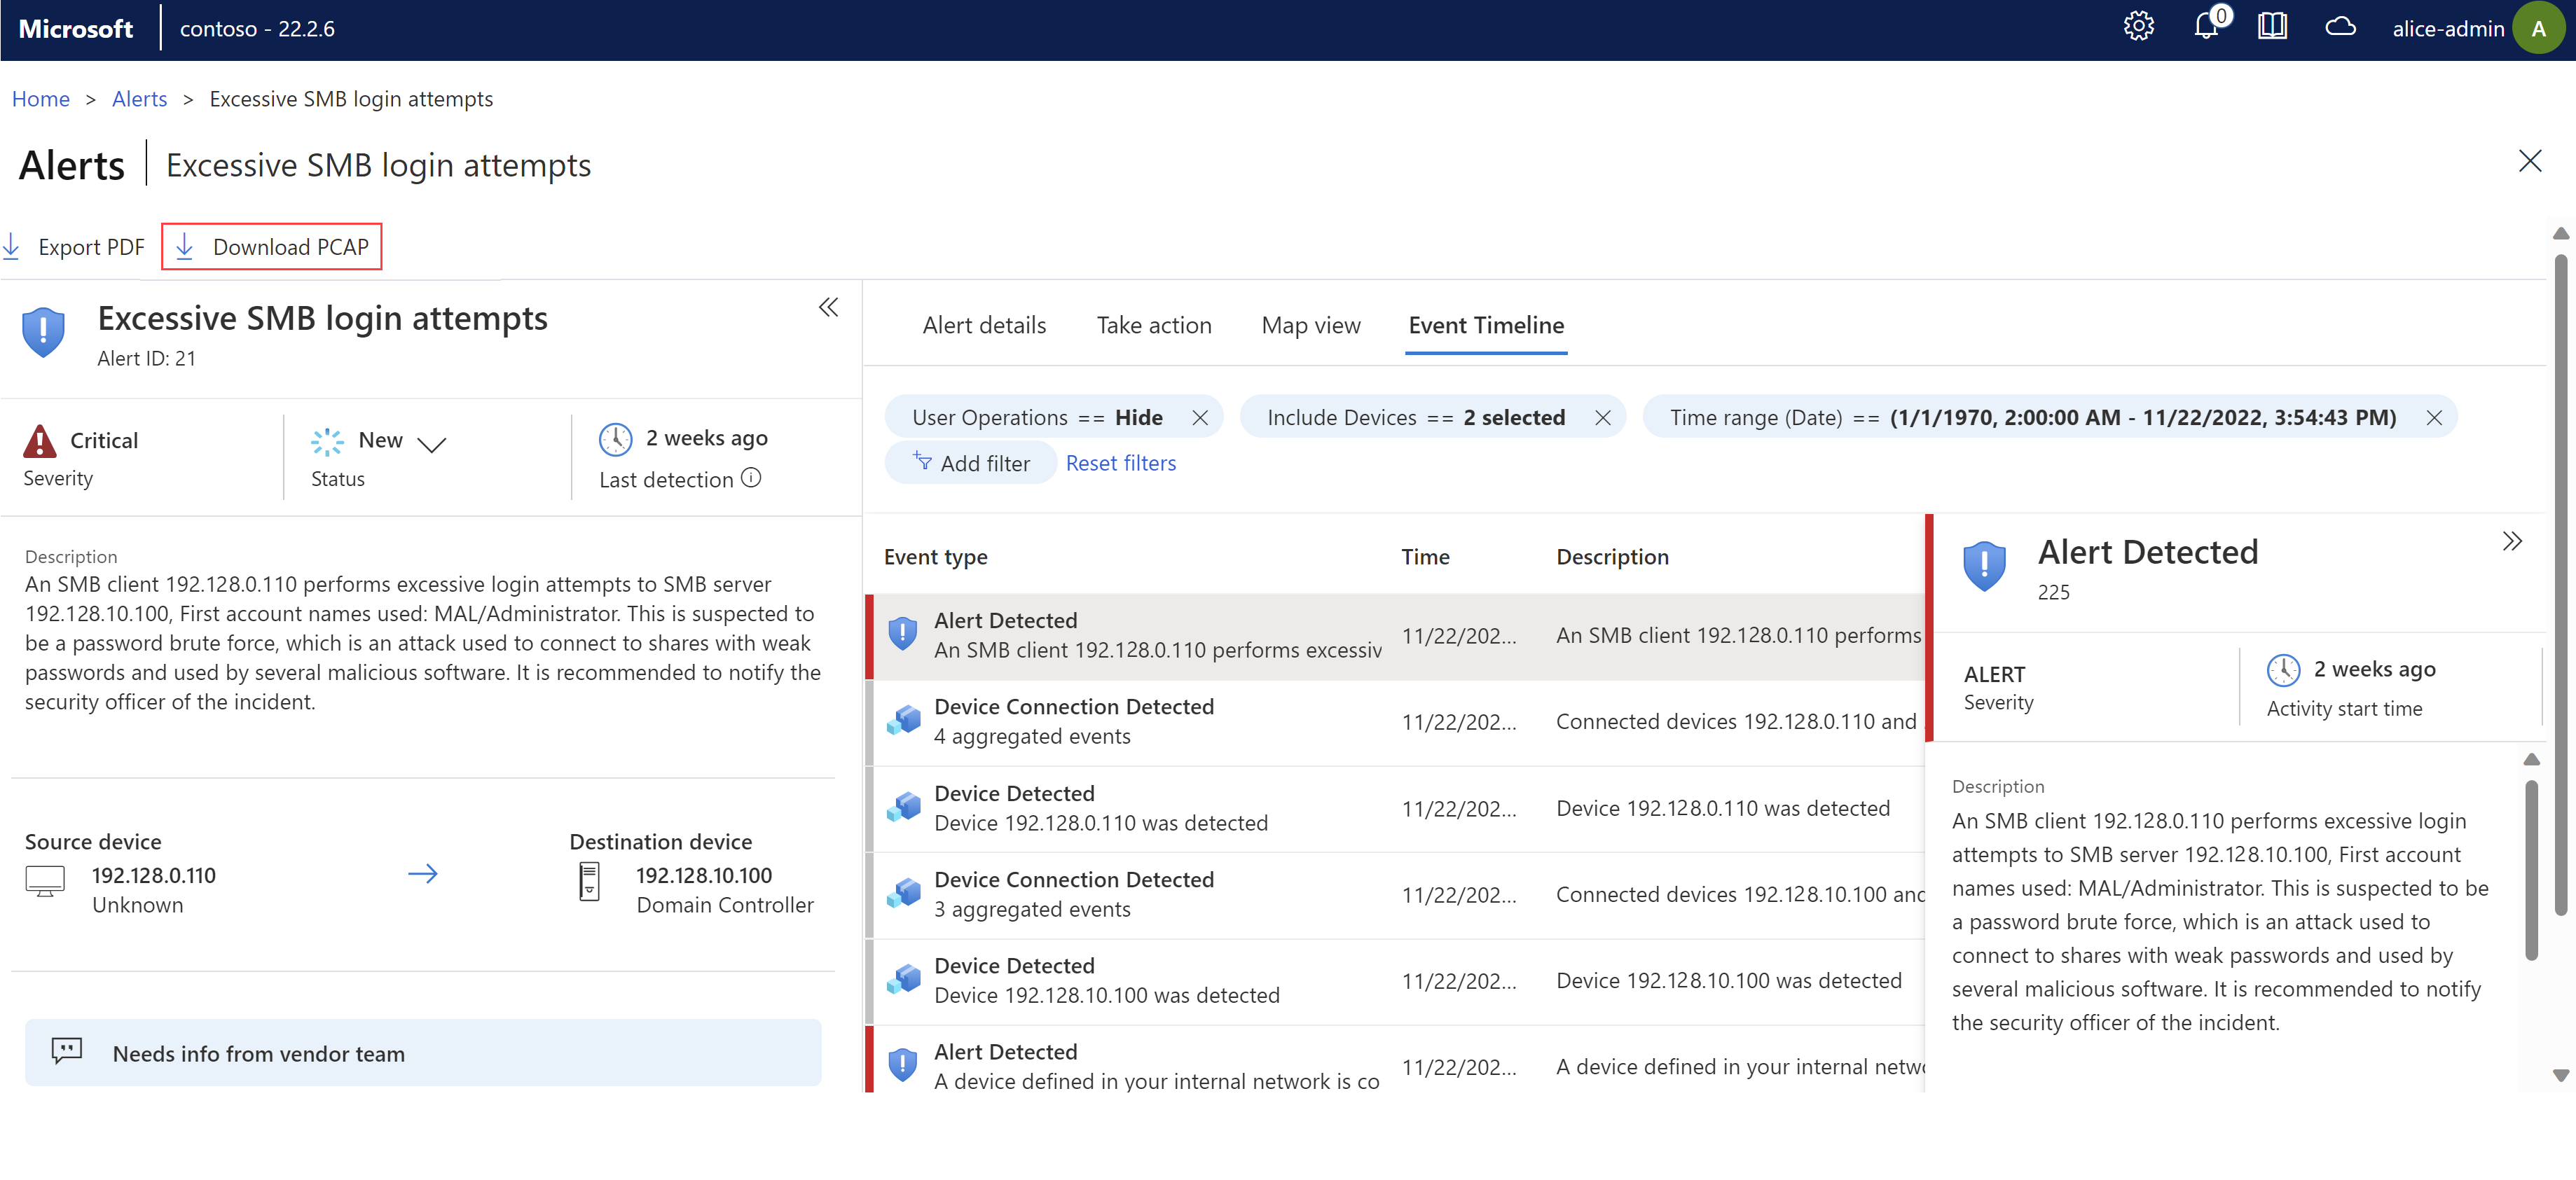
Select an alert in the grid to display more details in the pane on the right. The alert details pane includes the alert description, traffic source and destination, and more. Select View full details to drill down further. For example:
The alert details page provides more details about the alert, and a set of remediation steps on the Take action tab.
Use the following tabs to gain more contextual insight:
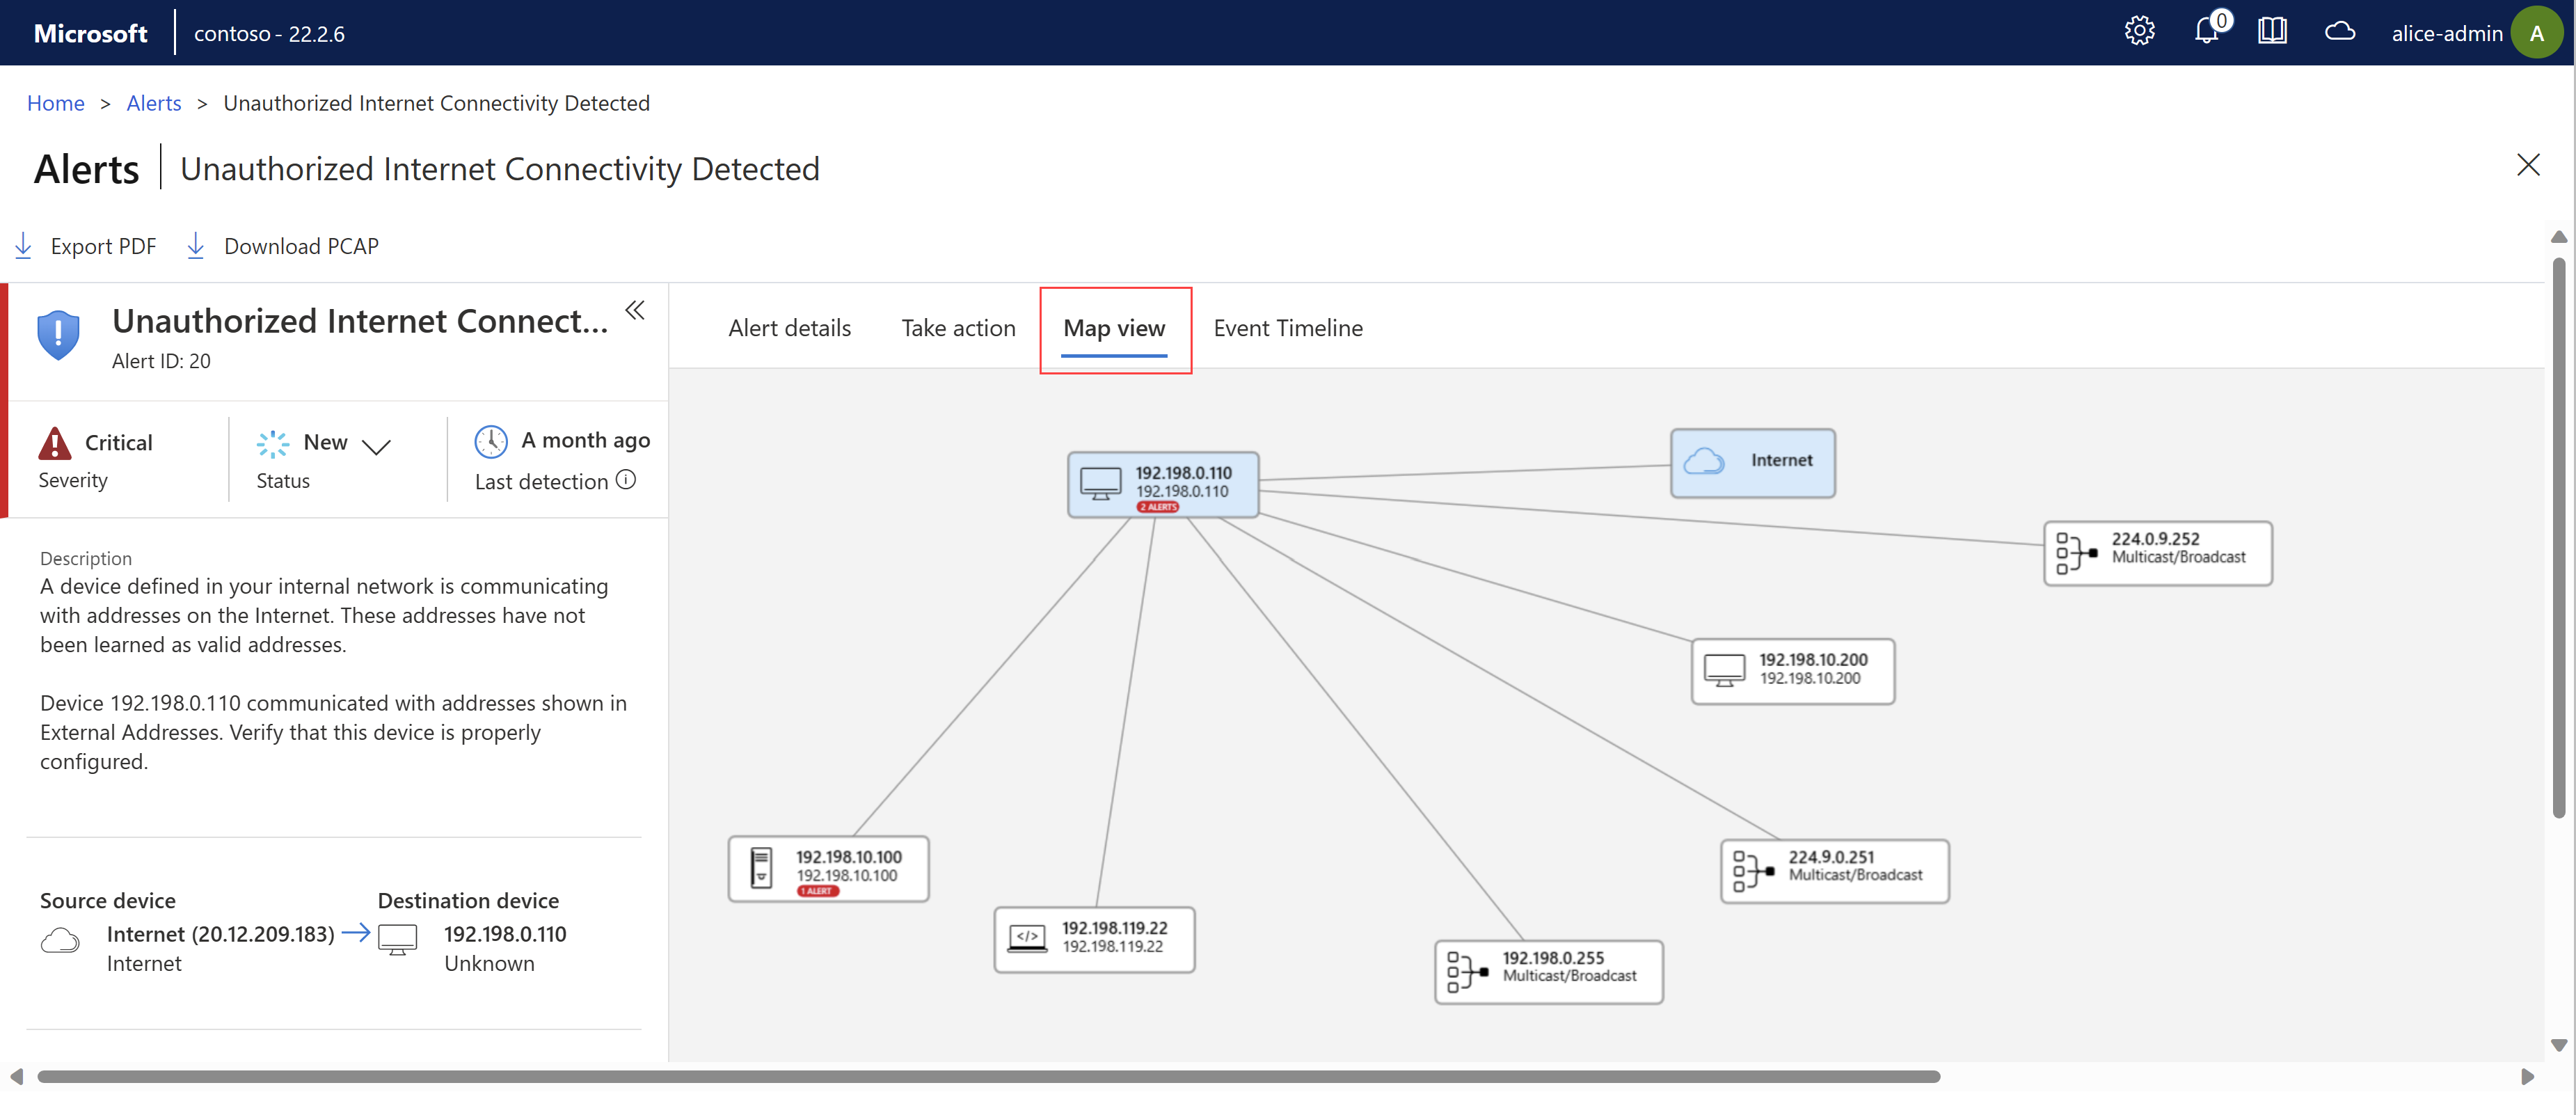
Map View. View the source and destination devices in a map view with other devices connected to your sensor. For example:
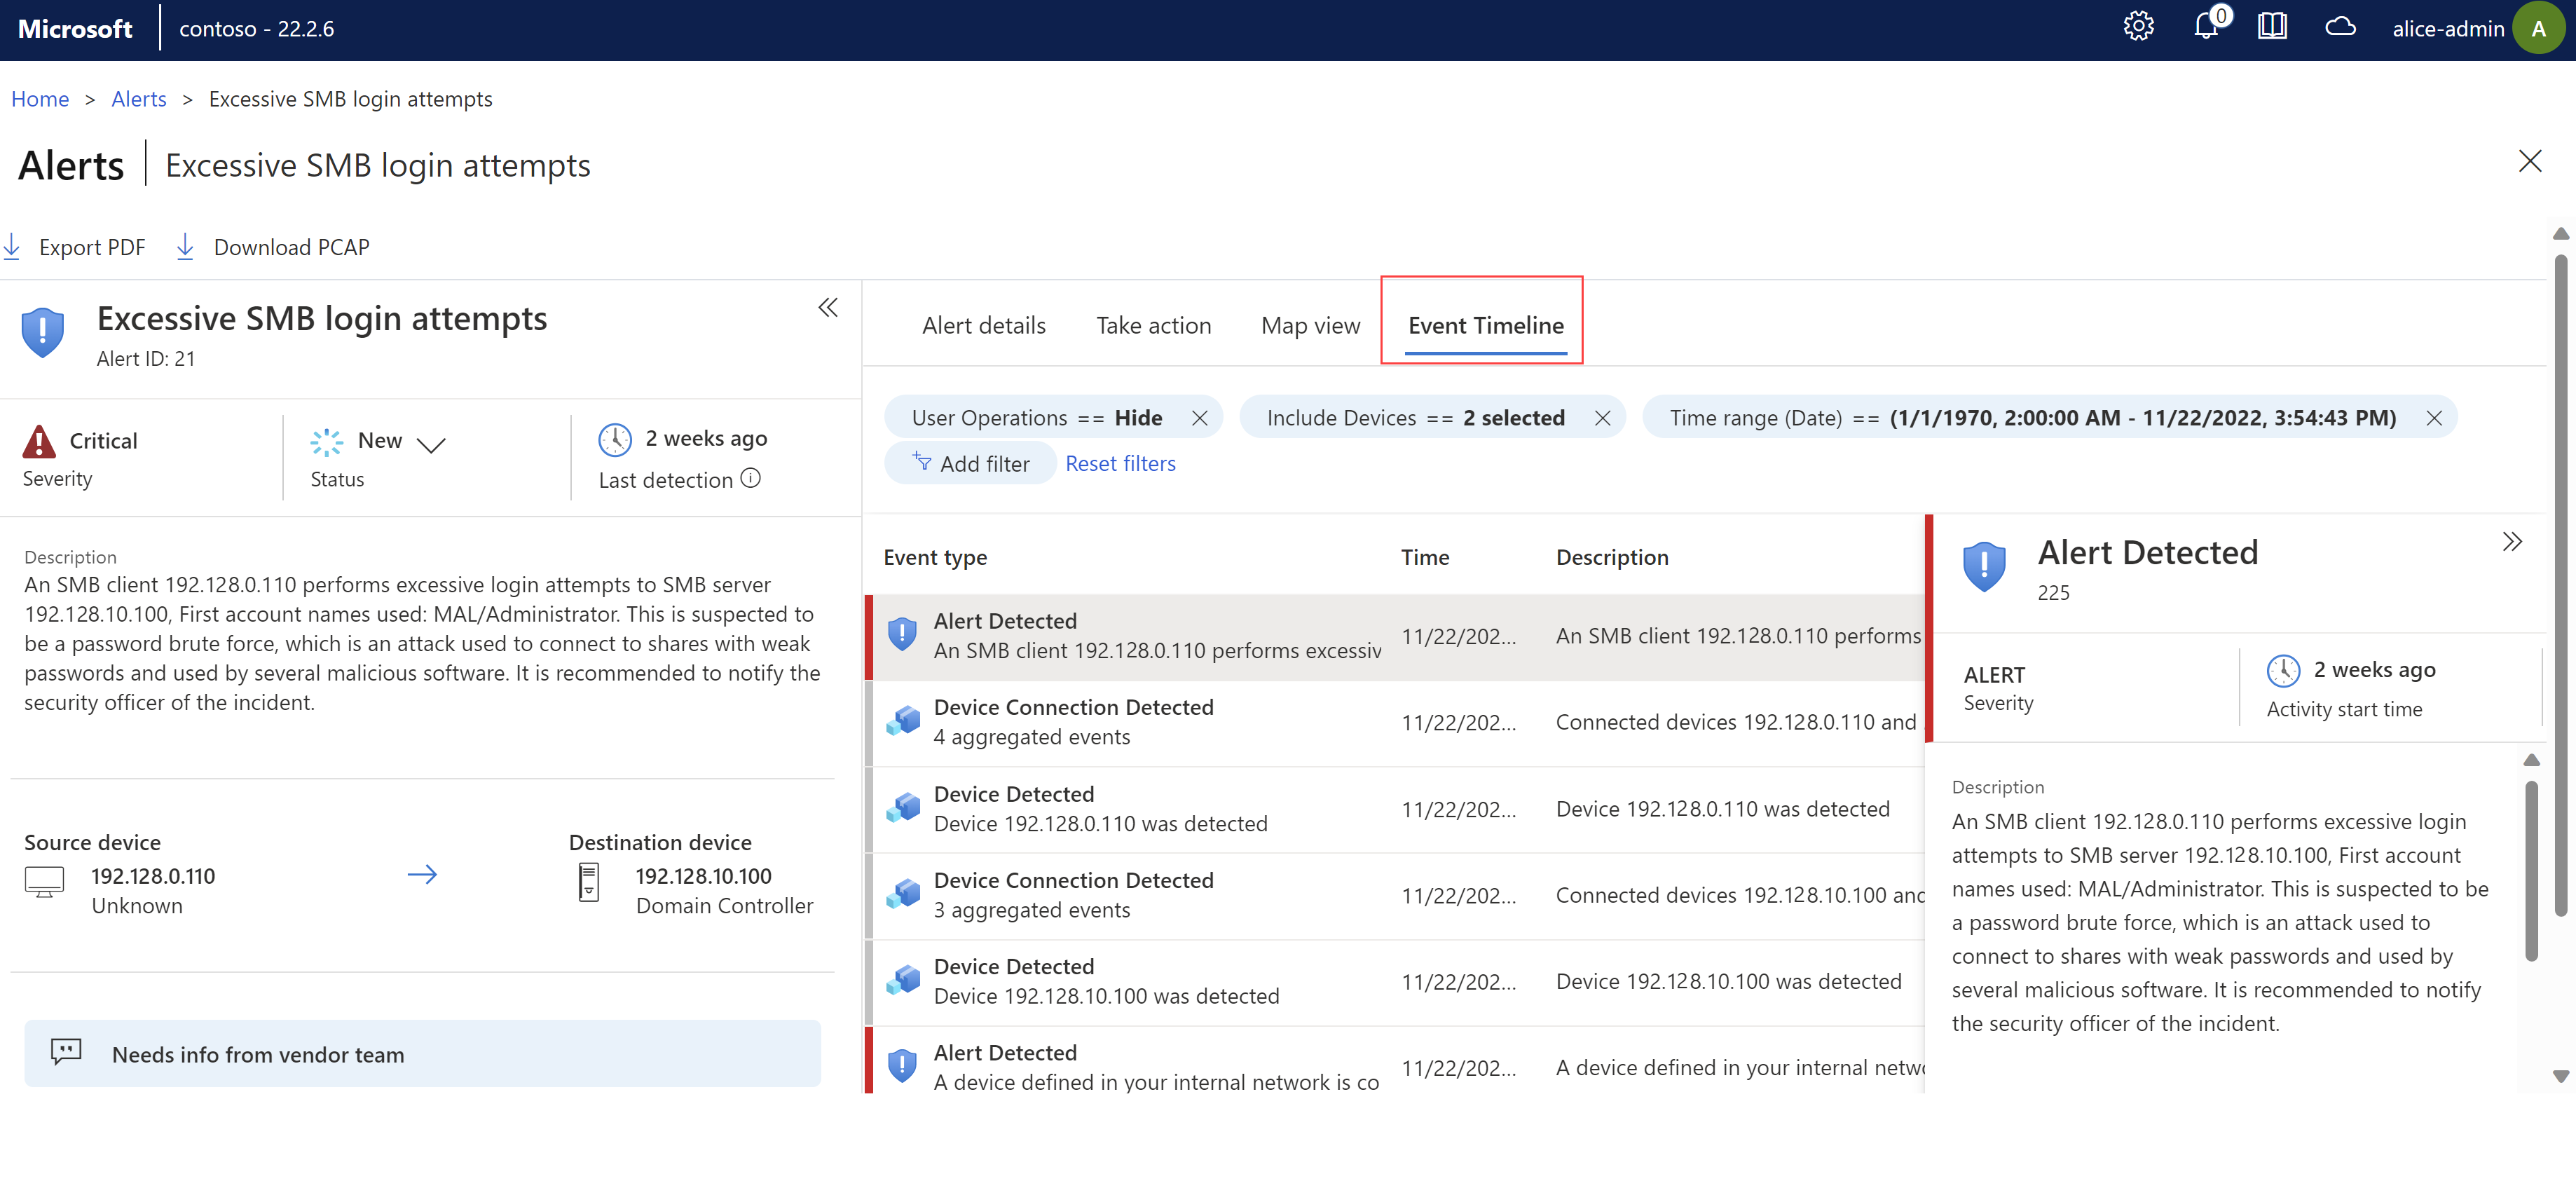
Event Timeline. View the event together with other recent activity on the related devices. Filter options to customize the data displayed. For example:
Manage alert status and triage alerts
Make sure to update your alert status once you've taken remediation steps so that the progress is recorded. You can update status for a single alert or for a selection of alerts in bulk.
Learn an alert to indicate to Defender for IoT that the detected network traffic is authorized. Learned alerts won't be triggered again the next time the same traffic is detected on your network. Mute an alert when learning isn't available and you want to ignore a specific scenario on your network.
For more information, see Alert statuses and triaging options.
To manage alert status:
Sign into your OT sensor console and select the Alerts page on the left.
Select one or more alerts in the grid whose status you want to update.
Use the toolbar
 Change Status button or the
Status option in the details pane on the right to update the alert status.
Change Status button or the
Status option in the details pane on the right to update the alert status.The
Status option is also available on the alert details page.
To learn one or more alerts:
Sign into your OT sensor console and select the Alerts page on the left, and then do one of the following:
- Select one or more learnable alerts in the grid and then select
 Learn in the toolbar.
 - On an alert details page, in the Take Action tab, select Learn.
- Select one or more learnable alerts in the grid and then select
To mute an alert:
- Sign into your OT sensor console and select the Alerts page on the left.
- Locate the alert you want to mute and open its alert details page.
- On the Take action tab, toggle on the Alert mute option.
To unlearn or unmute an alert:
- Sign into your OT sensor console and select the Alerts page on the left.
- Locate the alert you've learned or muted and open its alert details page.
- On the Take action tab, toggle off the Alert learn or Alert mute option.
After you unlearn or unmute an alert, alerts are re-triggered whenever the sensor senses the selected traffic combination.
Access alert PCAP data
You might want to access raw traffic files, also known as packet capture files or PCAP files as part of your investigation.
To access raw traffic files for your alert, select Download PCAP from the top-left corner of your alert details page:
For example:
The PCAP file is downloaded and your browser prompts you to open or save it locally.
Export alerts to CSV or PDF
You may want to export a selection of alerts to a CSV or PDF file for offline sharing and reporting.
- Export alerts to a CSV file from the main Alerts page. Export alerts one at a time or in bulk.
- Export alerts to a PDF file one at a time only, either from the main Alerts page or an alert details page.
To export alerts to a CSV file:
Sign into your OT sensor console and select the Alerts page on the left.
Use the search box and filter options to show only the alerts you want to export.
In the toolbar above the grid, select Export to CSV.
The file is generated, and you're prompted to open or save it locally.
To export an alert to a PDF file:
Sign into your OT sensor console and select the Alerts page on the left, and then do one of the following:
- On the Alerts page, select an alert and then select Export to PDF from the toolbar above the grid.
- On an alerts details page, select Export to PDF.
The file is generated, and you're prompted to save it locally.
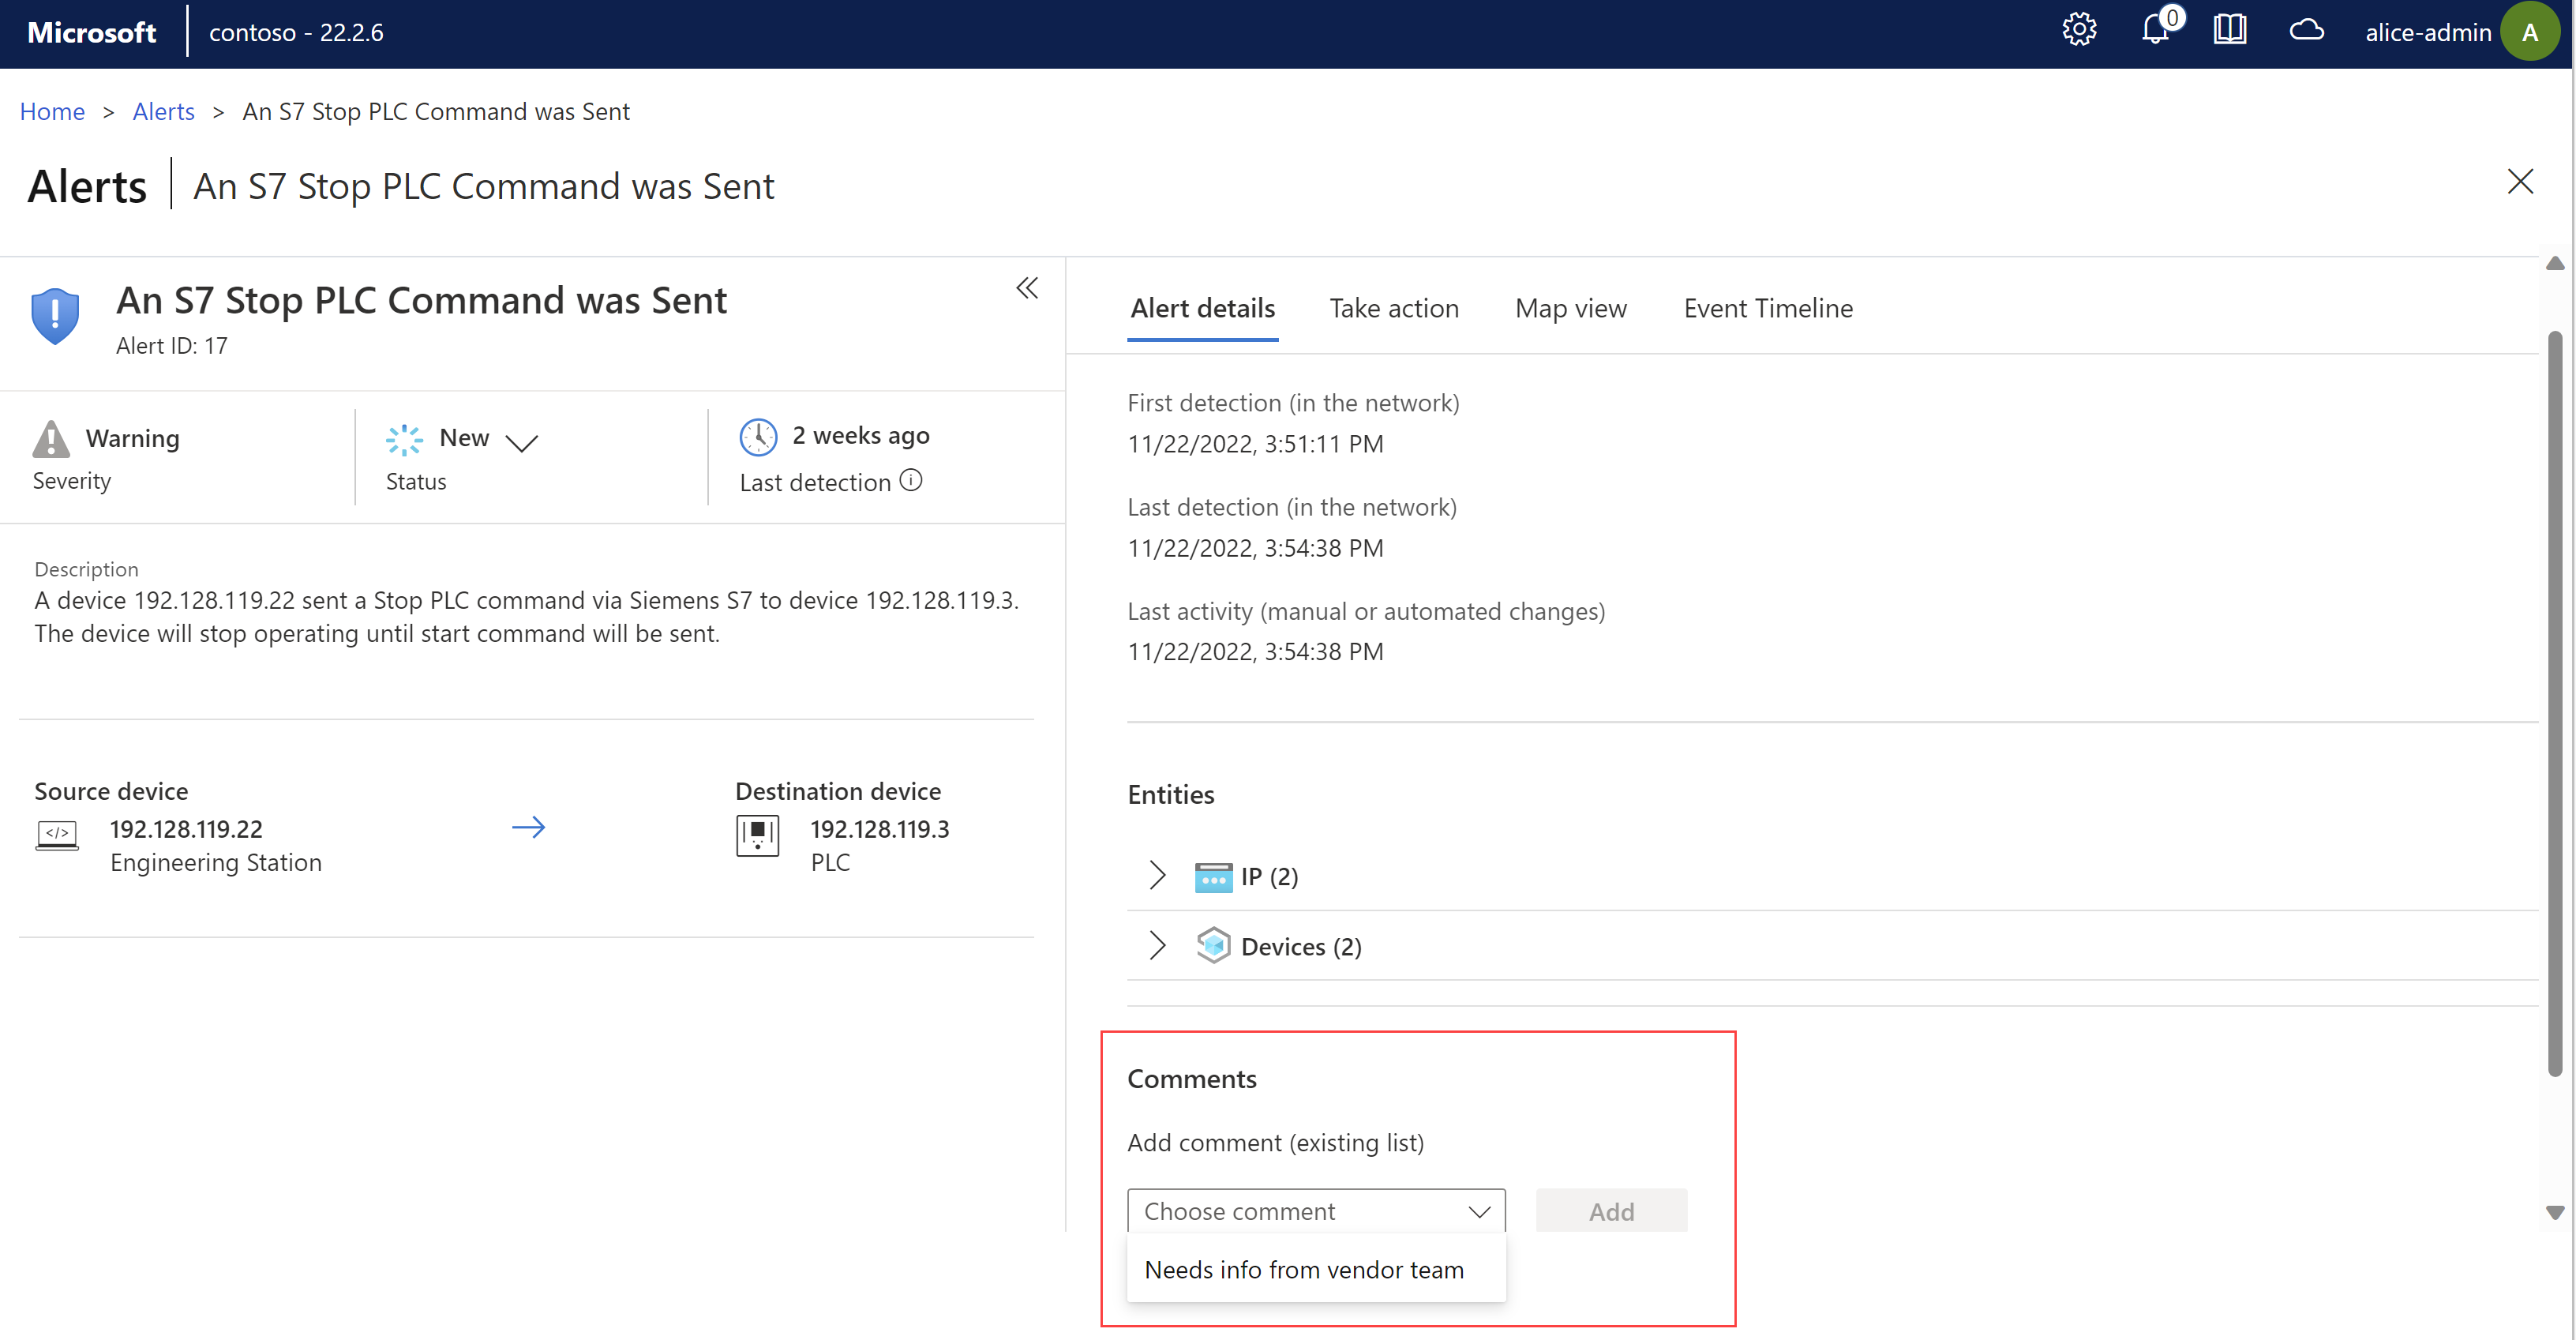
Add alert comments
Alert comments help you accelerate your investigation and remediation process by making communication between team members and recording data more efficient.
If your admin has created custom comments for your team to add to alerts, add them from the Comments section on an alert details page.
Sign into your OT sensor console and select the Alerts page on the left.
Locate the alert where you want to add a comment and open the alert details page.
From the Choose comment list, select the comment you want to add, and then select Add. For example:
For more information, see Accelerating OT alert workflows.
Next steps
Feedback
Coming soon: Throughout 2024 we will be phasing out GitHub Issues as the feedback mechanism for content and replacing it with a new feedback system. For more information see: https://aka.ms/ContentUserFeedback.
Submit and view feedback for