Configure Azure Front Door logs
Azure Front Door captures several types of logs. Logs can help you monitor your application, track requests, and debug your Front Door configuration. For more information about Azure Front Door's logs, see Monitor metrics and logs in Azure Front Door.
Access logs, health probe logs, and Web Application Firewall (WAF) logs aren't enabled by default. In this article, you learn how to enable diagnostic logs for your Azure Front Door profile.
Configure logs
Sign in to the Azure portal.
Search for Azure Front Door and then select the relevant Azure Front Door profile.
Within the profile, navigate to Monitoring, select Diagnostic Setting and then choose Add diagnostic setting.
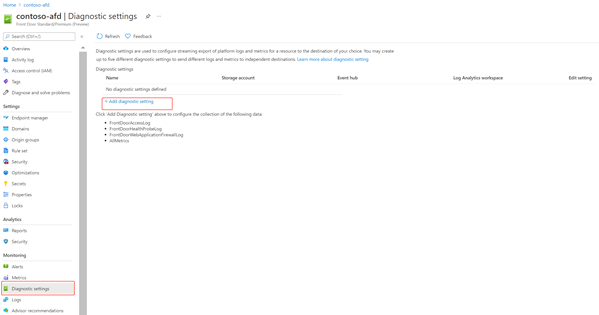
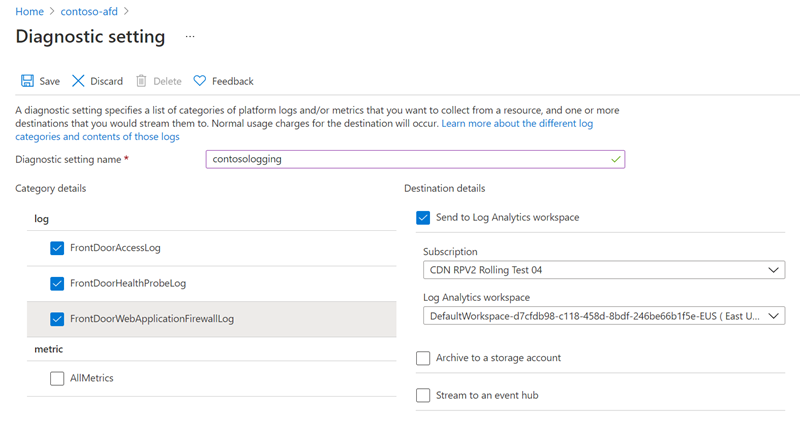
Under Diagnostic settings, enter a name for Diagnostic settings name.
Select the log options for FrontDoorAccessLog, FrontDoorHealthProbeLog, and FrontDoorWebApplicationFirewallLog.
Select the Destination details. The destination options are:
- Send to Log Analytics
- Azure Log Analytics in Azure Monitor is best used for general real-time monitoring and analysis of Azure Front Door performance.
- Select the Subscription and Log Analytics workspace.
- Archive to a storage account
- Storage accounts are best used for scenarios when logs are stored for a longer duration and are reviewed when needed.
- Select the Subscription and the Storage Account. and set Retention (days).
- Stream to an event hub
- Event hubs are a great option for integrating with other security information and event management (SIEM) tools or external data stores, such as Splunk, DataDog, or Sumo.
- Select the Subscription, Event hub namespace, Event hub name (optional), and Event hub policy name.
Tip
Microsoft recommends using Log Analytics for real-time monitoring and analysis of Azure Front Door performance.
- Send to Log Analytics
Select Save to begin logging.
View your activity logs
To view activity logs:
Select your Azure Front Door profile.
Select Activity log.
Choose a filtering scope and then select Apply.
Next steps
- Learn about Azure Front Door reports.
- Learn about Azure Front Door real time monitoring metrics.
Feedback
Coming soon: Throughout 2024 we will be phasing out GitHub Issues as the feedback mechanism for content and replacing it with a new feedback system. For more information see: https://aka.ms/ContentUserFeedback.
Submit and view feedback for