Tutorial: Investigate and detect threats for IoT devices
The integration between Microsoft Defender for IoT and Microsoft Sentinel enable SOC teams to efficiently and effectively detect and respond to security threats across your network. Enhance your security capabilities with the Microsoft Defender for IoT solution, a set of bundled content configured specifically for Defender for IoT data that includes analytics rules, workbooks, and playbooks.
In this tutorial, you:
- Install the Microsoft Defender for IoT solution in your Microsoft Sentinel workspace
- Learn how to investigate Defender for IoT alerts in Microsoft Sentinel incidents
- Learn about the analytics rules, workbooks, and playbooks deployed to your Microsoft Sentinel workspace with the Microsoft Defender for IoT solution
Important
The Microsoft Sentinel content hub experience is currently in PREVIEW, as is the Microsoft Defender for IoT solution. See the Supplemental Terms of Use for Microsoft Azure Previews for additional legal terms that apply to Azure features that are in beta, preview, or otherwise not yet released into general availability.
Prerequisites
Before you start, make sure you have:
Read and Write permissions on your Microsoft Sentinel workspace. For more information, see Permissions in Microsoft Sentinel.
Completed Tutorial: Connect Microsoft Defender for IoT with Microsoft Sentinel.
Install the Defender for IoT solution
Microsoft Sentinel solutions can help you onboard Microsoft Sentinel security content for a specific data connector using a single process.
The Microsoft Defender for IoT solution integrates Defender for IoT data with Microsoft Sentinel's security orchestration, automation, and response (SOAR) capabilities by providing out-of-the-box and optimized playbooks for automated response and prevention capabilities.
To install the solution:
In Microsoft Sentinel, under Content management, select Content hub and then locate the Microsoft Defender for IoT solution.
At the bottom right, select View details, and then Create. Select the subscription, resource group, and workspace where you want to install the solution, and then review the related security content that will be deployed.
When you're done, select Review + Create to install the solution.
For more information, see About Microsoft Sentinel content and solutions and Centrally discover and deploy out-of-the-box content and solutions.
Detect threats out-of-the-box with Defender for IoT data
The Microsoft Defender for IoT data connector includes a default Microsoft Security rule named Create incidents based on Azure Defender for IOT alerts, which automatically creates new incidents for any new Defender for IoT alerts detected.
The Microsoft Defender for IoT solution includes a more detailed set of out-of-the-box analytics rules, which are built specifically for Defender for IoT data and fine-tune the incidents created in Microsoft Sentinel for relevant alerts.
To use out-of-the-box Defender for IoT alerts:
On the Microsoft Sentinel Analytics page, search for and disable the Create incidents based on Azure Defender for IOT alerts rule. This step prevents duplicate incidents from being created in Microsoft Sentinel for the same alerts.
Search for and enable any of the following out-of-the-box analytics rules, installed with the Microsoft Defender for IoT solution:
Rule Name Description Illegal function codes for ICS/SCADA traffic Illegal function codes in supervisory control and data acquisition (SCADA) equipment may indicate one of the following:
- Improper application configuration, such as due to a firmware update or reinstallation.
- Malicious activity. For example, a cyber threat that attempts to use illegal values within a protocol to exploit a vulnerability in the programmable logic controller (PLC), such as a buffer overflow.Firmware update Unauthorized firmware updates may indicate malicious activity on the network, such as a cyber threat that attempts to manipulate PLC firmware to compromise PLC function. Unauthorized PLC changes Unauthorized changes to PLC ladder logic code may be one of the following:
- An indication of new functionality in the PLC.
- Improper configuration of an application, such as due to a firmware update or reinstallation.
- Malicious activity on the network, such as a cyber threat that attempts to manipulate PLC programming to compromise PLC function.PLC insecure key state The new mode may indicate that the PLC is not secure. Leaving the PLC in an insecure operating mode may allow adversaries to perform malicious activities on it, such as a program download.
If the PLC is compromised, devices and processes that interact with it may be impacted. which may affect overall system security and safety.PLC stop The PLC stop command may indicate an improper configuration of an application that has caused the PLC to stop functioning, or malicious activity on the network. For example, a cyber threat that attempts to manipulate PLC programming to affect the functionality of the network. Suspicious malware found in the network Suspicious malware found on the network indicates that suspicious malware is trying to compromise production. Multiple scans in the network Multiple scans on the network can be an indication of one of the following:
- A new device on the network
- New functionality of an existing device
- Misconfiguration of an application, such as due to a firmware update or reinstallation
- Malicious activity on the network for reconnaissanceInternet connectivity An OT device communicating with internet addresses may indicate an improper application configuration, such as anti-virus software attempting to download updates from an external server, or malicious activity on the network. Unauthorized device in the SCADA network An unauthorized device on the network may be a legitimate, new device recently installed on the network, or an indication of unauthorized or even malicious activity on the network, such as a cyber threat attempting to manipulate the SCADA network. Unauthorized DHCP configuration in the SCADA network An unauthorized DHCP configuration on the network may indicate a new, unauthorized device operating on the network.
This may be a legitimate, new device recently deployed on the network, or an indication of unauthorized or even malicious activity on the network, such as a cyber threat attempting to manipulate the SCADA network.Excessive login attempts Excessive sign in attempts may indicate improper service configuration, human error, or malicious activity on the network, such as a cyber threat attempting to manipulate the SCADA network. High bandwidth in the network An unusually high bandwidth may be an indication of a new service/process on the network, such as backup, or an indication of malicious activity on the network, such as a cyber threat attempting to manipulate the SCADA network. Denial of Service This alert detects attacks that would prevent the use or proper operation of the DCS system. Unauthorized remote access to the network Unauthorized remote access to the network can compromise the target device.
This means that if another device on the network is compromised, the target devices can be accessed remotely, increasing the attack surface.No traffic on Sensor Detected A sensor that no longer detects network traffic indicates that the system may be insecure.
Investigate Defender for IoT incidents
After you’ve configured your Defender for IoT data to trigger new incidents in Microsoft Sentinel, start investigating those incidents in Microsoft Sentinel as you would other incidents.
To investigate Microsoft Defender for IoT incidents:
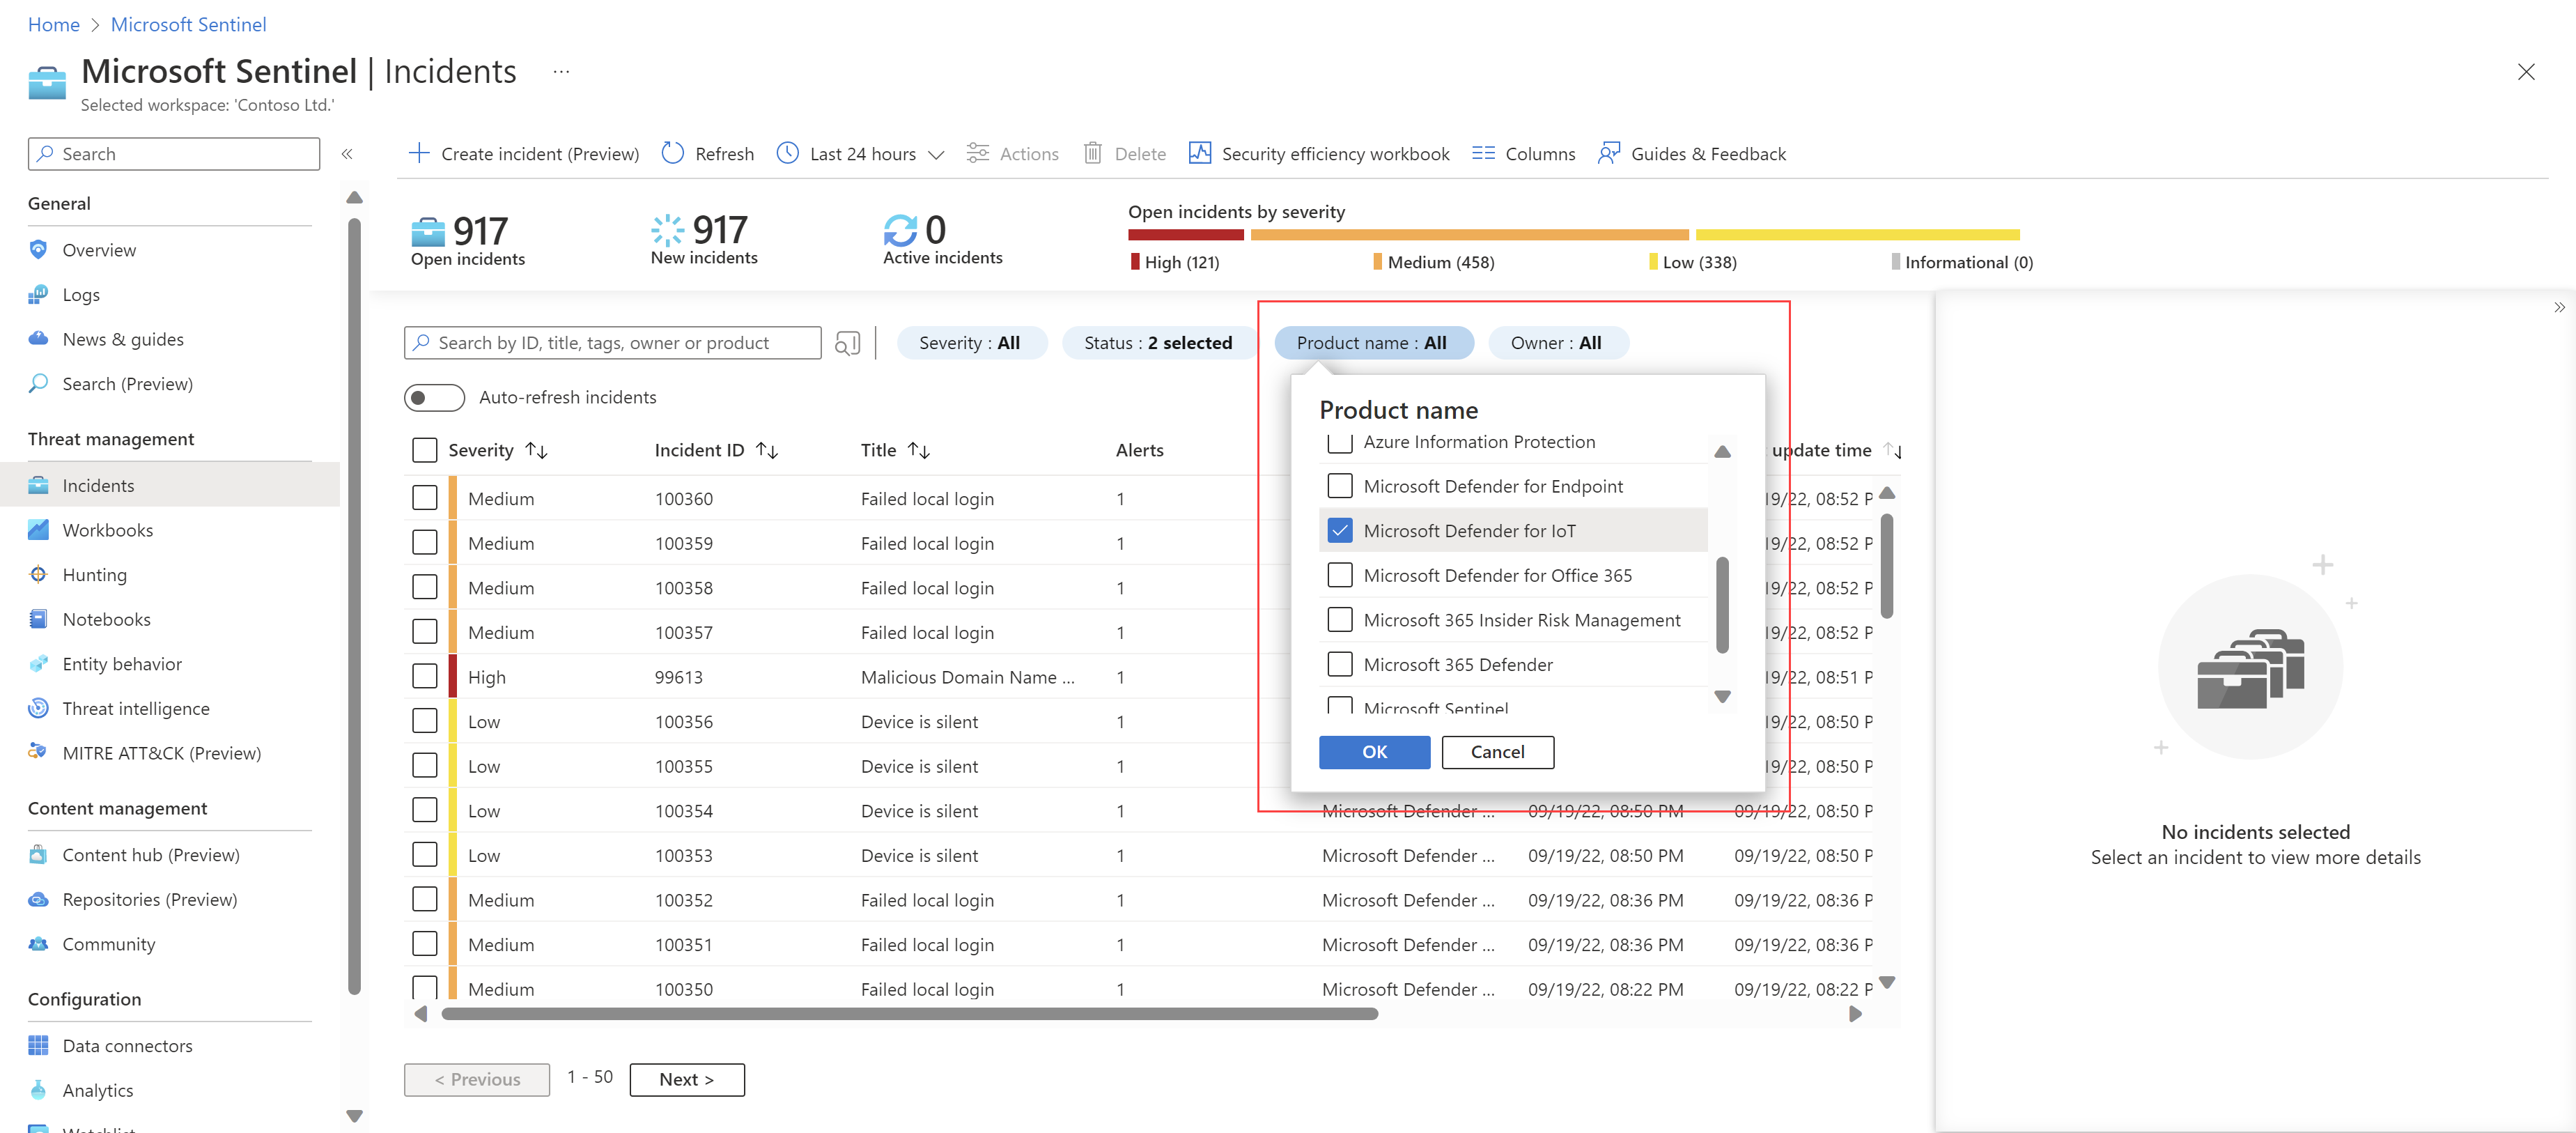
In Microsoft Sentinel, go to the Incidents page.
Above the incident grid, select the Product name filter and clear the Select all option. Then, select Microsoft Defender for IoT to view only incidents triggered by Defender for IoT alerts. For example:
Select a specific incident to begin your investigation.
In the incident details pane on the right, view details such as incident severity, a summary of the entities involved, any mapped MITRE ATT&CK tactics or techniques, and more. For example:

Select View full details to open the incident details page, where you can drill down even more. For example:
Understand the incident's business impact and physical location using details, like an IoT device's site, zone, sensor name, and device importance.
Learn about recommended remediation steps by selecting an alert in the incident timeline and viewing the Remediation steps area.
Select an IoT device entity from the Entities list to open its device entity page. For more information, see Investigate further with IoT device entities.


For more information, see Investigate incidents with Microsoft Sentinel.
Tip
To investigate the incident in Defender for IoT, select the Investigate in Microsoft Defender for IoT link at the top of the incident details pane on the Incidents page.
Investigate further with IoT device entities
When you are investigating an incident in Microsoft Sentinel and have the incident details pane open on the right, select an IoT device entity from the Entities list to view more details about the selected entity. Identify an IoT device by the IoT device icon: ![]()
If you don't see your IoT device entity right away, select View full details to open the full incident page, and then check the Entities tab. Select an IoT device entity to view more entity data, like basic device details, owner contact information, and a timeline of events that occurred on the device.
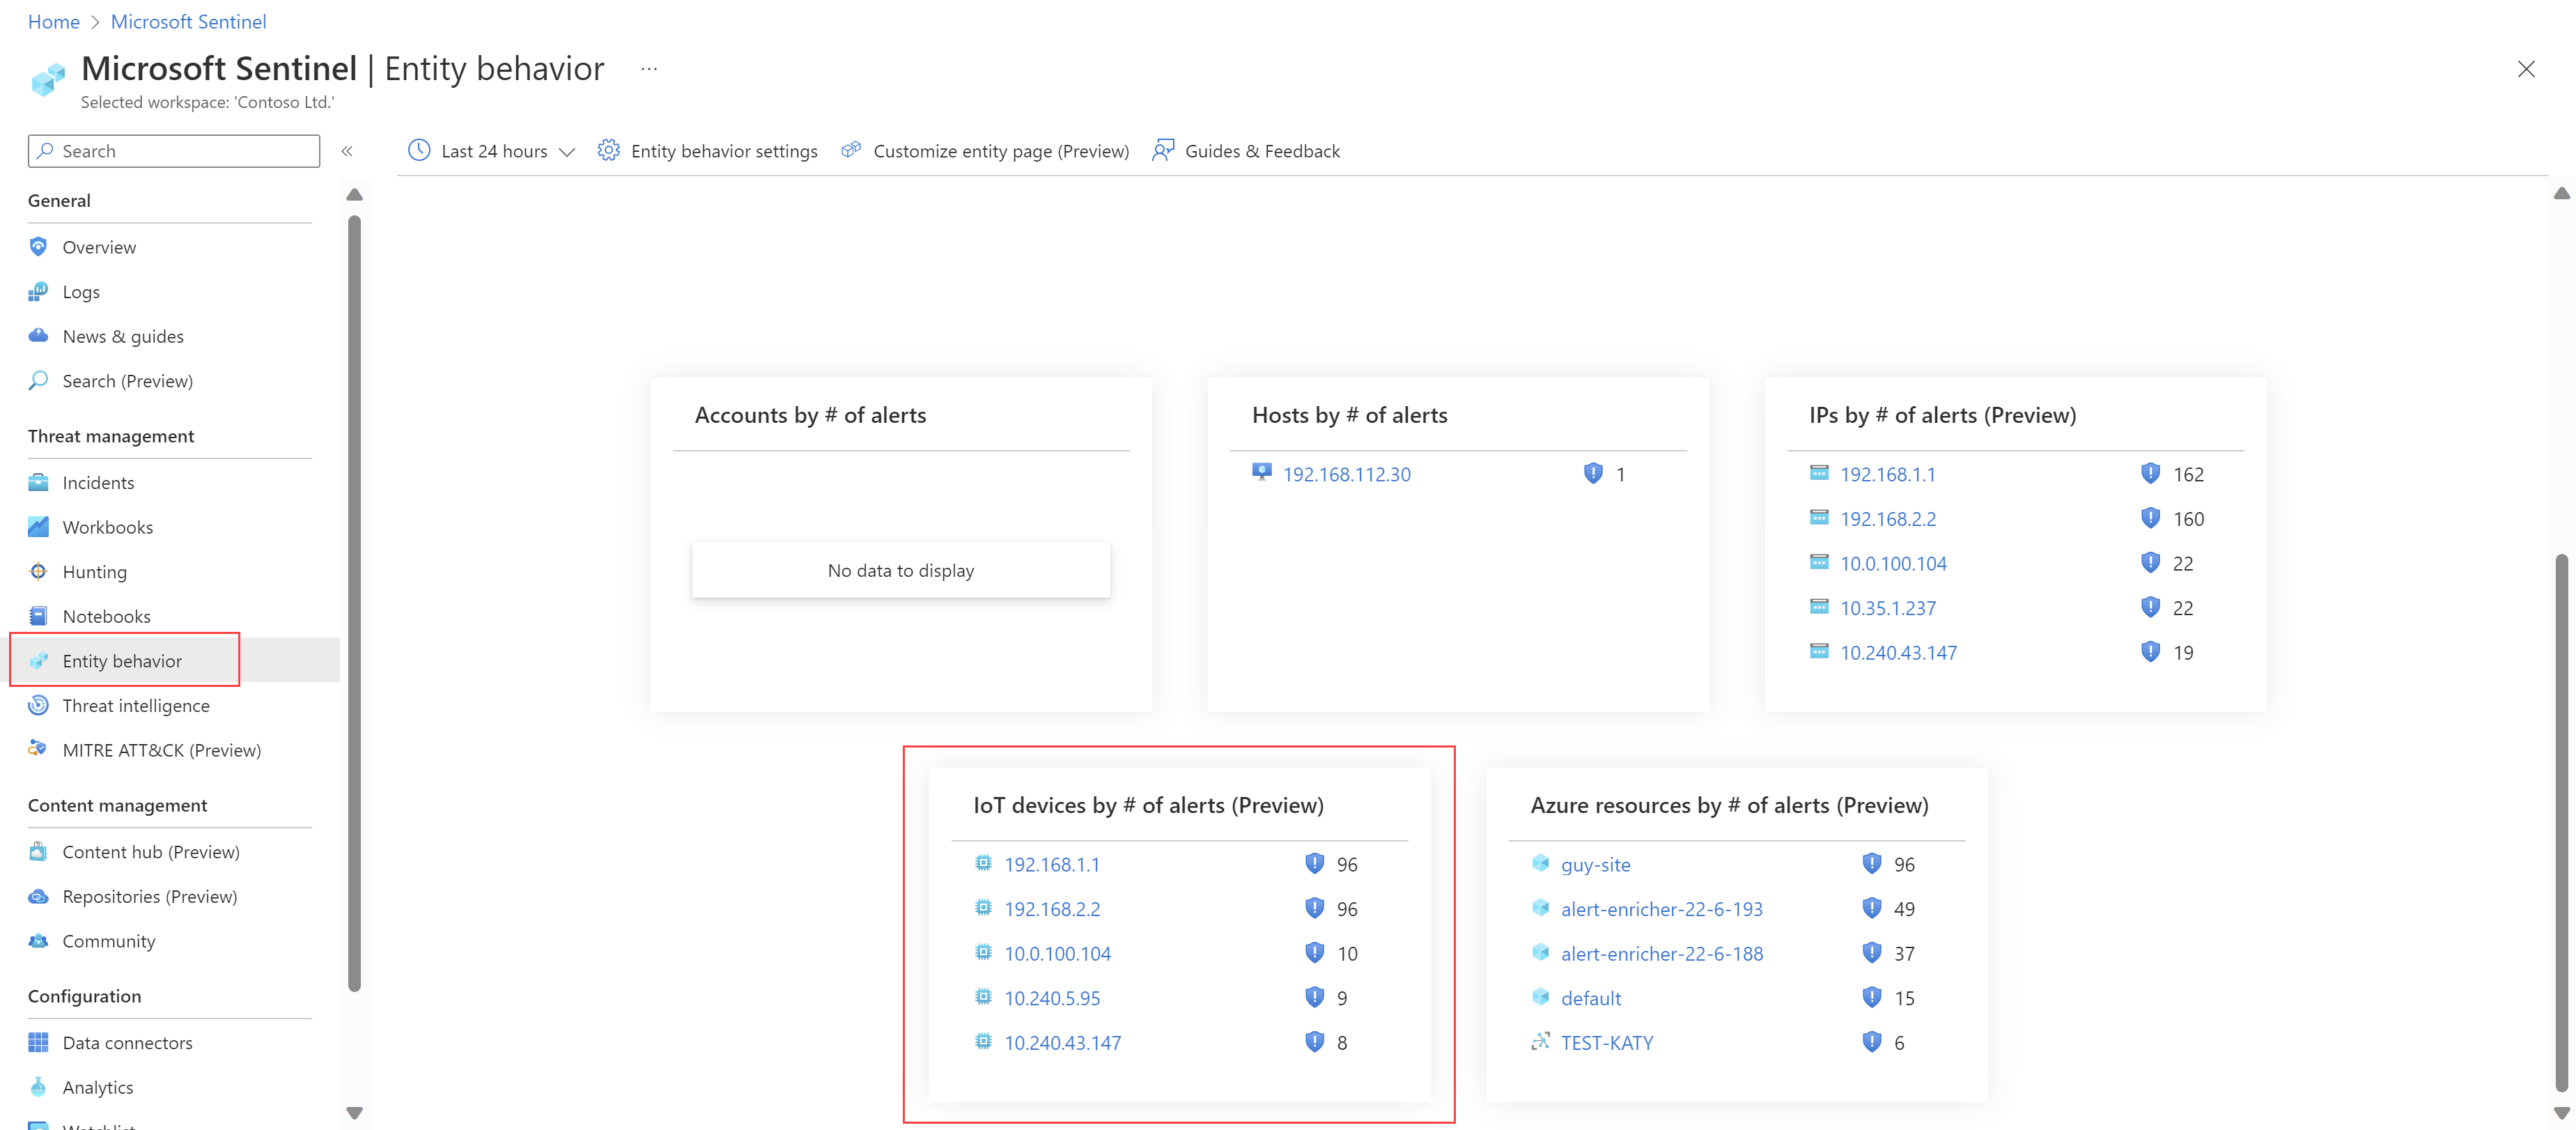
To drill down even further, select the IoT device entity link and open the device entity details page, or hunt for vulnerable devices on the Microsoft Sentinel Entity behavior page. For example, view the top five IoT devices with the highest number of alerts, or search for a device by IP address or device name:
For more information, see Investigate entities with entity pages in Microsoft Sentinel and Investigate incidents with Microsoft Sentinel.
Investigate the alert in Defender for IoT
To open an alert in Defender for IoT for further investigation, including the ability to access alert PCAP data, go to your incident details page and select Investigate in Microsoft Defender for IoT. For example:

The Defender for IoT alert details page opens for the related alert. For more information, see Investigate and respond to an OT network alert.
Visualize and monitor Defender for IoT data
To visualize and monitor your Defender for IoT data, use the workbooks deployed to your Microsoft Sentinel workspace as part of the Microsoft Defender for IoT solution.
The Defenders for IoT workbooks provide guided investigations for OT entities based on open incidents, alert notifications, and activities for OT assets. They also provide a hunting experience across the MITRE ATT&CK® framework for ICS, and are designed to enable analysts, security engineers, and MSSPs to gain situational awareness of OT security posture.
View workbooks in Microsoft Sentinel on the Threat management > Workbooks > My workbooks tab. For more information, see Visualize collected data.
The following table describes the workbooks included in the Microsoft Defender for IoT solution:
| Workbook | Description | Logs |
|---|---|---|
| Overview | Dashboard displaying a summary of key metrics for device inventory, threat detection and vulnerabilities. | Uses data from Azure Resource Graph (ARG) |
| Device Inventory | Displays data such as: OT device name, type, IP address, Mac address, Model, OS, Serial Number, Vendor, Protocols, Open alerts, and CVEs and recommendations per device. Can be filtered by site, zone, and sensor. | Uses data from Azure Resource Graph (ARG) |
| Incidents | Displays data such as: - Incident Metrics, Topmost Incident, Incident over time, Incident by Protocol, Incident by Device Type, Incident by Vendor, and Incident by IP address. - Incident by Severity, Incident Mean time to respond, Incident Mean time to resolve and Incident close reasons. |
Uses data from the following log: SecurityAlert |
| Alerts | Displays data such as: Alert Metrics, Top Alerts, Alert over time, Alert by Severity, Alert by Engine, Alert by Device Type, Alert by Vendor and Alert by IP address. | Uses data from Azure Resource Graph (ARG) |
| MITRE ATT&CK® for ICS | Displays data such as: Tactic Count, Tactic Details, Tactic over time, Technique Count. | Uses data from the following log: SecurityAlert |
| Vulnerabilities | Displays vulnerabilities and CVEs for vulnerable devices. Can be filtered by device site and CVE severity. | Uses data from Azure Resource Graph (ARG) |
Automate response to Defender for IoT alerts
Playbooks are collections of automated remediation actions that can be run from Microsoft Sentinel as a routine. A playbook can help automate and orchestrate your threat response; it can be run manually or set to run automatically in response to specific alerts or incidents, when triggered by an analytics rule or an automation rule, respectively.
The Microsoft Defender for IoT solution includes out-of-the-box playbooks that provide the following functionality:
- Automatically close incidents
- Send email notifications by production line
- Create a new ServiceNow ticket
- Update alert statuses in Defender for IoT
- Automate workflows for incidents with active CVEs
- Send email to the IoT/OT device owner
- Triage incidents involving highly important devices
Before using the out-of-the-box playbooks, make sure to perform the prerequisite steps as listed below.
For more information, see:
- Tutorial: Use playbooks with automation rules in Microsoft Sentinel
- Automate threat response with playbooks in Microsoft Sentinel
Playbook prerequisites
Before using the out-of-the-box playbooks, make sure you perform the following prerequisites, as needed for each playbook:
- Ensure valid playbook connections
- Add a required role to your subscription
- Connect your incidents, relevant analytics rules, and the playbook
Ensure valid playbook connections
This procedure helps ensure that each connection step in your playbook has valid connections, and is required for all solution playbooks.
To ensure your valid connections:
In Microsoft Sentinel, open the playbook from Automation > Active playbooks.
Select a playbook to open it as a Logic app.
With the playbook opened as a Logic app, select Logic app designer. Expand each step in the logic app to check for invalid connections, which are indicated by an orange warning triangle. For example:

Important
Make sure to expand each step in the logic app. Invalid connections may be hiding inside other steps.
Select Save.

Add a required role to your subscription
This procedure describes how to add a required role to the Azure subscription where the playbook is installed, and is required only for the following playbooks:
- AD4IoT-AutoAlertStatusSync
- AD4IoT-CVEAutoWorkflow
- AD4IoT-SendEmailtoIoTOwner
- AD4IoT-AutoTriageIncident
Required roles differ per playbook, but the steps remain the same.
To add a required role to your subscription:
In Microsoft Sentinel, open the playbook from Automation > Active playbooks.
Select a playbook to open it as a Logic app.
With the playbook opened as a Logic app, select Identity > System assigned, and then in the Permissions area, select the Azure role assignments button.
In the Azure role assignments page, select Add role assignment.
In the Add role assignment pane:
Define the Scope as Subscription.
From the dropdown, select the Subscription where your playbook is installed.
From the Role dropdown, select one of the following roles, depending on the playbook you’re working with:
Playbook name Role AD4IoT-AutoAlertStatusSync Security Admin AD4IoT-CVEAutoWorkflow Reader AD4IoT-SendEmailtoIoTOwner Reader AD4IoT-AutoTriageIncident Reader
When you're done, select Save.
Connect your incidents, relevant analytics rules, and the playbook
This procedure describes how to configure a Microsoft Sentinel analytics rule to automatically run your playbooks based on an incident trigger, and is required for all solution playbooks.
To add your analytics rule:
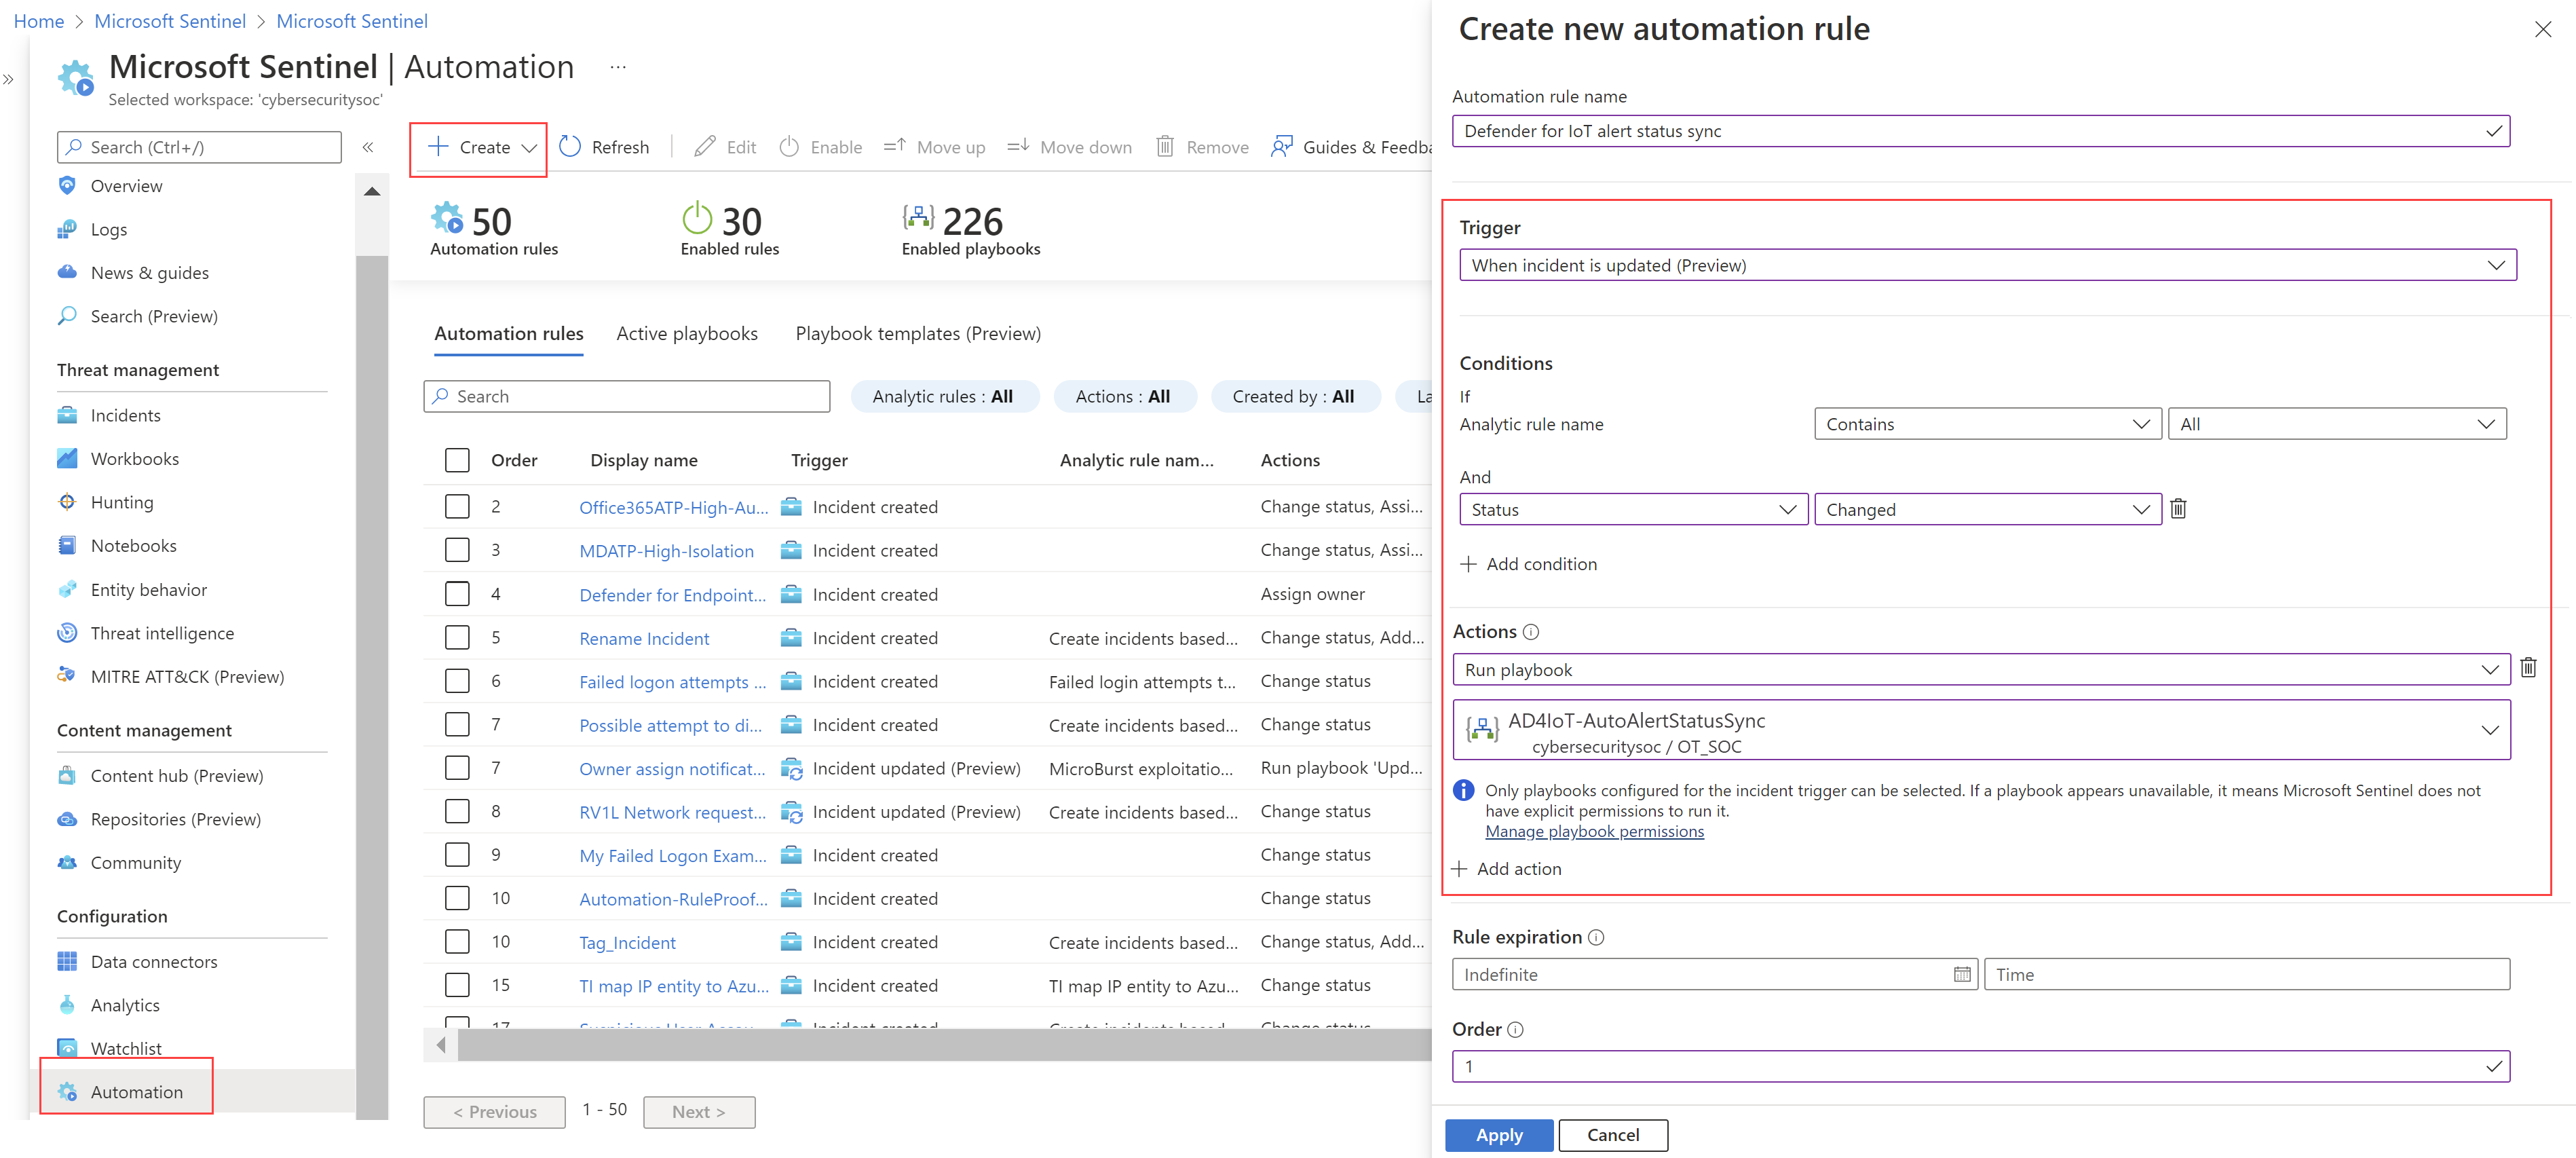
In Microsoft Sentinel, go to Automation > Automation rules.
To create a new automation rule, select Create > Automation rule.
In the Trigger field, select one of the following triggers, depending on the playbook you’re working with:
- The AD4IoT-AutoAlertStatusSync playbook: Select the When an incident is updated trigger
- All other solution playbooks: Select the When an incident is created trigger
In the Conditions area, select If > Analytic rule name > Contains, and then select the specific analytics rules relevant for Defender for IoT in your organization.
For example:
You may be using out-of-the-box analytics rules, or you may have modified the out-of-the-box content, or created your own. For more information, see Detect threats out-of-the-box with Defender for IoT data.
In the Actions area, select Run playbook > playbook name.
Select Run.

Tip
You can also manually run a playbook on demand. This can be useful in situations where you want more control over orchestration and response processes. For more information, see Run a playbook on demand.
Automatically close incidents
Playbook name: AD4IoT-AutoCloseIncidents
In some cases, maintenance activities generate alerts in Microsoft Sentinel that can distract a SOC team from handling the real problems. This playbook automatically closes incidents created from such alerts during a specified maintenance period, explicitly parsing the IoT device entity fields.
To use this playbook:
- Enter the relevant time period when the maintenance is expected to occur, and the IP addresses of any relevant assets, such as listed in an Excel file.
- Create a watchlist that includes all the asset IP addresses on which alerts should be handled automatically.
Send email notifications by production line
Playbook name: AD4IoT-MailByProductionLine
This playbook sends mail to notify specific stakeholders about alerts and events that occur in your environment.
For example, when you have specific security teams assigned to specific product lines or geographic locations, you'll want that team to be notified about alerts that are relevant to their responsibilities.
To use this playbook, create a watchlist that maps between the sensor names and the mailing addresses of each of the stakeholders you want to alert.
Create a new ServiceNow ticket
Playbook name: AD4IoT-NewAssetServiceNowTicket
Typically, the entity authorized to program a PLC is the Engineering Workstation. Therefore, attackers might create new Engineering Workstations in order to create malicious PLC programming.
This playbook opens a ticket in ServiceNow each time a new Engineering Workstation is detected, explicitly parsing the IoT device entity fields.
Update alert statuses in Defender for IoT
Playbook name: AD4IoT-AutoAlertStatusSync
This playbook updates alert statuses in Defender for IoT whenever a related alert in Microsoft Sentinel has a Status update.
This synchronization overrides any status defined in Defender for IoT, in the Azure portal or the sensor console, so that the alert statuses match that of the related incident.
Automate workflows for incidents with active CVEs
Playbook name: AD4IoT-CVEAutoWorkflow
This playbook adds active CVEs into the incident comments of affected devices. An automated triage is performed if the CVE is critical, and an email notification is sent to the device owner, as defined on the site level in Defender for IoT.
To add a device owner, edit the site owner on the Sites and sensors page in Defender for IoT. For more information, see Site management options from the Azure portal.
Send email to the IoT/OT device owner
Playbook name: AD4IoT-SendEmailtoIoTOwner
This playbook sends an email with the incident details to the device owner as defined on the site level in Defender for IoT, so that they can start investigating, even responding directly from the automated email. Response options include:
Yes this is expected. Select this option to close the incident.
No this is NOT expected. Select this option to keep the incident active, increase the severity, and add a confirmation tag to the incident.
The incident is automatically updated based on the response selected by the device owner.
To add a device owner, edit the site owner on the Sites and sensors page in Defender for IoT. For more information, see Site management options from the Azure portal.
Triage incidents involving highly important devices
Playbook name: AD4IoT-AutoTriageIncident
This playbook updates the incident severity according to the importance level of the devices involved.
Next steps
For more information, see our blog: Defending Critical Infrastructure with the Microsoft Sentinel: IT/OT Threat Monitoring Solution