Note
Access to this page requires authorization. You can try signing in or changing directories.
Access to this page requires authorization. You can try changing directories.
By understanding how your blobs and containers are stored, organized, and used in production, you can better optimize the tradeoffs between cost and performance.
This tutorial shows you how to generate and visualize statistics such as data growth over time, data added over time, number of files modified, blob snapshot sizes, access patterns over each tier, and how data is distributed both currently and over time (For example: data across tiers, file types, in containers, and blob types).
In this tutorial, you learn how to:
- Generate a blob inventory report
- Set up a Synapse workspace
- Set up Synapse Studio
- Generate analytic data in Synapse Studio
- Visualize results in Power BI
Prerequisites
An Azure subscription - create an account for free
An Azure storage account - create a storage account
Make sure that your user identity has the Storage Blob Data Contributor role assigned to it.
Generate an inventory report
Enable blob inventory reports for your storage account. See Enable Azure Storage blob inventory reports.
You might have to wait up to 24 hours after enabling inventory reports for your first report to be generated.
Set up a Synapse workspace
Create an Azure Synapse workspace. See Create an Azure Synapse workspace.
Note
As part of creating the workspace, you'll create a storage account that has a hierarchical namespace. Azure Synapse stores Spark tables and application logs to this account. Azure Synapse refers to this account as the primary storage account. To avoid confusion, this article uses the term inventory report account to refer to the account which contains inventory reports.
In the Synapse workspace, assign the Contributor role to your user identity. See Azure RBAC: Owner role for the workspace.
Give the Synapse workspace permission to access the inventory reports in your storage account by navigating to your inventory report account, and then assigning the Storage Blob Data Contributor role to the system managed identity of the workspace. See Assign Azure roles using the Azure portal.
Navigate to primary storage account and assign the Blob Storage Contributor role to your user identity.
Set up Synapse Studio
Open your Synapse workspace in Synapse Studio. See Open Synapse Studio.
In Synapse Studio, Make sure that your identity is assigned the role of Synapse Administrator. See Synapse RBAC: Synapse Administrator role for the workspace.
Create an Apache Spark pool. See Create a serverless Apache Spark pool.
Set up and run the sample notebook
In this section, you'll generate statistical data that you'll visualize in a report. To simplify this tutorial, this section uses a sample configuration file and a sample PySpark notebook. The notebook contains a collection of queries that execute in Azure Synapse Studio.
Modify and upload the sample configuration file
Download the BlobInventoryStorageAccountConfiguration.json file.
Update the following placeholders of that file:
Set
storageAccountNameto the name of your inventory report account.Set
destinationContainerto the name of the container that holds the inventory reports.Set
blobInventoryRuleNameto the name of the inventory report rule that has generated the results that you'd like to analyze.Set
accessKeyto the account key of the inventory report account.
Upload this file to the container in your primary storage account that you specified when you created the Synapse workspace.
Import the sample PySpark notebook
Download the ReportAnalysis.ipynb sample notebook.
Note
Make sure to save this file with the
.ipynbextension.Open your Synapse workspace in Synapse Studio. See Open Synapse Studio.
In Synapse Studio, select the Develop tab.
Select the plus sign (+) to add an item.
Select Import, browse to the sample file that you downloaded, select that file, and select Open.
The Properties dialog box appears.
In the Properties dialog box, select the Configure session link.
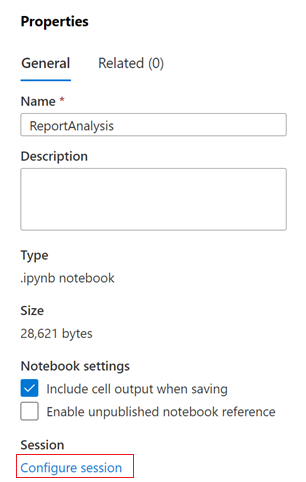
The Configure session dialog box opens.
In the Attach to drop-down list of the Configure session dialog box, select the Spark pool that you created earlier in this article. Then, select the Apply button.
Modify the Python notebook
In the first cell of the Python notebook, set the value of the
storage_accountvariable to the name of the primary storage account.Update the value of the
container_namevariable to the name of the container in that account that you specified when you created the Synapse workspace.Select the Publish button.
Run the PySpark notebook
In the PySpark notebook, select Run all.
It will take a few minutes to start the Spark session and another few minutes to process the inventory reports. The first run could take a while if there are numerous inventory reports to process. Subsequent runs will only process the new inventory reports created since the last run.
Note
If you make any changes to the notebook will the notebook is running, make sure to publish those changes by using the Publish button.
Verify that the notebook ran successfully by selecting the Data tab.
A database named reportdata should appear in the Workspace tab of the Data pane. If this database doesn't appear, then you might have to refresh the web page.
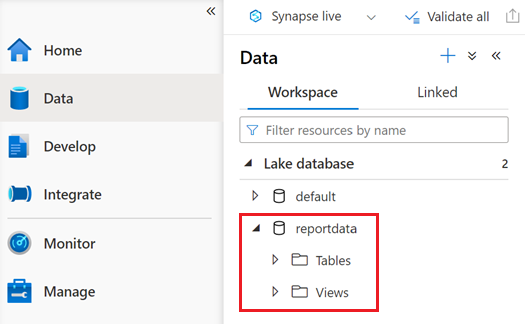
The database contains a set of tables. Each table contains information obtained by running the queries from the PySpark notebook.
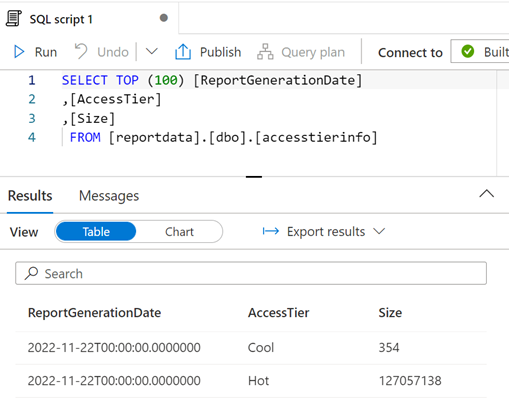
To examine the contents of a table, expand the Tables folder of the reportdata database. Then, right-click a table, select Select SQL script, and then select Select TOP 100 rows.
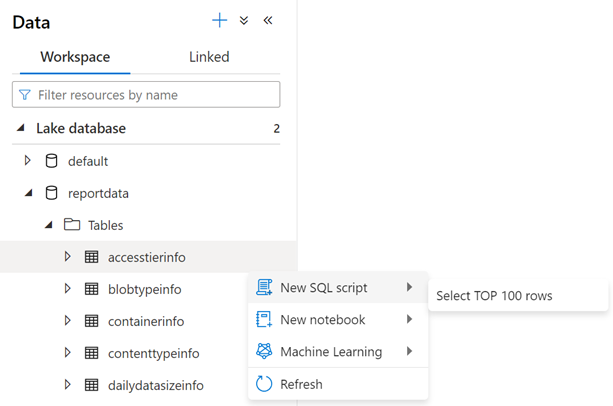
You can modify the query as needed and then select Run to view the results.
Visualize the data
Download the ReportAnalysis.pbit sample report file.
Open Power BI Desktop. For installation guidance, see Get Power BI Desktop.
In Power BI, select File, Open report, and then Browse reports.
In the Open dialog box, change the file type to Power BI template files (*.pbit).
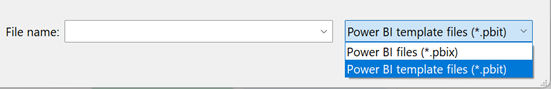
Browse to the location of the ReportAnalysis.pbit file that you downloaded, and then select Open.
A dialog box appears which asks you to provide the name of the Synapse workspace and the data base name.
In the dialog box, set the synapse_workspace_name field to the workspace name and set the database_name field to
reportdata. Then, select the Load button.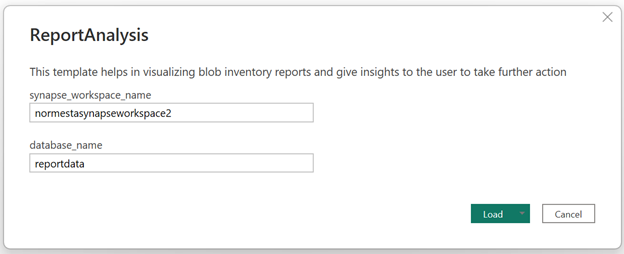
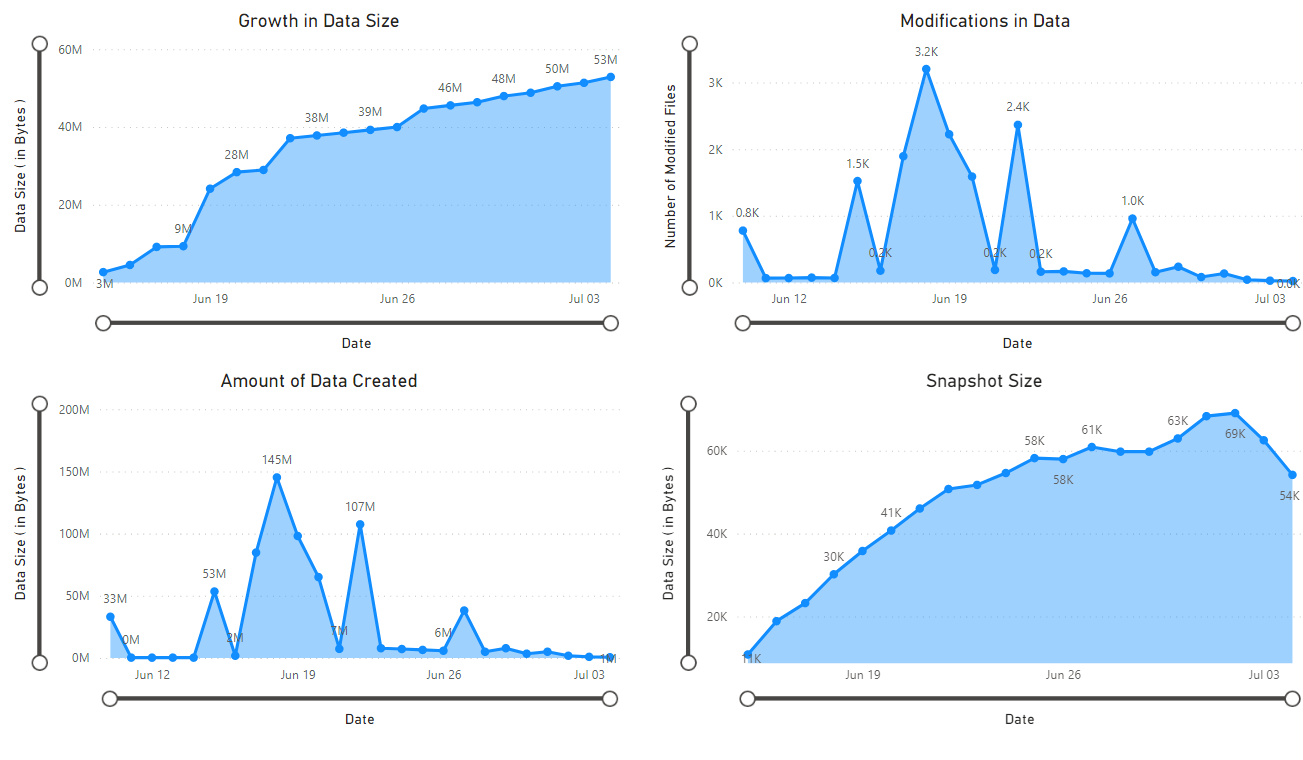
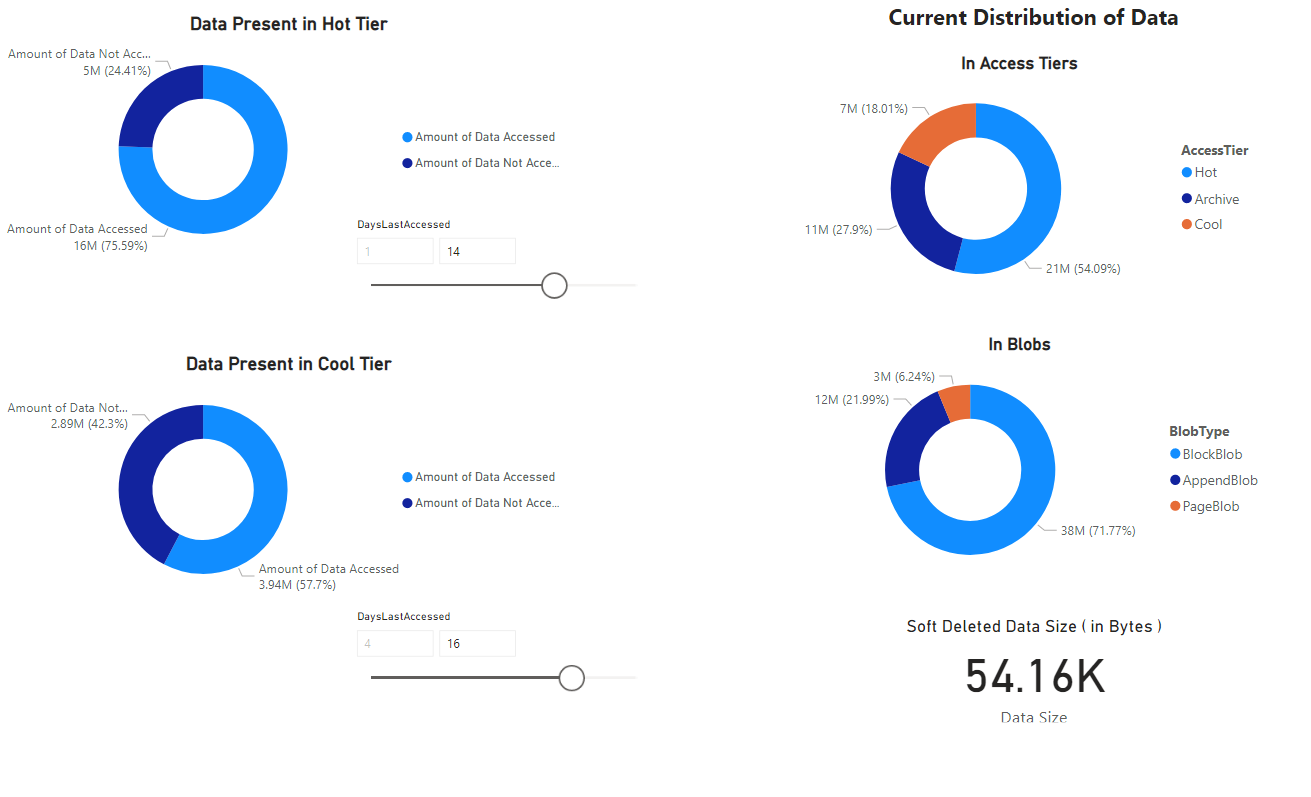
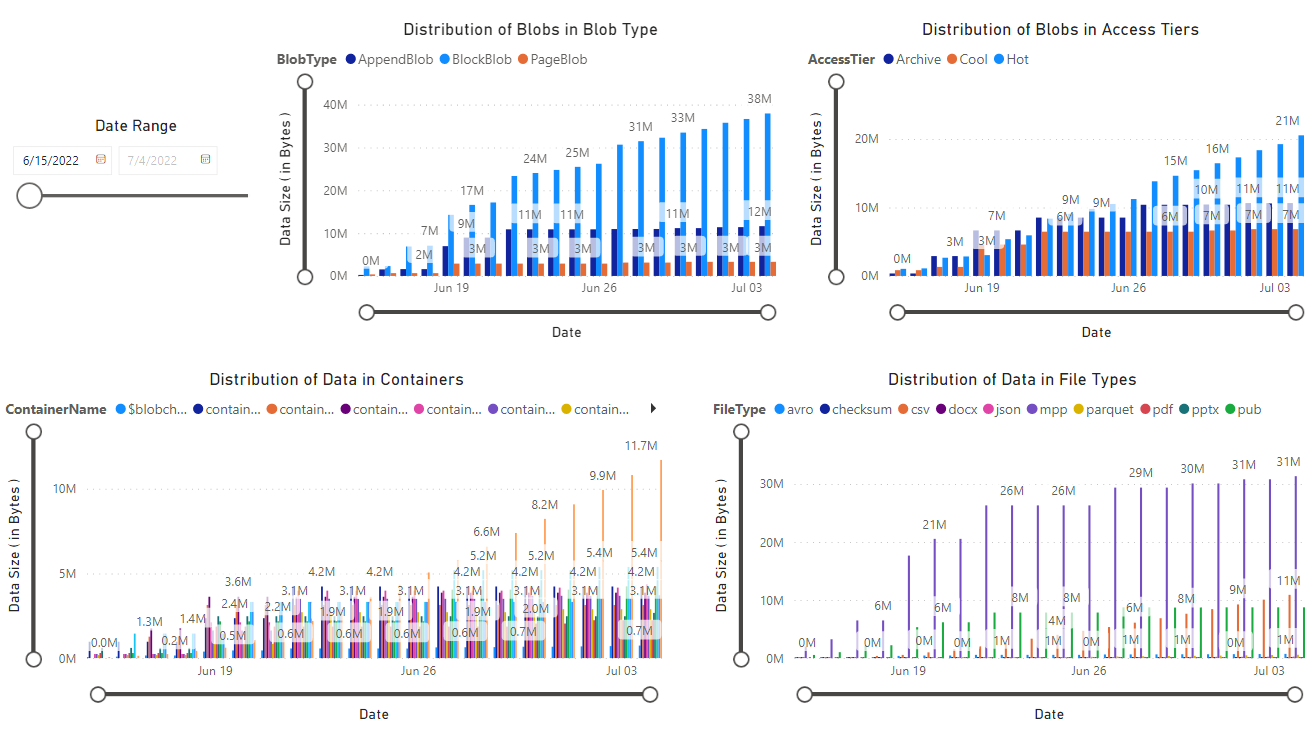
A report appears which provides visualizations of the data retrieved by the notebook. The following images show the types of the charts and graphs that appear in this report.
Next steps
Set up an Azure Synapse pipeline to keep running your notebook at regular intervals. That way you can process new inventory reports as they're created. After the initial run, each of the next runs will analyze incremental data and then update the tables with the results of that analysis. For guidance, see Integrate with pipelines.
Learn about ways to analyze individual containers in your storage account. See these articles:
Calculate blob count and total size per container using Azure Storage inventory
Tutorial: Calculate container statistics by using Databricks
Learn about ways to optimize your costs based on the analysis of your blobs and containers. See these articles:
Plan and manage costs for Azure Blob Storage