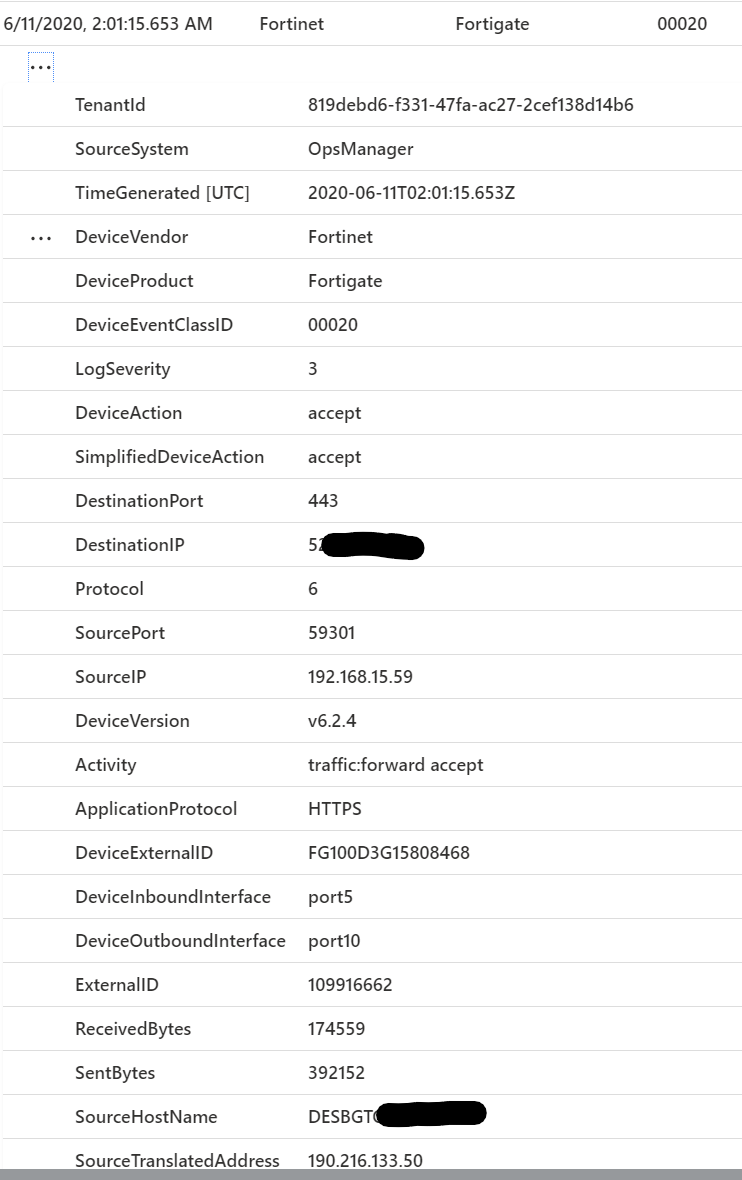
I have two different fortigate that stream logs to a CEF collector (linux oms agent). The agent relays the info to logs analytics workspace that has azure sentinel and it does process them. When querying the logs I do not have a way to know from which appliance the event is coming. When I capture what the fortinet is sending (at the cef collector with tcpdump) something similar to this appears:
Jun 10 22:12:21 APPLIANCE_NAME CEF:0|Fortinet|Fortigate|v6.2.4|00013|traffic:forward close|3|deviceExternalId=FG100D3G15808468 FTNTFGTlogid=0000000013 cat=traffic:forward FTNTFGTsubtype=forward FTNTFGTlevel=notice FTNTFGTvd=root FTNTFGTeventtime=1591845141442844111 FTNTFGTtz=-0500 src=192.168.12.7 spt=59648 deviceInboundInterface=port3 FTNTFGTsrcintfrole=undefined dst=99.99.99.99 dpt=995 deviceOutboundInterface=port10 FTNTFGTdstintfrole=wan FTNTFGTsrcuuid=2819709e-a92c-51e7-aaee-8d5fe21947ab FTNTFGTdstuuid=144dd486-1a2e-51e5-ae3c-46083ccbcd10 externalId=110369543 proto=6 act=close FTNTFGTpolicyid=180 FTNTFGTpolicytype=policy FTNTFGTpoluuid=be9f5024-50d3-51e9-ba7c-584c1a07444f app=POP3S FTNTFGTdstcountry=United States FTNTFGTsrccountry=Reserved FTNTFGTtrandisp=snat sourceTranslatedAddress=88.88.88.88 sourceTranslatedPort=59648 FTNTFGTappid=27561 FTNTFGTapp=POP3S FTNTFGTappcat=Email FTNTFGTapprisk=medium FTNTFGTapplist=SUP_PM_QA_TRAIN FTNTFGTappact=detected FTNTFGTduration=4 out=1503 in=1236 FTNTFGTsentpkt=18 FTNTFGTrcvdpkt=17 FTNTFGTutmaction=allow FTNTFGTcountapp=1
but APPLIANCE_NAME and IP is not recorded in the event that appears in the logs analytcis workspace
Is there any way to display that info?


