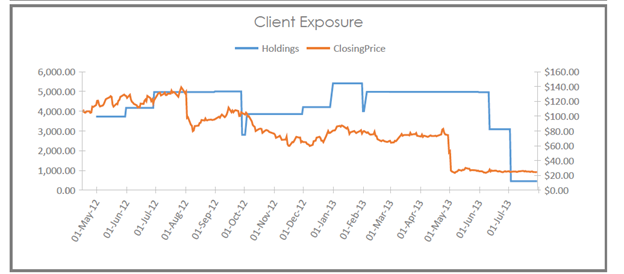
I have a multi axis chart in a fairly complex Access Report. I built the report in 2020 and it worked well (see image of chart below) but now the chart has been shrunk vertically and is not usable.
I have seen references to Display Scaling Settings (not 100%) on pc being an issue, but I checked and my display scaling setting is 100%. I am operating a Windows 10 laptop with regular updates.
My MS office license is Microsoft 365 and my Office 365 apps have been re-installed NUMEROUS times in 2021 by MS Support in order to address a different MS Excel issue.
Here is the way the chart looked previously:
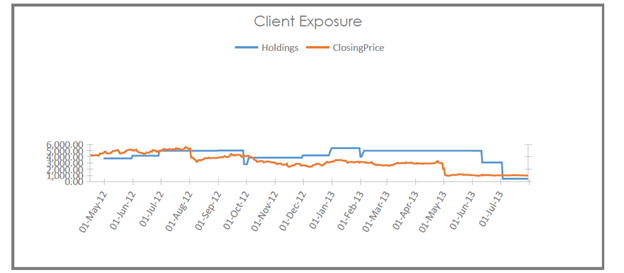
This is how the chart looks now:
I guess I have two questions:
- What happened/why did this happen? (I did not edit the chart)
- What can I do to fix this?
Thanks
DGP
' cx='32' cy='32' r='32' /%3E%3Ctext x='50%25' y='55%25' dominant-baseline='middle' text-anchor='middle' fill='%23FFF' %3ED%3C/text%3E%3C/svg%3E)