Hello @Rohit , @Ayyappan, Jayarajkumar ,
In additional to @Leon Laude response.
You can find a Guide on Monitoring Azure Databricks on the Azure Architecture Center, explaining the concepts used in this article - Monitoring And Logging In Azure Databricks With Azure Log Analytics And Grafana.
To provide full data collection, we combine the Spark monitoring library with a custom log4j.properties configuration. The build of the monitoring library for Spark 2.4 and the installation in Databricks is automated through the scripts referenced in the tutorial and available at https://github.com/algattik/databricks-monitoring-tutorial/.
Azure Databricks quota limitation found at Subscription level.
Select your subscription => Under settings => Usage + Quotas.

Can we get the utilization % of our nodes at different point of time?
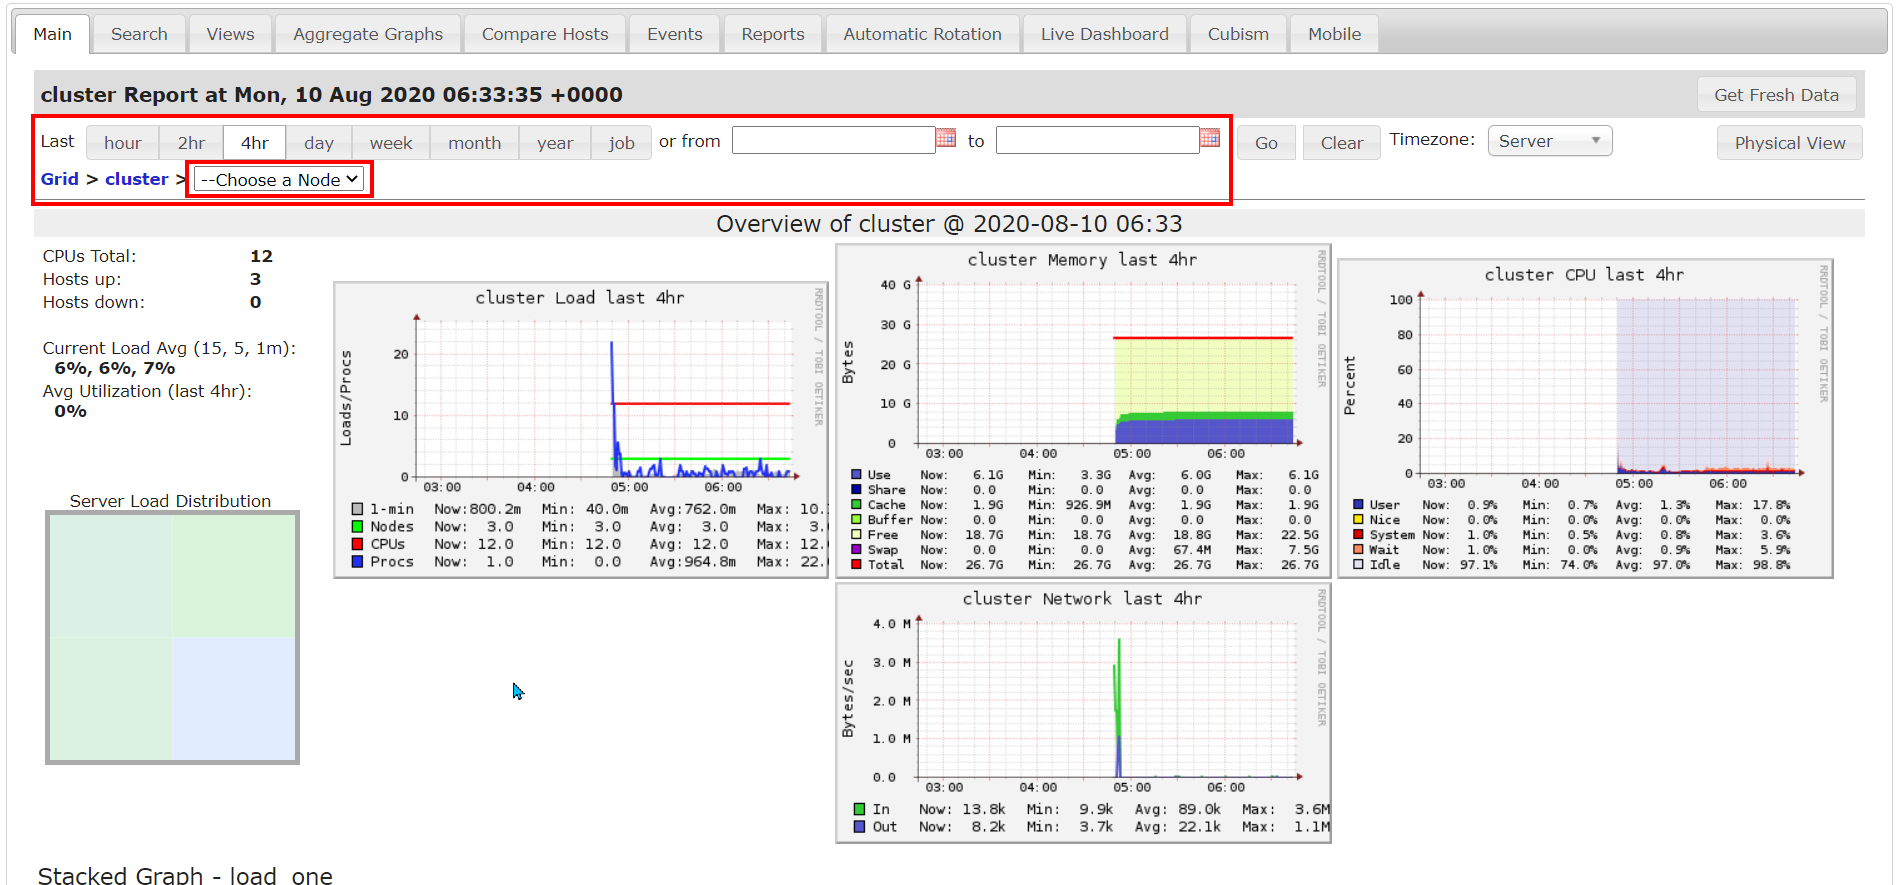
You can use Ganglia metrics to get utilization % for nodes at different point of time.
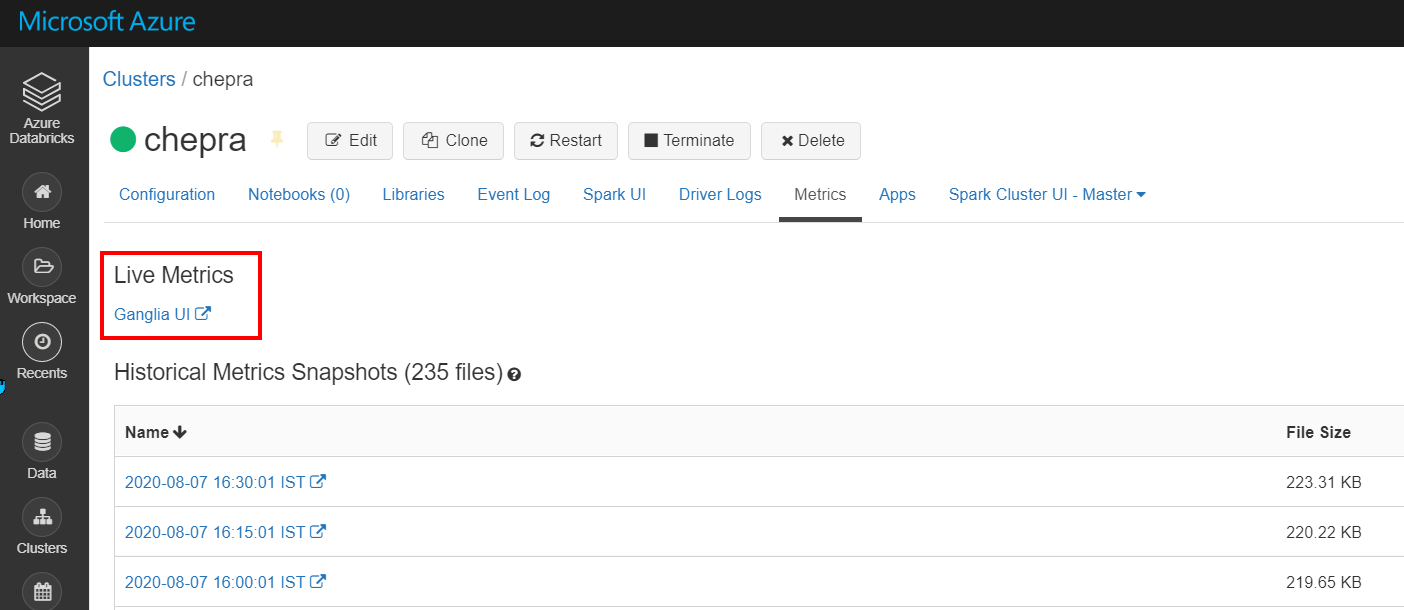
To access the Ganglia UI, navigate to the Metrics tab on the cluster details page. CPU metrics are available in the Ganglia UI for all Databricks runtimes. GPU metrics are available for GPU-enabled clusters running Databricks Runtime 4.1 and above.
To view live metrics, click the Ganglia UI link.

To view historical metrics, click a snapshot file. The snapshot contains aggregated metrics for the hour preceding the selected time.

Cost of each jobs or databricks units in Azure monitor.
You cannot get cost for each job in Azure Databricks.
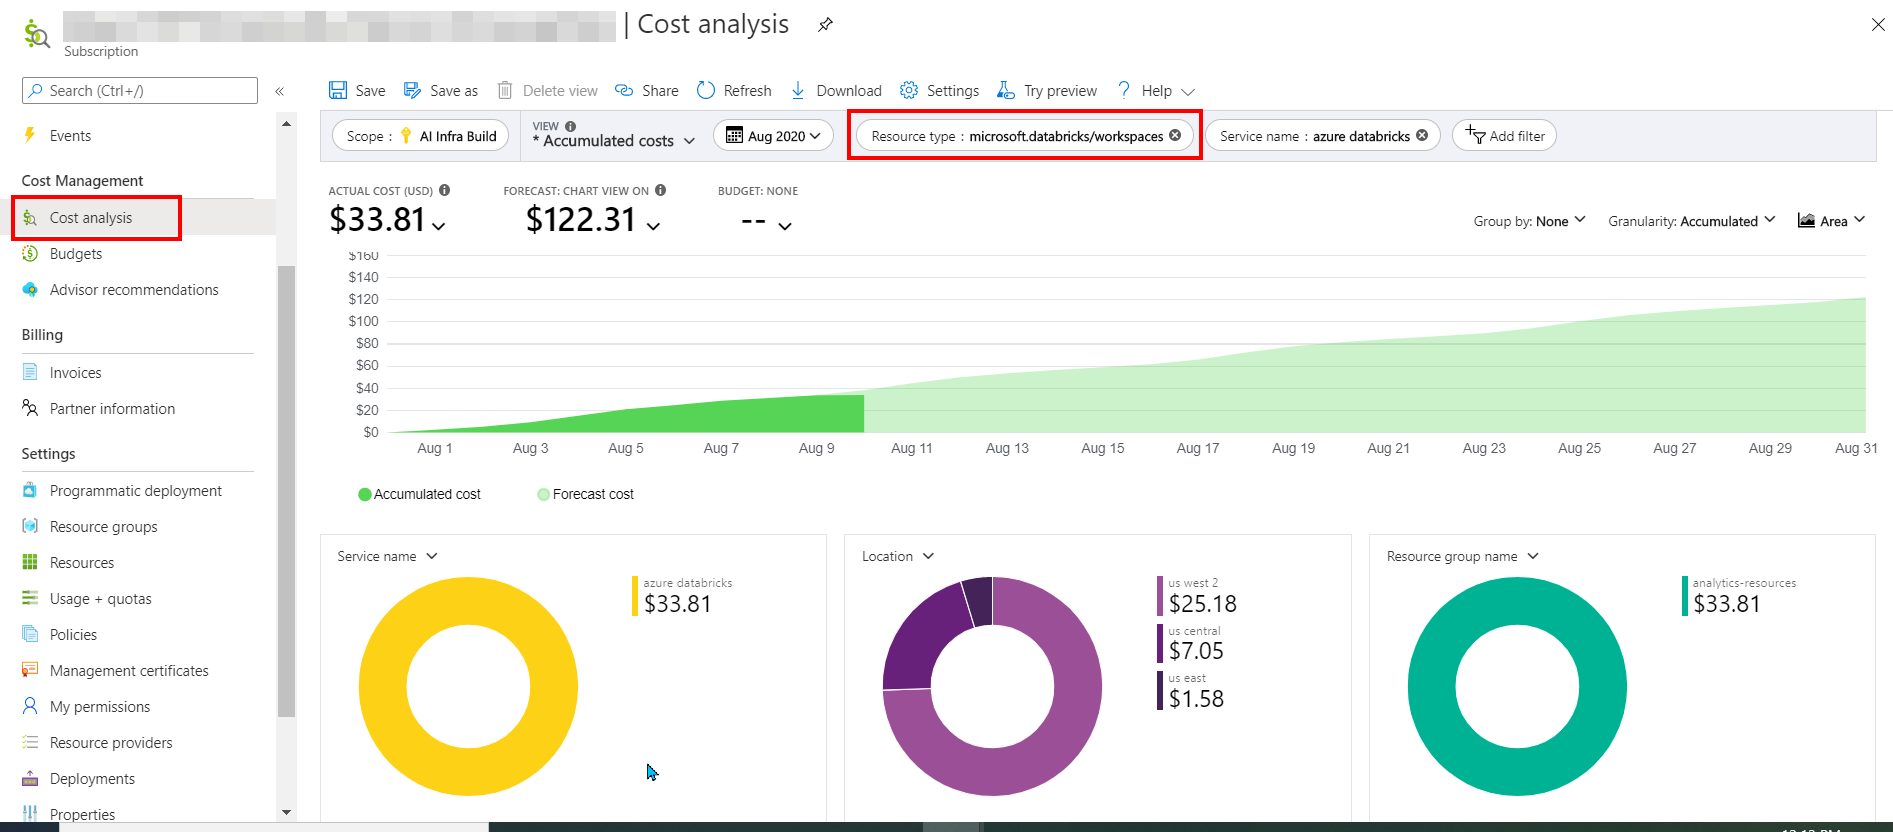
Azure Databricks cost can be found at Subscription level.
Select your subscription => Cost Analysis => Resource type = "microsoft.databricks/workspaces".

Hope this helps. Do let us know if you any further queries.
----------------------------------------------------------------------------------------
Do click on "Accept Answer" and Upvote on the post that helps you, this can be beneficial to other community members.

