Application Insights Overview dashboard
Application Insights provides a summary in the overview pane to allow at-a-glance assessment of your application's health and performance.

A time range selection is available at the top of the interface.

Each tile can be selected to navigate to the corresponding experience. As an example, selecting the Failed requests tile opens the Failures experience.

Application dashboard
The application dashboard uses the existing dashboard technology within Azure to provide a fully customizable single pane view of your application health and performance.
To access the default dashboard, select Application Dashboard.

If it's your first time accessing the dashboard, it opens a default view.

You can keep the default view if you like it. Or you can also add and delete from the dashboard to best fit the needs of your team.
Note
All users with access to the Application Insights resource share the same Application Dashboard experience. Changes made by one user will modify the view for all users.
Frequently asked questions
Can I display more than 30 days of data?
No, there's a limit of 30 days of data displayed in a dashboard.
I'm seeing a "resource not found" error on the dashboard
A "resource not found" error can occur if you move or rename your Application Insights instance.
To work around this behavior, delete the default dashboard and select Application Dashboard again to re-create a new one.
Create custom KPI dashboards using Application Insights
You can create multiple dashboards in the Azure portal that include tiles visualizing data from multiple Azure resources across different resource groups and subscriptions. You can pin different charts and views from Application Insights to create custom dashboards that provide you with a complete picture of the health and performance of your application. This tutorial walks you through the creation of a custom dashboard that includes multiple types of data and visualizations from Application Insights.
You learn how to:
- Create a custom dashboard in Azure.
- Add a tile from the Tile Gallery.
- Add standard metrics in Application Insights to the dashboard.
- Add a custom metric chart based on Application Insights to the dashboard.
- Add the results of a Log Analytics query to the dashboard.
Prerequisites
To complete this tutorial:
- Deploy a .NET application to Azure.
- Enable the Application Insights SDK.
Note
Required permissions for working with dashboards are discussed in the article on understanding access control for dashboards.
Sign in to Azure
Sign in to the Azure portal.
Create a new dashboard
Warning
If you move your Application Insights resource over to a different resource group or subscription, you'll need to manually update the dashboard by removing the old tiles and pinning new tiles from the same Application Insights resource at the new location.
A single dashboard can contain resources from multiple applications, resource groups, and subscriptions. Start the tutorial by creating a new dashboard for your application.
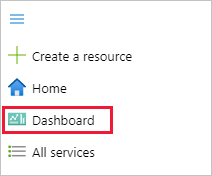
In the menu dropdown on the left in the Azure portal, select Dashboard.
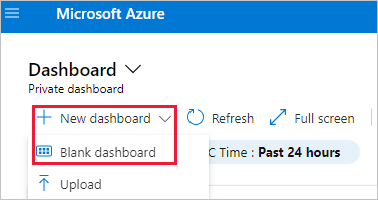
On the Dashboard pane, select New dashboard > Blank dashboard.
Enter a name for the dashboard.
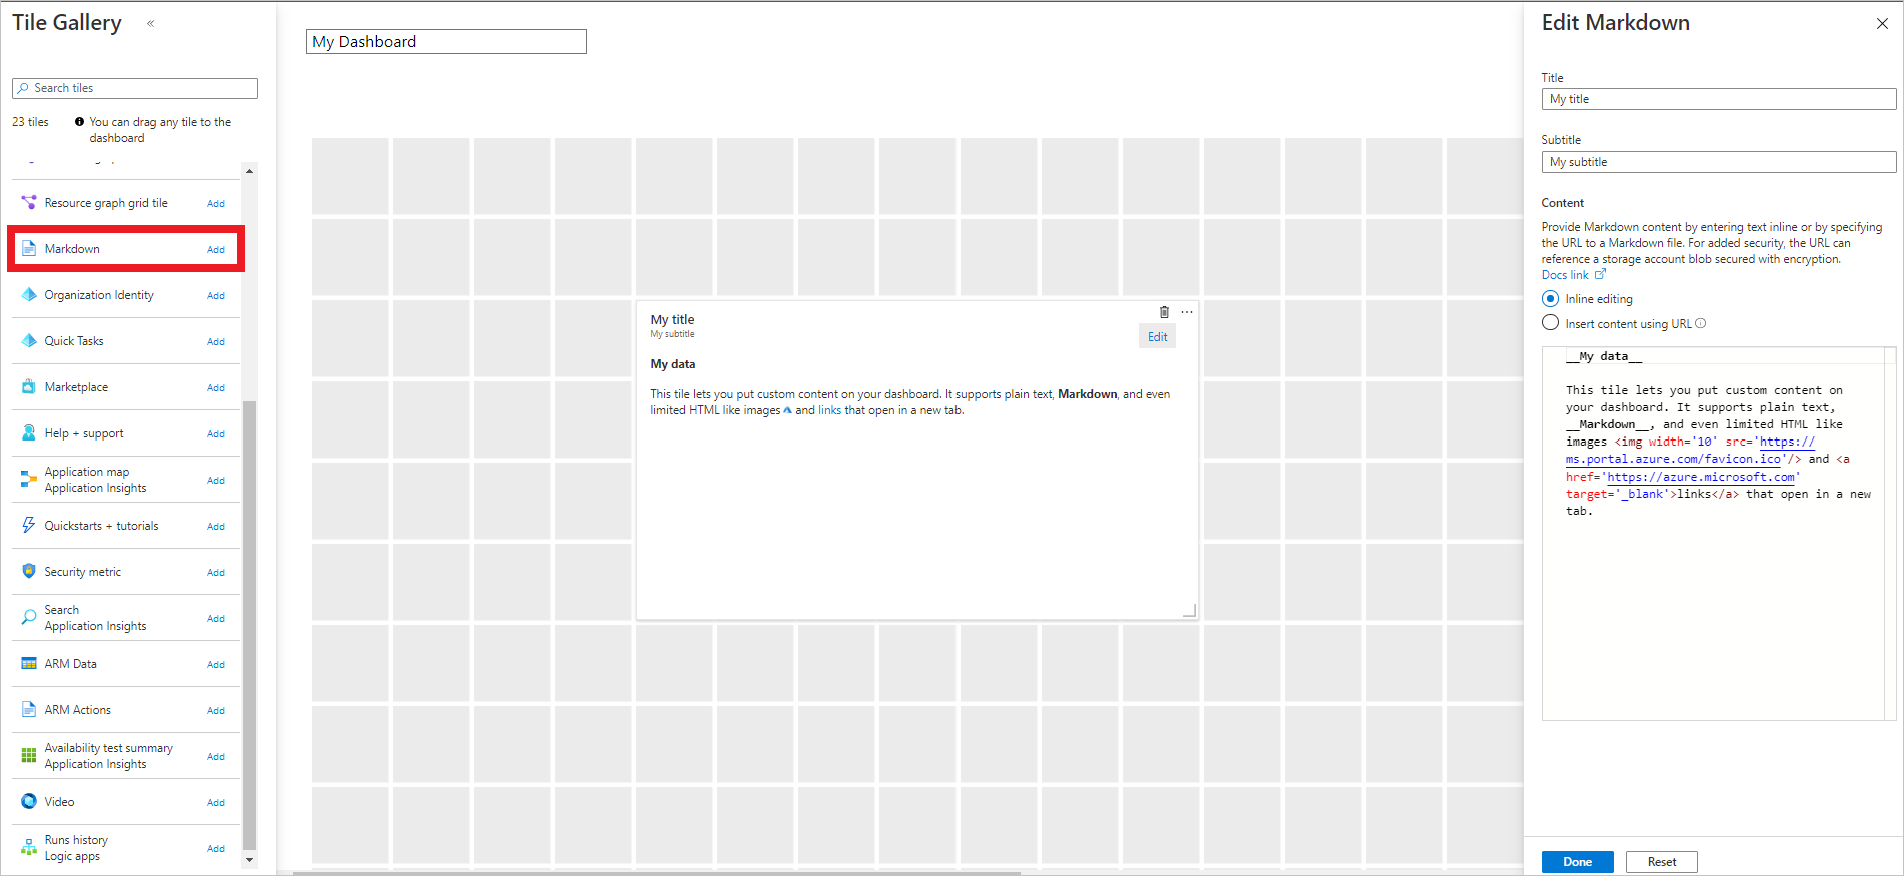
Look at the Tile Gallery for various tiles that you can add to your dashboard. You can also pin charts and other views directly from Application Insights to the dashboard.
Locate the Markdown tile and drag it on to your dashboard. With this tile, you can add text formatted in Markdown, which is ideal for adding descriptive text to your dashboard. To learn more, see Use a Markdown tile on Azure dashboards to show custom content.
Add text to the tile's properties and resize it on the dashboard canvas.
Select Done customizing at the top of the screen to exit tile customization mode.


Add health overview
A dashboard with static text isn't very interesting, so add a tile from Application Insights to show information about your application. You can add Application Insights tiles from the Tile Gallery. You can also pin them directly from Application Insights screens. In this way, you can configure charts and views that you're already familiar with before you pin them to your dashboard.
Start by adding the standard health overview for your application. This tile requires no configuration and allows minimal customization in the dashboard.
Select your Application Insights resource on the home screen.
On the Overview pane, select the pin icon
 to add the tile to a dashboard.
On the Pin to dashboard tab, select which dashboard to add the tile to or create a new one.
At the top right, a notification appears that your tile was pinned to your dashboard. Select Pinned to dashboard in the notification to return to your dashboard or use the Dashboard pane.
Select Edit to change the positioning of the tile you added to your dashboard. Select and drag it into position and then select Done customizing. Your dashboard now has a tile with some useful information.


Add custom metric chart
You can use the Metrics panel to graph a metric collected by Application Insights over time with optional filters and grouping. Like everything else in Application Insights, you can add this chart to the dashboard. This step does require you to do a little customization first.
Select your Application Insights resource on the home screen.
Select Metrics.
An empty chart appears, and you're prompted to add a metric. Add a metric to the chart and optionally add a filter and a grouping. The following example shows the number of server requests grouped by success. This chart gives a running view of successful and unsuccessful requests.

Select Pin to dashboard on the right.
In the top right, a notification appears that your tile was pinned to your dashboard. Select Pinned to dashboard in the notification to return to your dashboard or use the dashboard tab.
That tile is now added to your dashboard. Select Edit to change the positioning of the tile. Select and drag the tile into position and then select Done customizing.

Add a logs query
Application Insights Logs provides a rich query language that you can use to analyze all the data collected by Application Insights. Like with charts and other views, you can add the output of a logs query to your dashboard.
Select your Application Insights resource in the home screen.
On the left under Monitoring, select Logs to open the Logs tab.
Enter the following query, which returns the top 10 most requested pages and their request count:
 requests
 | summarize count() by name
 | sort by count_ desc
 | take 10
Select Run to validate the results of the query.
Select the pin icon
and then select the name of your dashboard.Before you go back to the dashboard, add another query, but render it as a chart. Now you'll see the different ways to visualize a logs query in a dashboard. Start with the following query that summarizes the top 10 operations with the most exceptions:
 exceptions
 | summarize count() by operation_Name
 | sort by count_ desc
 | take 10
Select Chart and then select Doughnut to visualize the output.

Select the pin icon
at the top right to pin the chart to your dashboard. Then return to your dashboard.The results of the queries are added to your dashboard in the format that you selected. Select and drag each result into position. Then select Done customizing.
Select the pencil icon
 on each title and use it to make the titles descriptive.


Share dashboard
- At the top of the dashboard, select Share to publish your changes.
- You can optionally define specific users who should have access to the dashboard. For more information, see Share Azure dashboards by using Azure role-based access control.
- Select Publish.
Next steps
- Funnels
- Retention
- User flows
- In the tutorial, you learned how to create custom dashboards. Now look at the rest of the Application Insights documentation, which also includes a case study.
Feedback
Coming soon: Throughout 2024 we will be phasing out GitHub Issues as the feedback mechanism for content and replacing it with a new feedback system. For more information see: https://aka.ms/ContentUserFeedback.
Submit and view feedback for