Configure log collection in Container insights
This article provides details on how to configure data collection in Container insights for your Kubernetes cluster once it's been onboarded. For guidance on enabling Container insights on your cluster, see Enable monitoring for Kubernetes clusters.
Configuration methods
There are two methods use to configure and filter data being collected in Container insights. Depending on the setting, you may be able to choose between the two methods or you may be required to use one or the other. The two methods are described in the table below with detailed information in the following sections.
| Method | Description |
|---|---|
| Data collection rule (DCR) | Data collection rules are sets of instructions supporting data collection using the Azure Monitor pipeline. A DCR is created when you enable Container insights, and you can modify the settings in this DCR either using the Azure portal or other methods. |
| ConfigMap | ConfigMaps are a Kubernetes mechanism that allows you to store non-confidential data such as a configuration file or environment variables. Container insights looks for a ConfigMap on each cluster with particular settings that define data that it should collect. |
Configure data collection using DCR
The DCR created by Container insights is named MSCI-<cluster-region>-<cluster-name>. You can view this DCR along with others in your subscription, and you can edit it using methods described in Create and edit data collection rules (DCRs) in Azure Monitor. While you can directly modify the DCR for particular customizations, you can perform most required configuration using the methods described below. See Data transformations in Container insights for details on editing the DCR directly for more advanced configurations.
Important
AKS clusters must use either a system-assigned or user-assigned managed identity. If cluster is using a service principal, you must update the cluster to use a system-assigned managed identity or a user-assigned managed identity.
Configure DCR with Azure portal
Using the Azure portal, you can select from multiple preset configurations for data collection in Container insights. These configurations include different sets of tables and collection frequencies depending on your particular priorities. You can also customize the settings to collect only the data you require. You can use the Azure portal to customize configuration on your existing cluster after Container insights has been enabled, or you can perform this configuration when you enable Container insights on your cluster.
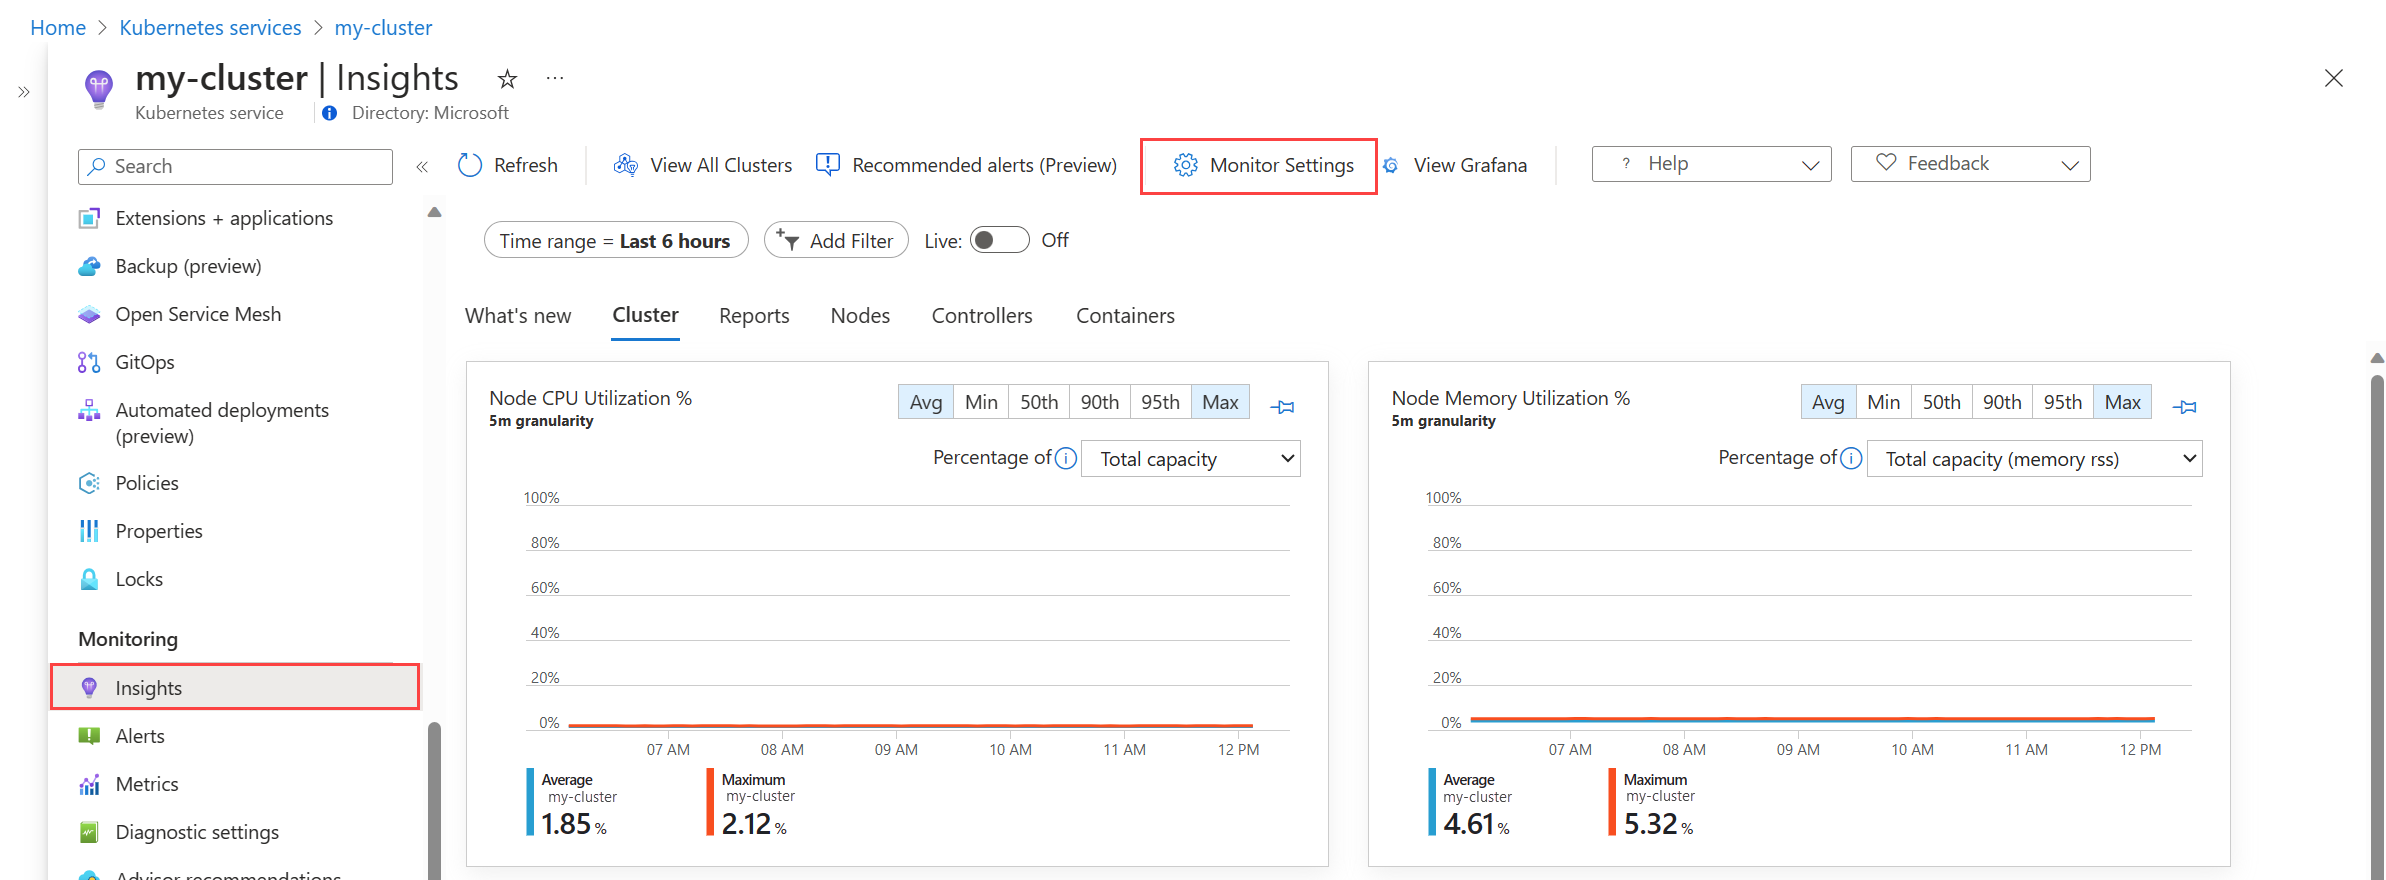
Select the cluster in the Azure portal.
Select the Insights option in the Monitoring section of the menu.
If Container insights has already been enabled on the cluster, select the Monitoring Settings button. If not, select Configure Azure Monitor and see Enable monitoring on your Kubernetes cluster with Azure Monitor for details on enabling monitoring.
For AKS and Arc-enabled Kubernetes, select Use managed identity if you haven't yet migrated the cluster to managed identity authentication.
Select one of the cost presets.
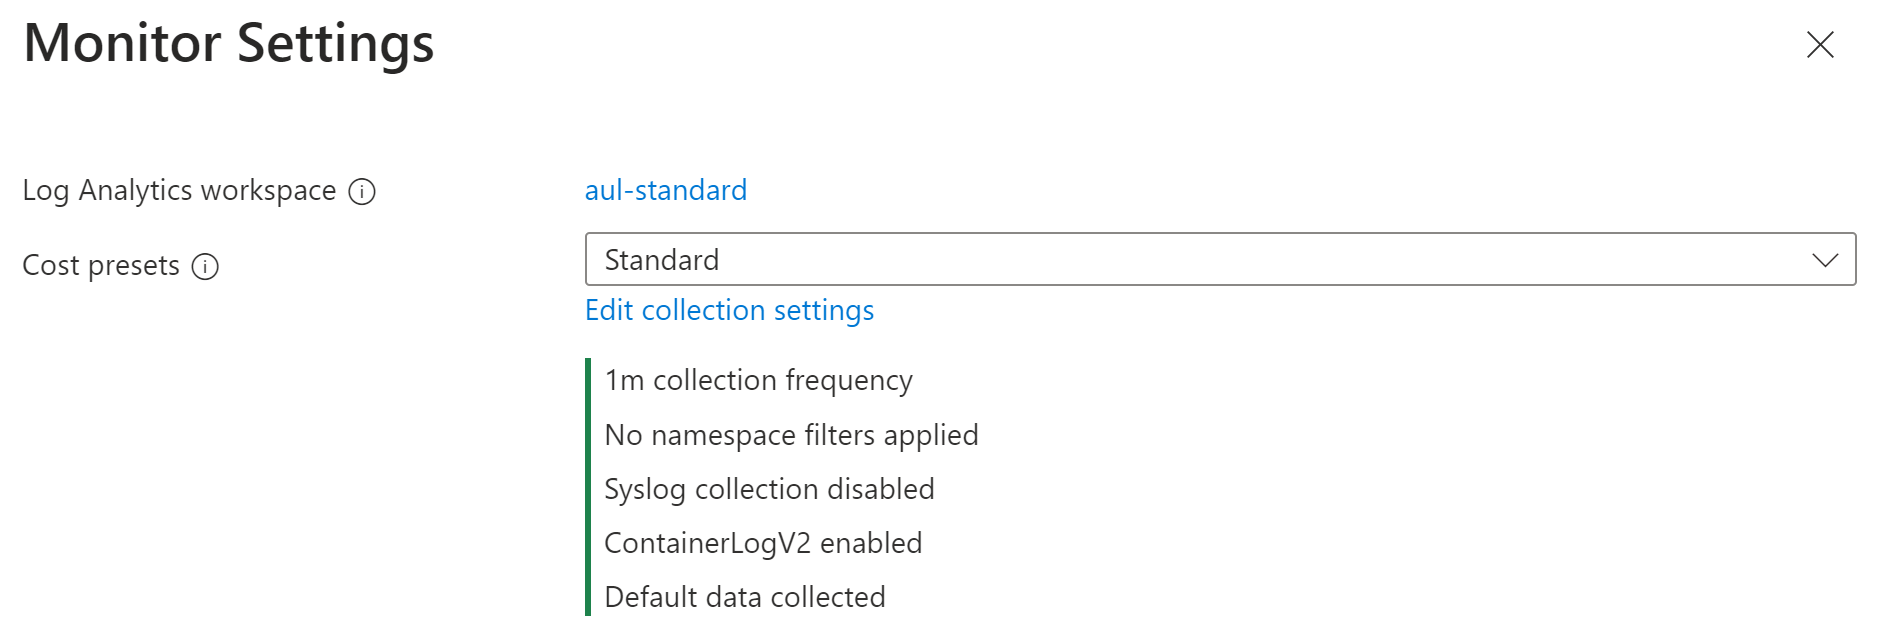
Cost preset Collection frequency Namespace filters Syslog collection Collected data Standard 1 m None Not enabled All standard container insights tables Cost-optimized 5 m Excludes kube-system, gatekeeper-system, azure-arc Not enabled All standard container insights tables Syslog 1 m None Enabled by default All standard container insights tables Logs and Events 1 m None Not enabled ContainerLog/ContainerLogV2
KubeEvents
KubePodInventoryIf you want to customize the settings, click Edit collection settings.
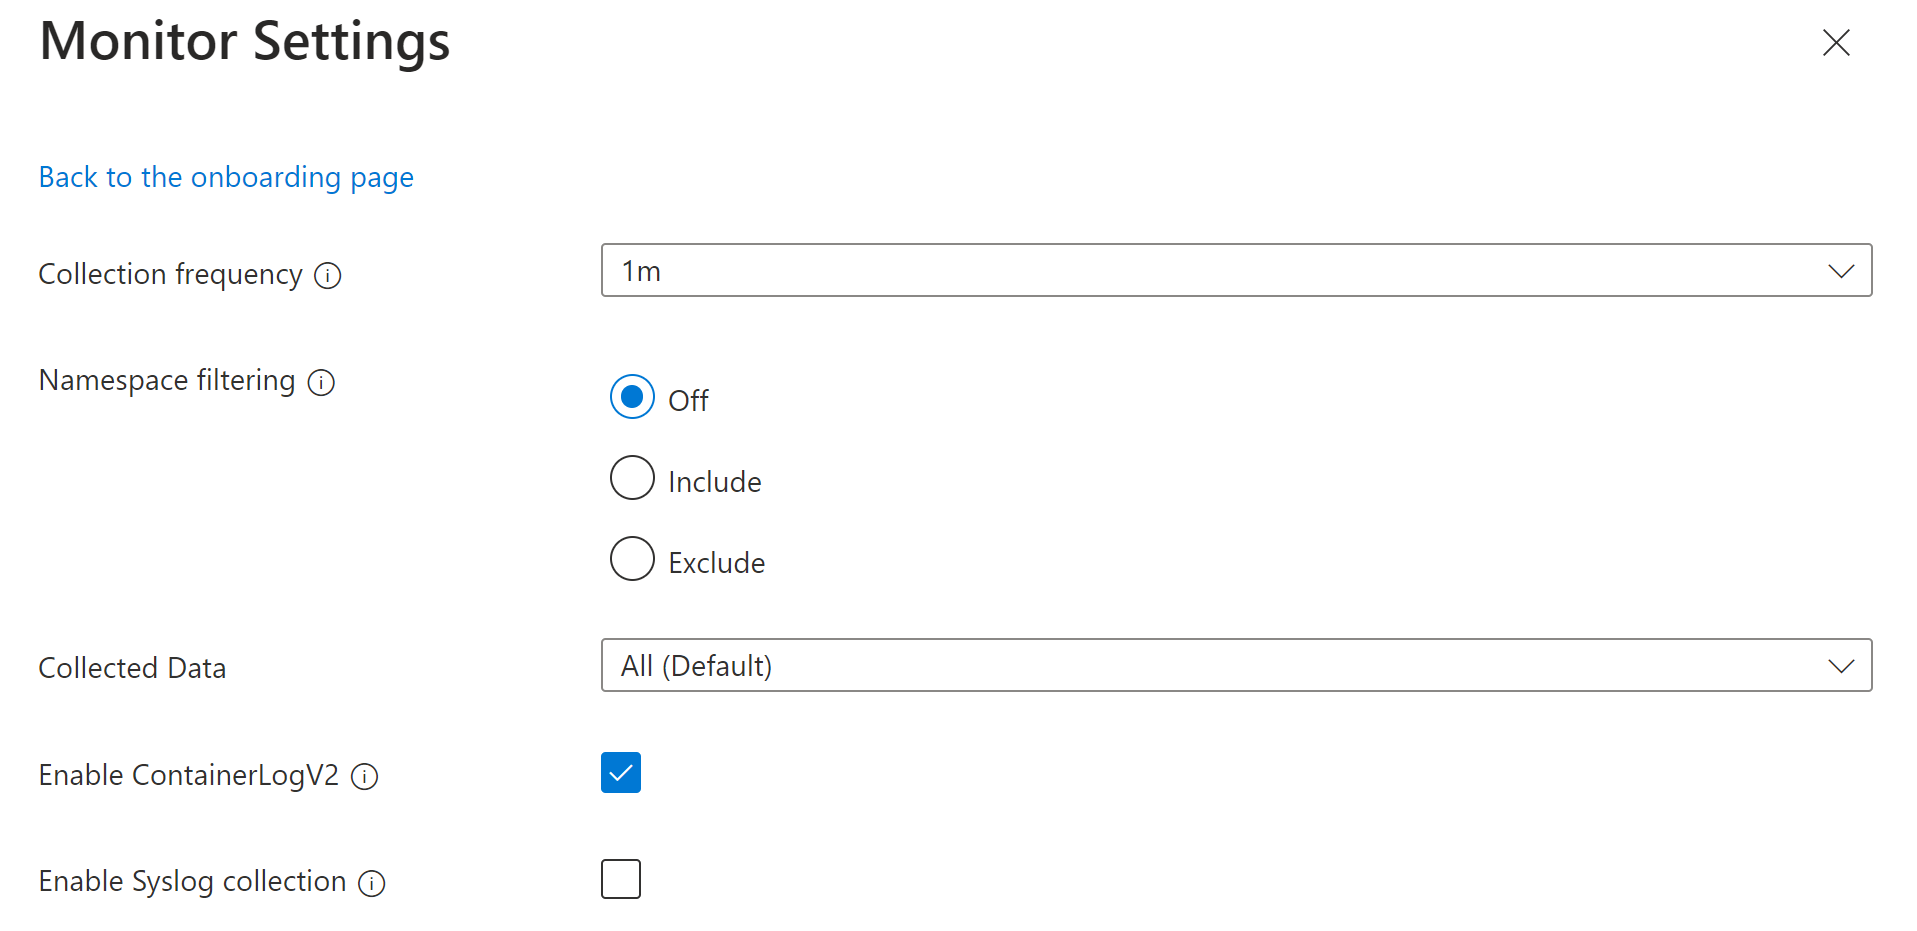
Name Description Collection frequency Determines how often the agent collects data. Valid values are 1m - 30m in 1m intervals The default value is 1m. Namespace filtering Off: Collects data on all namespaces.
Include: Collects only data from the values in the namespaces field.
Exclude: Collects data from all namespaces except for the values in the namespaces field.
Array of comma separated Kubernetes namespaces to collect inventory and perf data based on the namespaceFilteringMode. For example, namespaces = ["kube-system", "default"] with an Include setting collects only these two namespaces. With an Exclude setting, the agent collects data from all other namespaces except for kube-system and default.Collected Data Defines which Container insights tables to collect. See below for a description of each grouping. Enable ContainerLogV2 Boolean flag to enable ContainerLogV2 schema. If set to true, the stdout/stderr Logs are ingested to ContainerLogV2 table. If not, the container logs are ingested to ContainerLog table, unless otherwise specified in the ConfigMap. When specifying the individual streams, you must include the corresponding table for ContainerLog or ContainerLogV2. Enable Syslog collection Enables Syslog collection from the cluster. The Collected data option allows you to select the tables that are populated for the cluster. The tables are grouped by the most common scenarios. To specify individual tables, you must modify the DCR using another method.
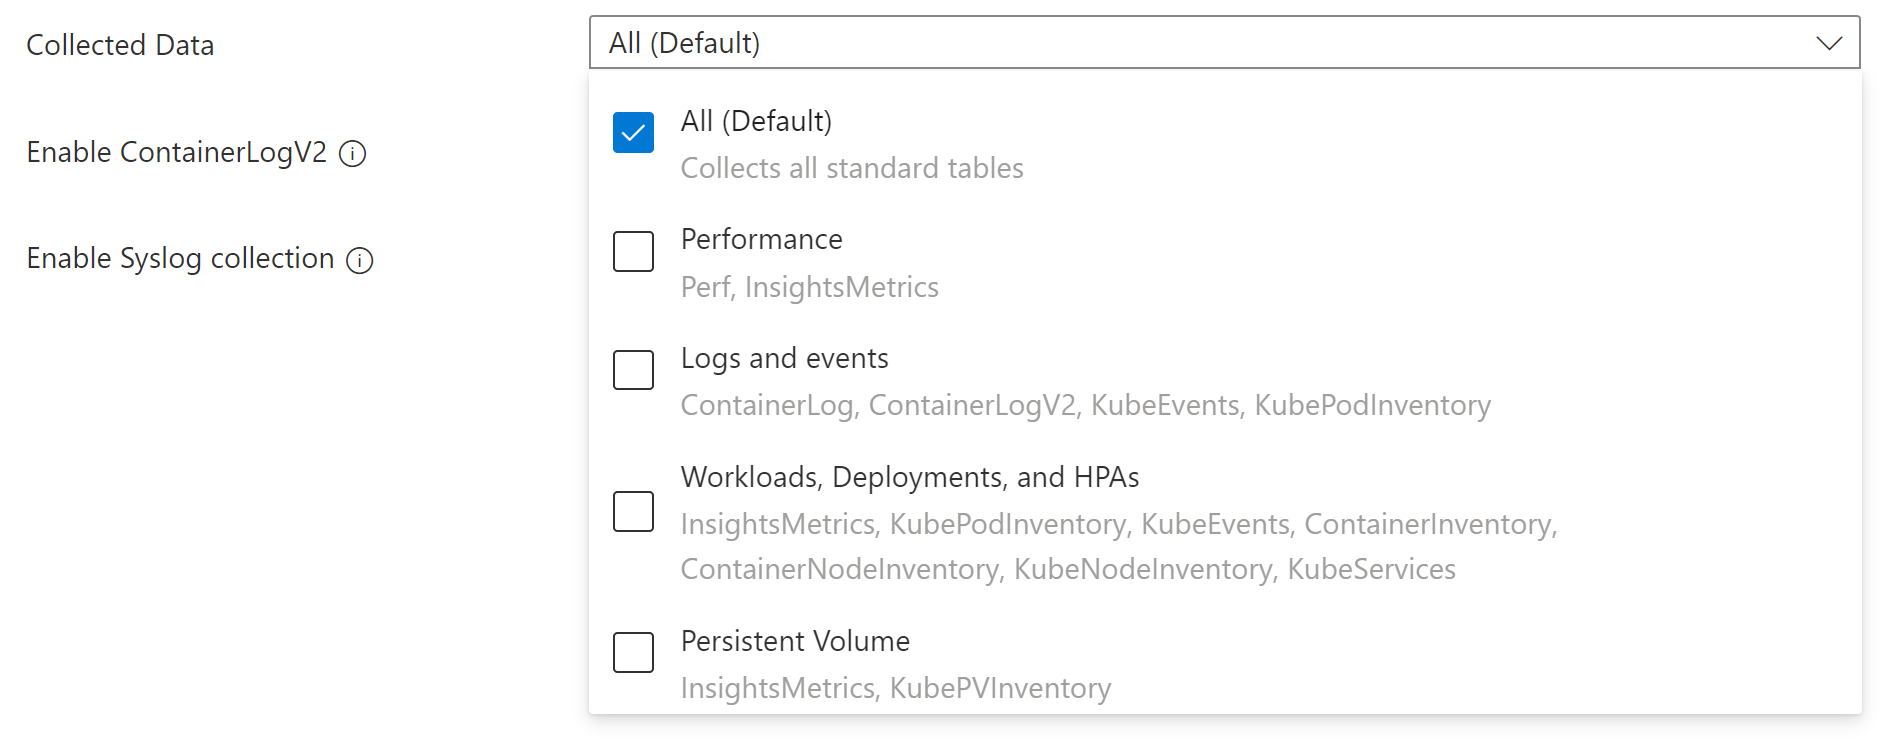
Grouping Tables Notes All (Default) All standard container insights tables Required for enabling the default Container insights visualizations Performance Perf, InsightsMetrics Logs and events ContainerLog or ContainerLogV2, KubeEvents, KubePodInventory Recommended if you have enabled managed Prometheus metrics Workloads, Deployments, and HPAs InsightsMetrics, KubePodInventory, KubeEvents, ContainerInventory, ContainerNodeInventory, KubeNodeInventory, KubeServices Persistent Volumes InsightsMetrics, KubePVInventory Click Configure to save the settings.


Applicable tables and metrics for DCR
The settings for collection frequency and namespace filtering in the DCR don't apply to all Container insights data. The following tables list the tables in the Log Analytics workspace used by Container insights and the metrics it collects along with the settings that apply to each.
| Table name | Interval? | Namespaces? | Remarks |
|---|---|---|---|
| ContainerInventory | Yes | Yes | |
| ContainerNodeInventory | Yes | No | Data collection setting for namespaces isn't applicable since Kubernetes Node isn't a namespace scoped resource |
| KubeNodeInventory | Yes | No | Data collection setting for namespaces isn't applicable Kubernetes Node isn't a namespace scoped resource |
| KubePodInventory | Yes | Yes | |
| KubePVInventory | Yes | Yes | |
| KubeServices | Yes | Yes | |
| KubeEvents | No | Yes | Data collection setting for interval isn't applicable for the Kubernetes Events |
| Perf | Yes | Yes | Data collection setting for namespaces isn't applicable for the Kubernetes Node related metrics since the Kubernetes Node isn't a namespace scoped object. |
| InsightsMetrics | Yes | Yes | Data collection settings are only applicable for the metrics collecting the following namespaces: container.azm.ms/kubestate, container.azm.ms/pv and container.azm.ms/gpu |
| Metric namespace | Interval? | Namespaces? | Remarks |
|---|---|---|---|
| Insights.container/nodes | Yes | No | Node isn't a namespace scoped resource |
| Insights.container/pods | Yes | Yes | |
| Insights.container/containers | Yes | Yes | |
| Insights.container/persistentvolumes | Yes | Yes |
Stream values in DCR
When you specify the tables to collect using CLI or ARM, you specify a stream name that corresponds to a particular table in the Log Analytics workspace. The following table lists the stream name for each table.
Note
If you're familiar with the structure of a data collection rule, the stream names in this table are specified in the dataFlows section of the DCR.
| Stream | Container insights table |
|---|---|
| Microsoft-ContainerInventory | ContainerInventory |
| Microsoft-ContainerLog | ContainerLog |
| Microsoft-ContainerLogV2 | ContainerLogV2 |
| Microsoft-ContainerLogV2-HighScale | ContainerLogV2 (High scale mode)1 |
| Microsoft-ContainerNodeInventory | ContainerNodeInventory |
| Microsoft-InsightsMetrics | InsightsMetrics |
| Microsoft-KubeEvents | KubeEvents |
| Microsoft-KubeMonAgentEvents | KubeMonAgentEvents |
| Microsoft-KubeNodeInventory | KubeNodeInventory |
| Microsoft-KubePodInventory | KubePodInventory |
| Microsoft-KubePVInventory | KubePVInventory |
| Microsoft-KubeServices | KubeServices |
| Microsoft-Perf | Perf |
1 You shouldn't use both Microsoft-ContainerLogV2 and Microsoft-ContainerLogV2-HighScale in the same DCR. This will result in duplicate data.
Share DCR with multiple clusters
When you enable Container insights on a Kubernetes cluster, a new DCR is created for that cluster, and the DCR for each cluster can be modified independently. If you have multiple clusters with custom monitoring configurations, you may want to share a single DCR with multiple clusters. You can then make changes to a single DCR that are automatically implemented for any clusters associated with it.
A DCR is associated with a cluster with a data collection rule associates (DCRA). Use the preview DCR experience to view and remove existing DCR associations for each cluster. You can then use this feature to add an association to a single DCR for multiple clusters.
Configure data collection using ConfigMap
ConfigMaps are a Kubernetes mechanism that allow you to store non-confidential data such as a configuration file or environment variables. Container insights looks for a ConfigMap on each cluster with particular settings that define data that it should collect.
Important
ConfigMap is a global list and there can be only one ConfigMap applied to the agent for Container insights. Applying another ConfigMap will overrule the previous ConfigMap collection settings.
Prerequisites
- The minimum agent version supported to collect stdout, stderr, and environmental variables from container workloads is ciprod06142019 or later.
Configure and deploy ConfigMap
Use the following procedure to configure and deploy your ConfigMap configuration file to your cluster:
If you don't already have a ConfigMap for Container insights, download the template ConfigMap YAML file and open it in an editor.
Edit the ConfigMap YAML file with your customizations. The template includes all valid settings with descriptions. To enable a setting, remove the comment character (#) and set its value.
Create a ConfigMap by running the following kubectl command:
kubectl apply -f <configmap_yaml_file.yaml>

# Example:
kubectl apply -f container-azm-ms-agentconfig.yaml
The configuration change can take a few minutes to finish before taking effect. Then all Azure Monitor Agent pods in the cluster will restart. The restart is a rolling restart for all Azure Monitor Agent pods, so not all of them restart at the same time. When the restarts are finished, you'll receive a message similar to the following result:
configmap "container-azm-ms-agentconfig" created`.
Verify configuration
To verify the configuration was successfully applied to a cluster, use the following command to review the logs from an agent pod.
kubectl logs ama-logs-fdf58 -n kube-system
If there are configuration errors from the Azure Monitor Agent pods, the output will show errors similar to the following:
***************Start Config Processing********************
config::unsupported/missing config schema version - 'v21' , using defaults
Use the following options to perform more troubleshooting of configuration changes:
Use the same
kubectl logscommand from an agent pod.Review live logs for errors similar to the following:
config::error::Exception while parsing config map for log collection/env variable settings: \nparse error on value \"$\" ($end), using defaults, please check config map for errorsData is sent to the
KubeMonAgentEventstable in your Log Analytics workspace every hour with error severity for configuration errors. If there are no errors, the entry in the table will have data with severity info, which reports no errors. TheTagscolumn contains more information about the pod and container ID on which the error occurred and also the first occurrence, last occurrence, and count in the last hour.
Verify schema version
Supported config schema versions are available as pod annotation (schema-versions) on the Azure Monitor Agent pod. You can see them with the following kubectl command.
kubectl describe pod ama-logs-fdf58 -n=kube-system.
ConfigMap settings
The following table describes the settings you can configure to control data collection with ConfigMap.
| Setting | Data type | Value | Description |
|---|---|---|---|
schema-version |
String (case sensitive) | v1 | Used by the agent when parsing this ConfigMap. Currently supported schema-version is v1. Modifying this value isn't supported and will be rejected when the ConfigMap is evaluated. |
config-version |
String | Allows you to keep track of this config file's version in your source control system/repository. Maximum allowed characters are 10, and all other characters are truncated. | |
| [log_collection_settings] | |||
[stdout]enabled |
Boolean | true false |
Controls whether stdout container log collection is enabled. When set to true and no namespaces are excluded for stdout log collection, stdout logs will be collected from all containers across all pods and nodes in the cluster. If not specified in the ConfigMap, the default value is true. |
[stdout]exclude_namespaces |
String | Comma-separated array | Array of Kubernetes namespaces for which stdout logs won't be collected. This setting is effective only if enabled is set to true. If not specified in the ConfigMap, the default value is["kube-system","gatekeeper-system"]. |
[stderr]enabled |
Boolean | true false |
Controls whether stderr container log collection is enabled. When set to true and no namespaces are excluded for stderr log collection, stderr logs will be collected from all containers across all pods and nodes in the cluster. If not specified in the ConfigMap, the default value is true. |
[stderr]exclude_namespaces |
String | Comma-separated array | Array of Kubernetes namespaces for which stderr logs won't be collected. This setting is effective only if enabled is set to true. If not specified in the ConfigMap, the default value is["kube-system","gatekeeper-system"]. |
[env_var]enabled |
Boolean | true false |
Controls environment variable collection across all pods and nodes in the cluster. If not specified in the ConfigMap, the default value is true. |
[enrich_container_logs]enabled |
Boolean | true false |
Controls container log enrichment to populate the Name and Image property values for every log record written to the ContainerLog table for all container logs in the cluster. If not specified in the ConfigMap, the default value is false. |
[collect_all_kube_events]enabled |
Boolean | true false |
Controls whether Kube events of all types are collected. By default, the Kube events with type Normal aren't collected. When this setting is true, the Normal events are no longer filtered, and all events are collected. If not specified in the ConfigMap, the default value is false. |
[schema]containerlog_schema_version |
String (case sensitive) | v2 v1 |
Sets the log ingestion format. If v2, the ContainerLogV2 table is used. If v1, the ContainerLog table is used (this table has been deprecated). For clusters enabling container insights using Azure CLI version 2.54.0 or greater, the default setting is v2. See Container insights log schema for details. |
[enable_multiline_logs]enabled |
Boolean | true false |
Controls whether multiline container logs are enabled. See Multi-line logging in Container Insights for details. If not specified in the ConfigMap, the default value is false. This requires the schema setting to be v2. |
[metadata_collection]enabled |
Boolean | true false |
Controls whether metadata is collected in the KubernetesMetadata column of the ContainerLogV2 table. |
[metadata_collection]include_fields |
String | Comma-separated array | List of metadata fields to include. If the setting isn't used then all fields are collected. Valid values are ["podLabels","podAnnotations","podUid","image","imageID","imageRepo","imageTag"] |
| [metric_collection_settings] | |||
[collect_kube_system_pv_metrics]enabled |
Boolean | true false |
Allows persistent volume (PV) usage metrics to be collected in the kube-system namespace. By default, usage metrics for persistent volumes with persistent volume claims in the kube-system namespace aren't collected. When this setting is set to true, PV usage metrics for all namespaces are collected. If not specified in the ConfigMap, the default value is false. |
| [agent_settings] | |||
[proxy_config]ignore_proxy_settings |
Boolean | true false |
When true, proxy settings are ignored. For both AKS and Arc-enabled Kubernetes environments, if your cluster is configured with forward proxy, then proxy settings are automatically applied and used for the agent. For certain configurations, such as with AMPLS + Proxy, you might want the proxy configuration to be ignored. If not specified in the ConfigMap, the default value is false. |
Next steps
- See Filter log collection in Container insights for details on saving costs by configuring Container insights to filter data that you don't require.
Feedback
Coming soon: Throughout 2024 we will be phasing out GitHub Issues as the feedback mechanism for content and replacing it with a new feedback system. For more information see: https://aka.ms/ContentUserFeedback.
Submit and view feedback for