Azure Monitor managed service for Prometheus rule groups
Rules in Prometheus act on data as it's collected. They're configured as part of a Prometheus rule group, which is applied to Prometheus metrics in Azure Monitor workspace.
Rule types
There are two types of Prometheus rules as described in the following table.
| Type | Description |
|---|---|
| Alert | Alert rules let you create an Azure Monitor alert based on the results of a Prometheus Query Language (Prom QL) query. Alerts fired by Azure Managed Prometheus alert rules are processed and trigger notifications in similar way to other Azure Monitor alerts. |
| Recording | Recording rules allow you to precompute frequently needed or computationally extensive expressions and store their result as a new set of time series. Time series created by recording rules are ingested back to your Azure Monitor workspace as new Prometheus metrics. |
Create Prometheus rules
Azure Managed Prometheus rule groups, recording rules and alert rules can be created and configured using The Azure resource type Microsoft.AlertsManagement/prometheusRuleGroups, where the alert rules and recording rules are defined as part of the rule group properties. Prometheus rule groups are defined with a scope of a specific Azure Monitor workspace. Prometheus rule groups can be created using Azure Resource Manager (ARM) templates, API, Azure CLI, or PowerShell.
Azure managed Prometheus rule groups follow the structure and terminology of the open source Prometheus rule groups. Rule names, expression, 'for' clause, labels, annotations are all supported in the Azure version. The following key differences between OSS rule groups and Azure managed Prometheus should be noted:
- Azure managed Prometheus rule groups are managed as Azure resources, and include necessary information for resource management, such as the subscription and resource group where the Azure rule group should reside.
- Azure managed Prometheus alert rules include dedicated properties that allow alerts to be processed like other Azure Monitor alerts. For example, alert severity, action group association, and alert auto resolve configuration are supported as part of Azure managed Prometheus alert rules.
Note
For your AKS or ARC Kubernetes clusters, you can use some of the recommended alerts rules. See pre-defined alert rules here.
Limiting rules to a specific cluster
You can optionally limit the rules in a rule group to query data originating from a single specific cluster, by adding a cluster scope to your rule group, and/or by using the rule group clusterName property.
You should limit rules to a single cluster if your Azure Monitor workspace contains a large amount of data from multiple clusters. In such a case, there's a concern that running a single set of rules on all the data may cause performance or throttling issues. By using the cluster scope, you can create multiple rule groups, each configured with the same rules, with each group covering a different cluster.
To limit your rule group to a cluster scope using an ARM template, you should add the Azure Resource ID of your cluster to the rule group scopes[] list. The scopes list must still include the Azure Monitor workspace resource ID. The following cluster resource types are supported as a cluster scope:
- Azure Kubernetes Service (AKS) clusters (Microsoft.ContainerService/managedClusters)
- Azure Arc-enabled Kubernetes clusters (Microsoft.kubernetes/connectedClusters)
- Azure connected appliances (Microsoft.ResourceConnector/appliances)
In addition to the cluster ID, you can configure the clusterName property of your rule group. The 'clusterName' property must match the cluster label that is added to your metrics when scraped from a specific cluster. By default, this label is set to the last part (resource name) of your cluster ID. If you've changed this label using the 'cluster_alias' setting in your cluster scraping configmap, you must include the updated value in the rule group 'clusterName' property. If your scraping uses the default 'cluster' label value, the 'clusterName' property is optional.
Here's an example of how a rule group is configured to limit query to a specific cluster:
{
    "name": "sampleRuleGroup",
    "type": "Microsoft.AlertsManagement/prometheusRuleGroups",
    "apiVersion": "2023-03-01",
    "location": "northcentralus",
    "properties": {
         "description": "Sample Prometheus Rule Group limited to a specific cluster",
         "scopes": [
             "/subscriptions/<subscription-id>/resourcegroups/<resource-group-name>/providers/microsoft.monitor/accounts/<azure-monitor-workspace-name>",
             "/subscriptions/<subscription-id>/resourcegroups/<resource-group-name>/providers/microsoft.containerservice/managedclusters/<myClusterName>"
         ],
         "clusterName": "<myCLusterName>",
         "rules": [
             {
                ...
             }
         ]
    }
}
If both cluster ID scope and clusterName aren't specified for a rule group, the rules in the group query data from all the clusters in the workspace from all clusters.
You can also limit your rule group to a cluster scope using the portal UI.
Create or edit Prometheus rule group in the Azure portal
To create a new rule group from the portal home page:
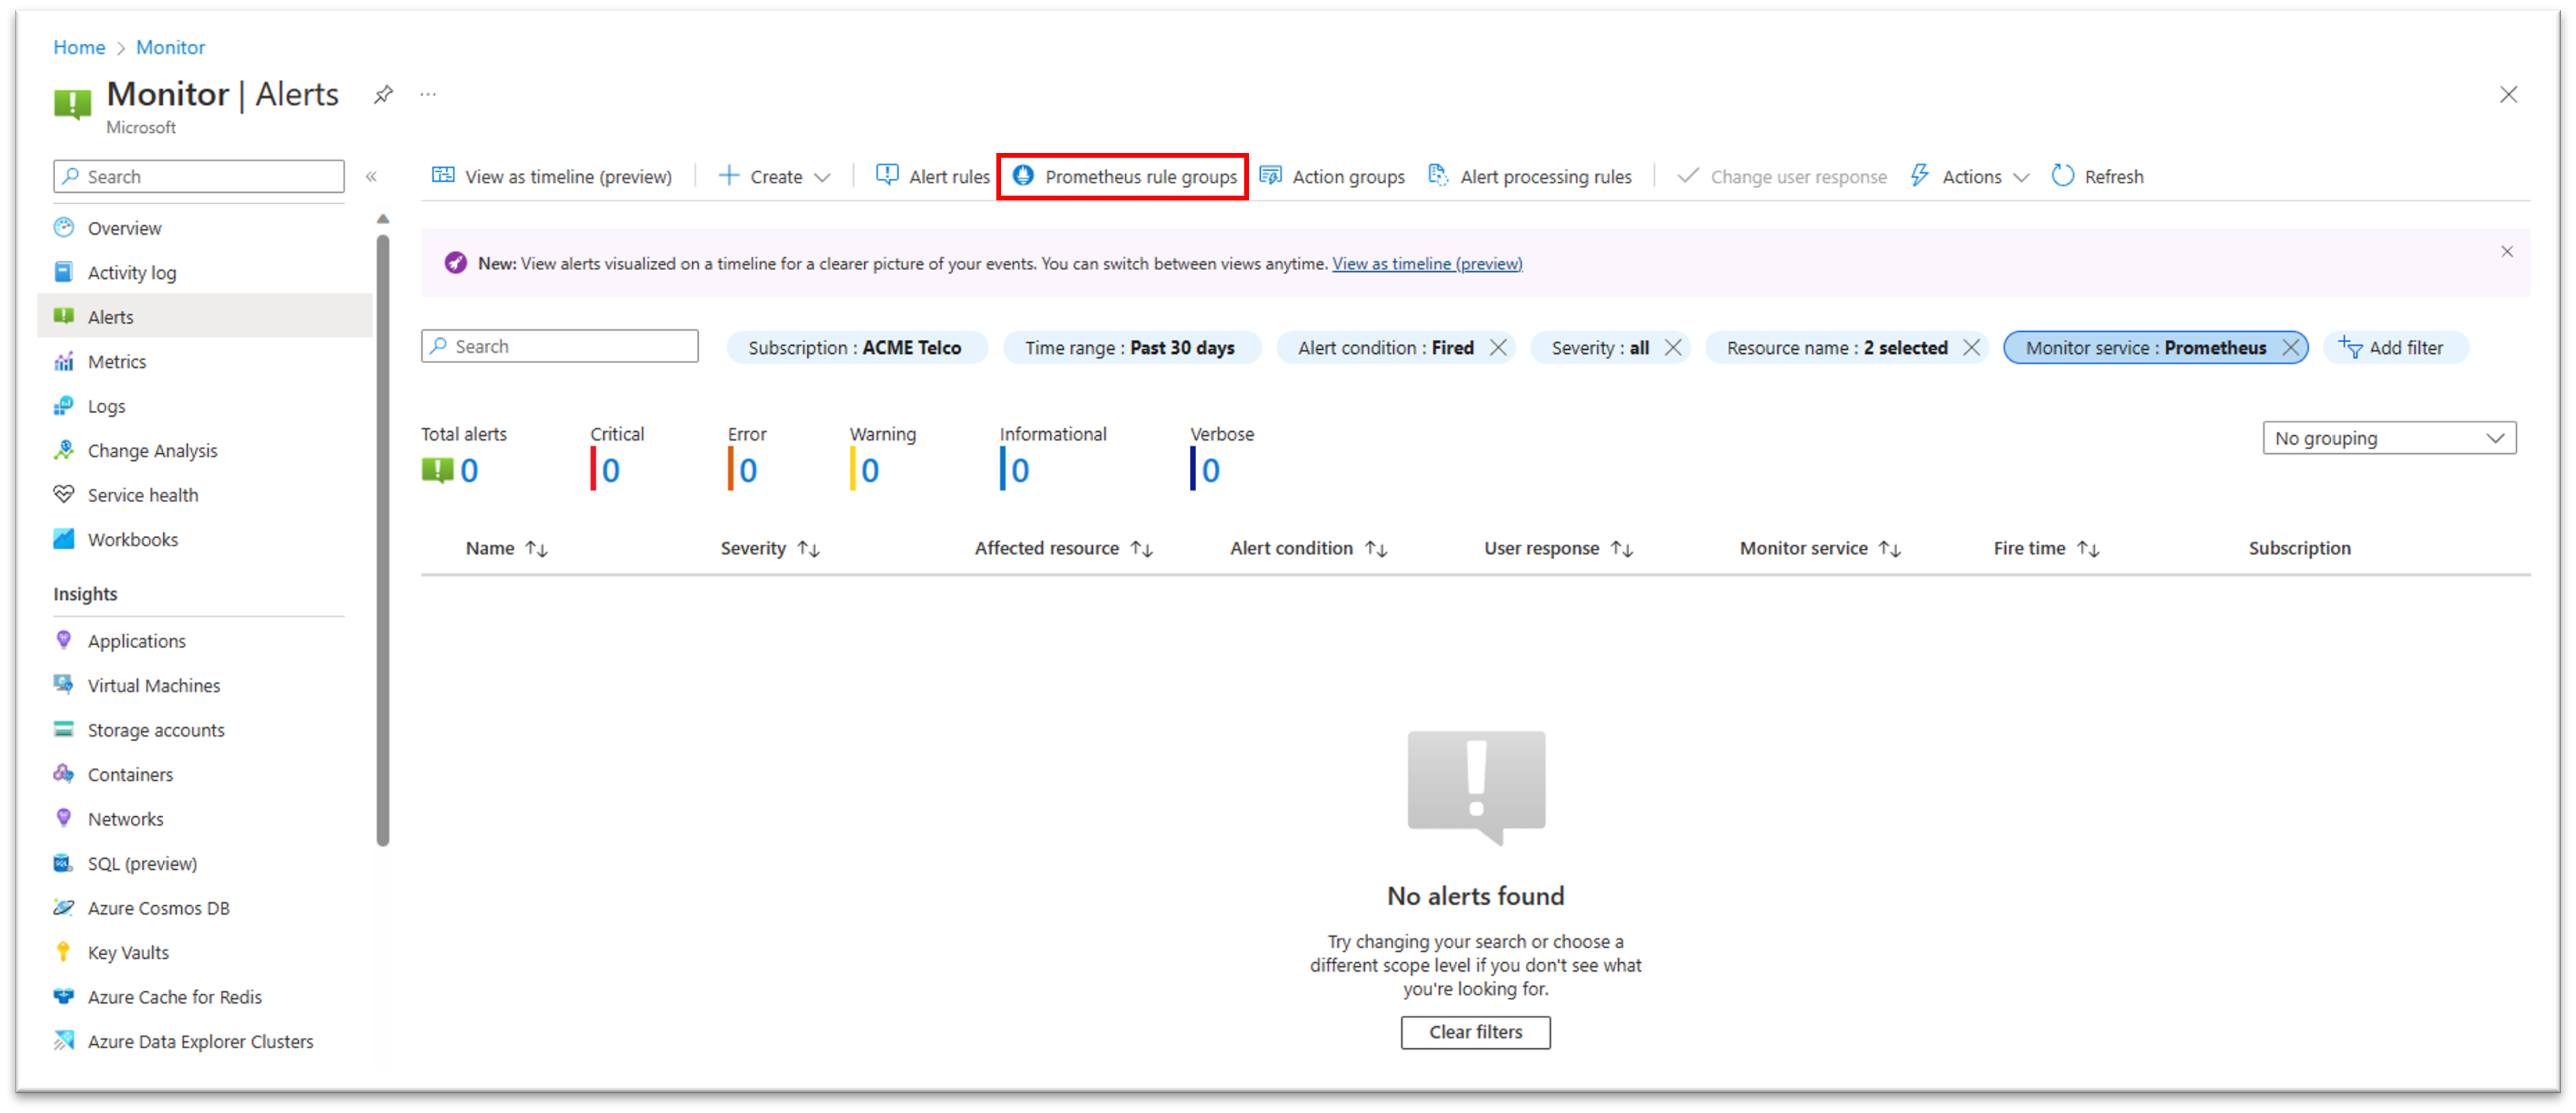
- In the portal, select Monitor > Alerts.
- Select Prometheus Rule Groups
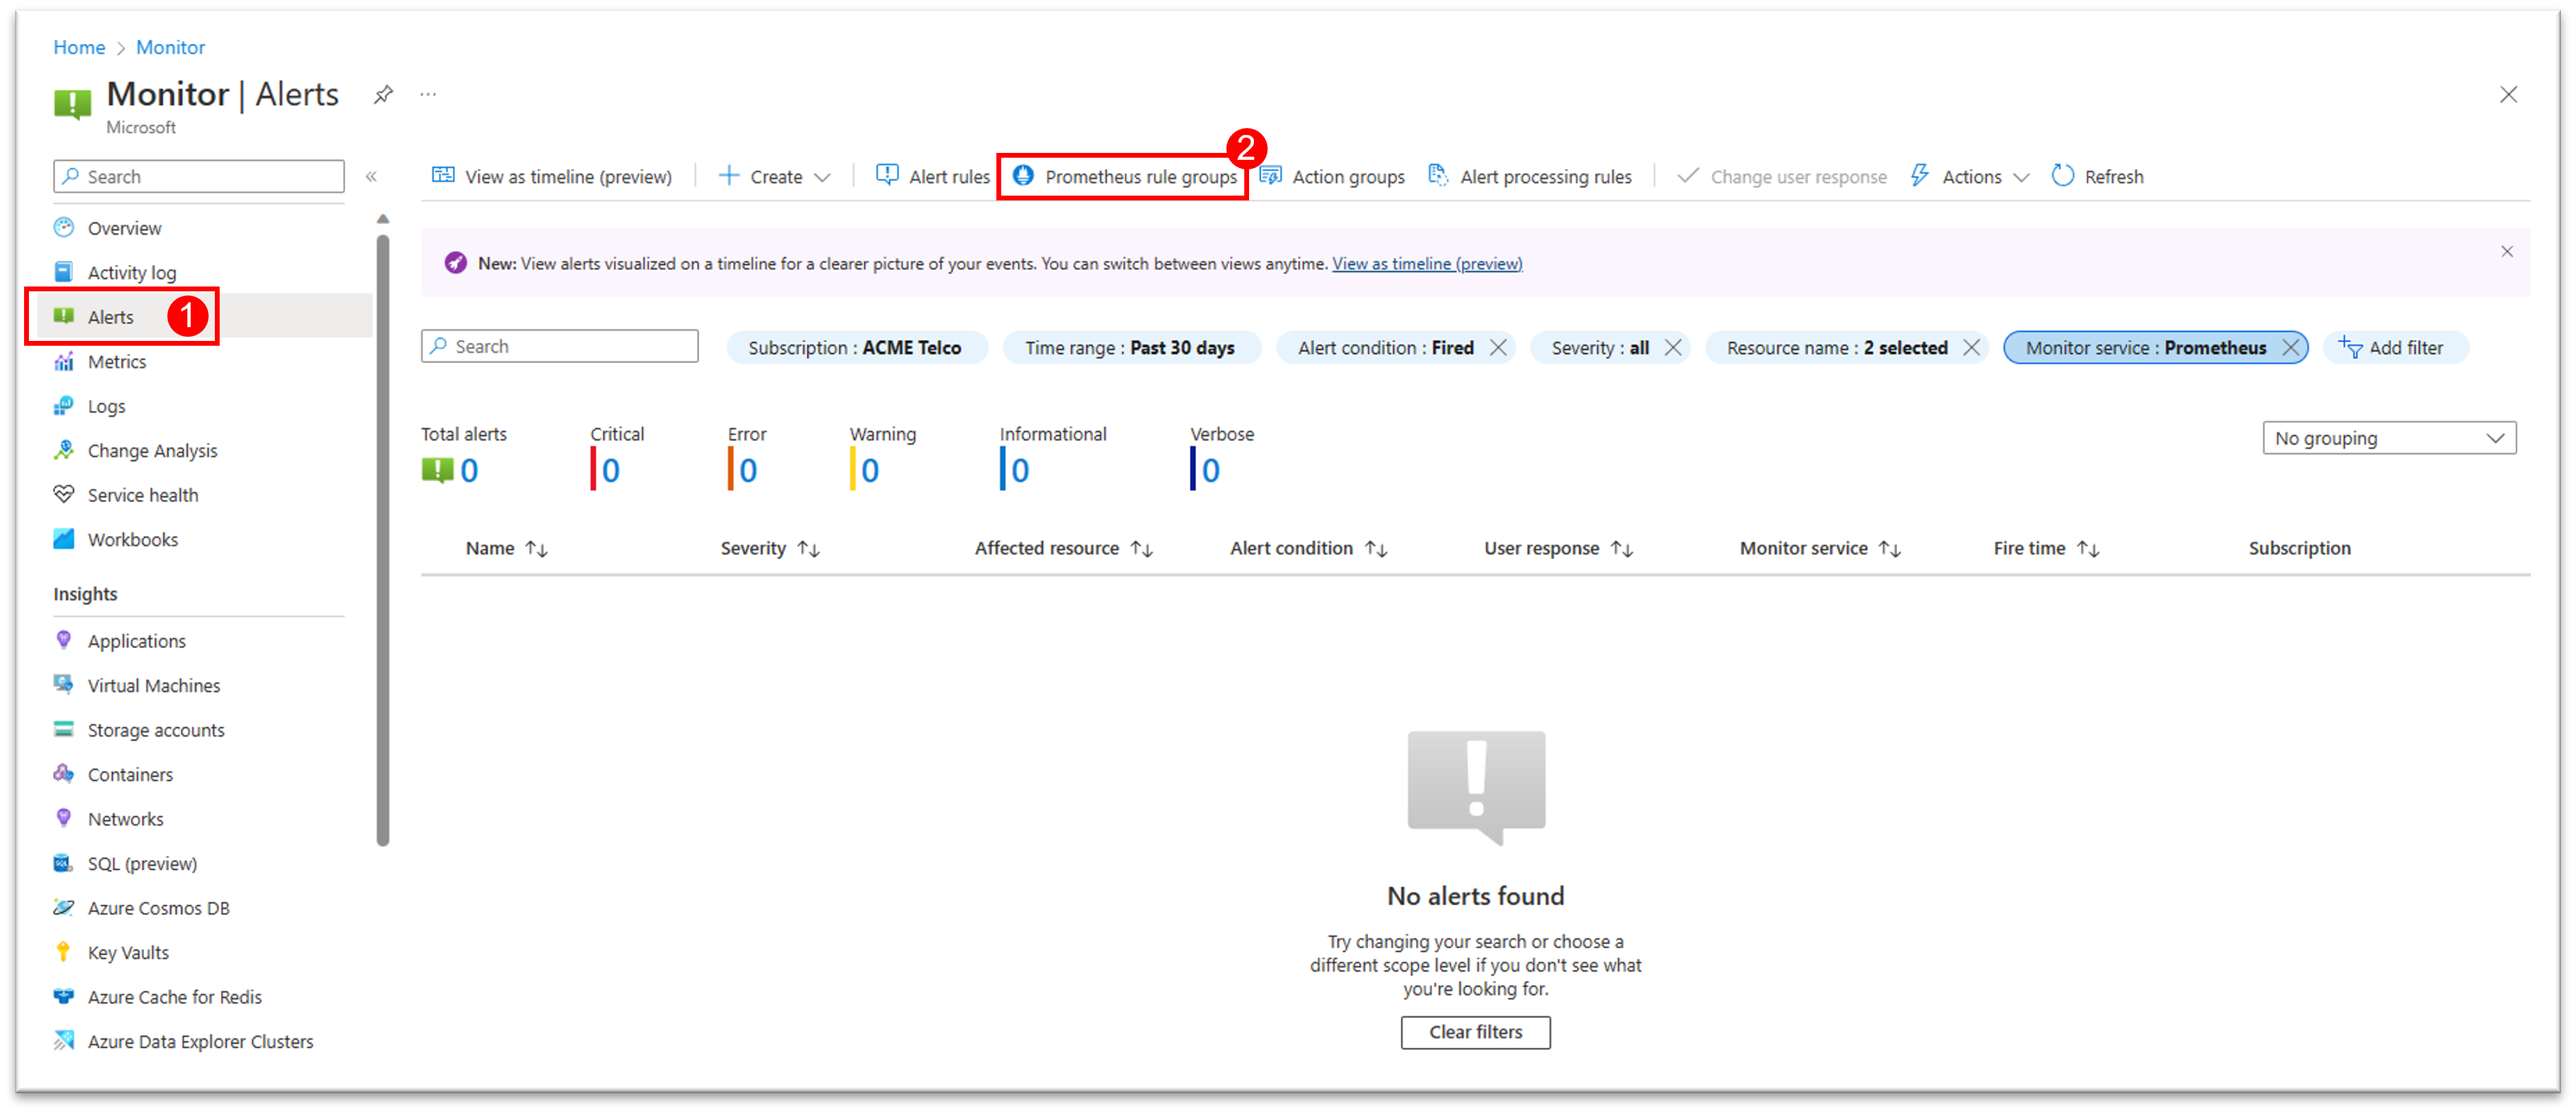
- Select + Create to open up the rule group creation wizard
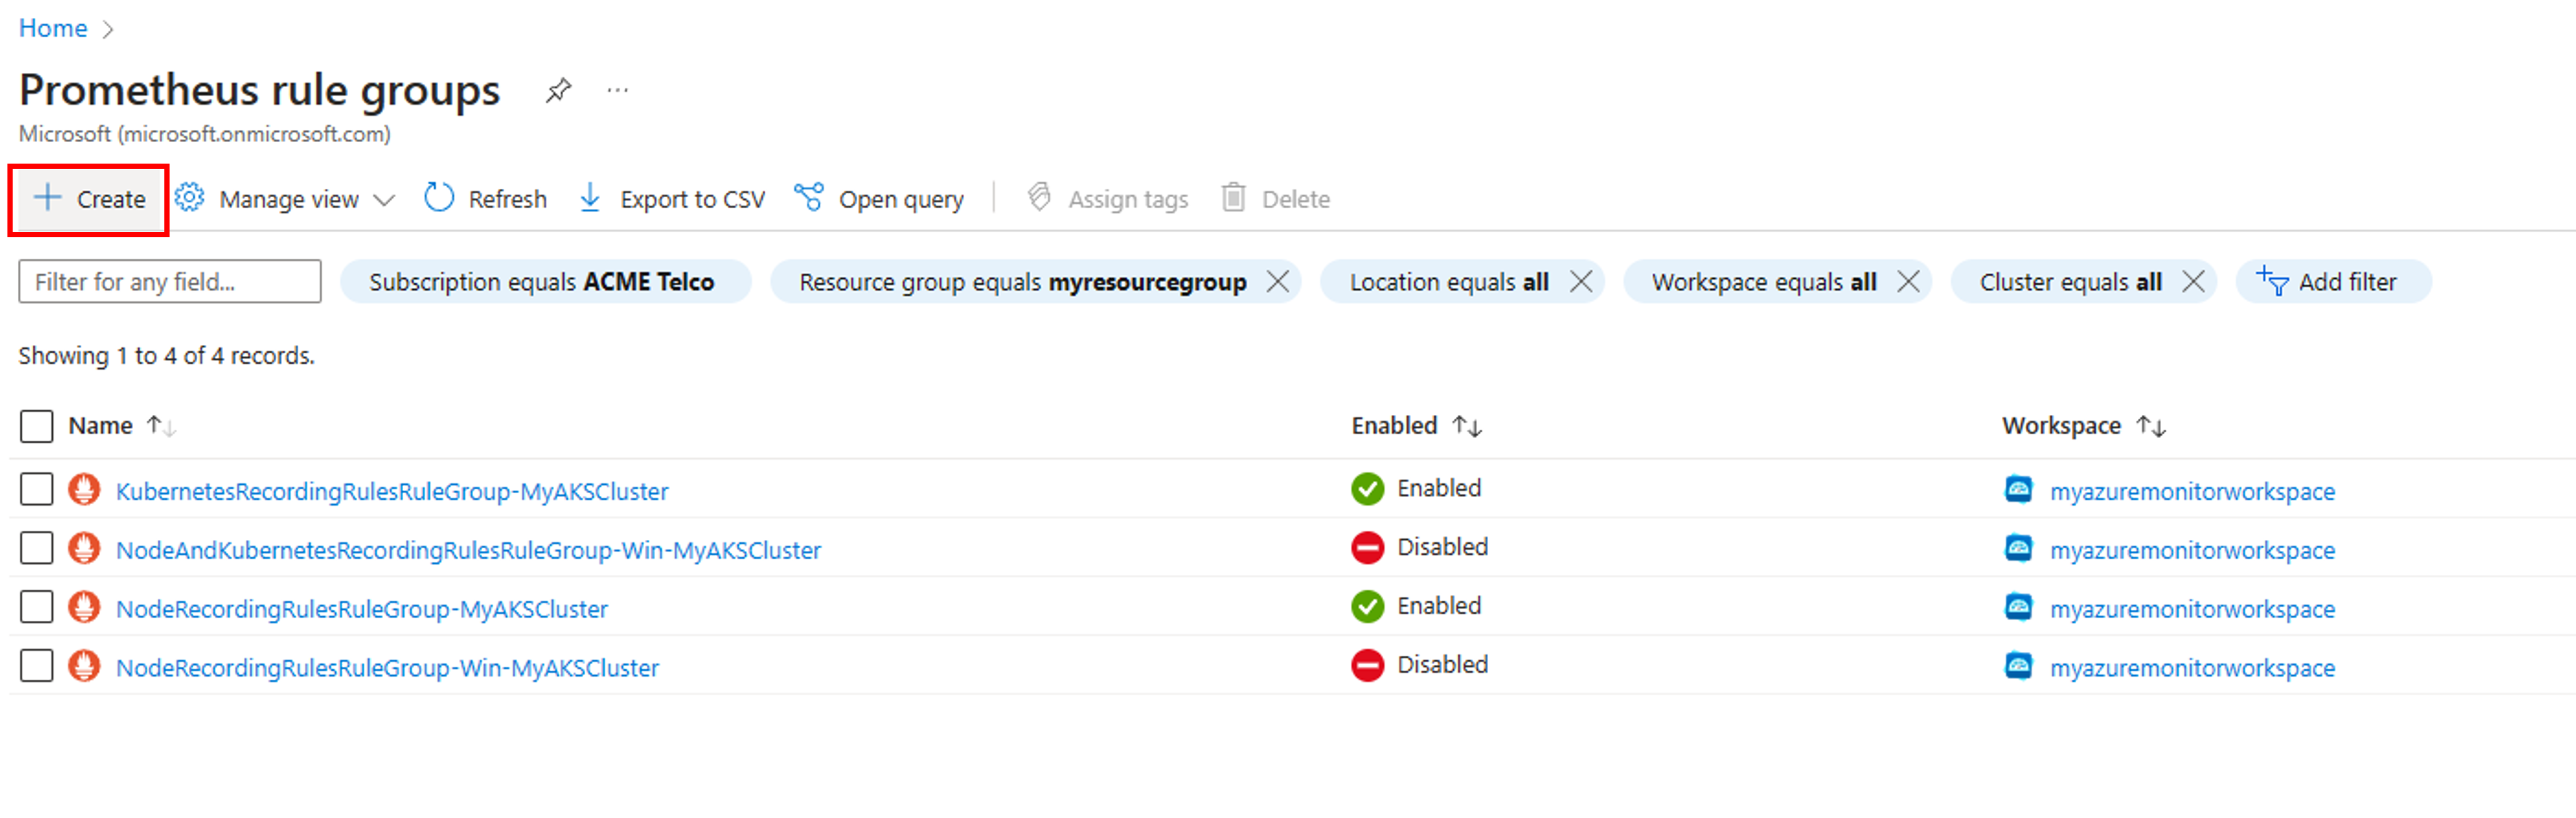
To edit a new rule group from the portal home page:
- In the portal, select Monitor > Alerts.
- Select Prometheus Rule Groups to see the list of existing rule groups in your subscription
- Select the desired rule group to go to enter edit mode.
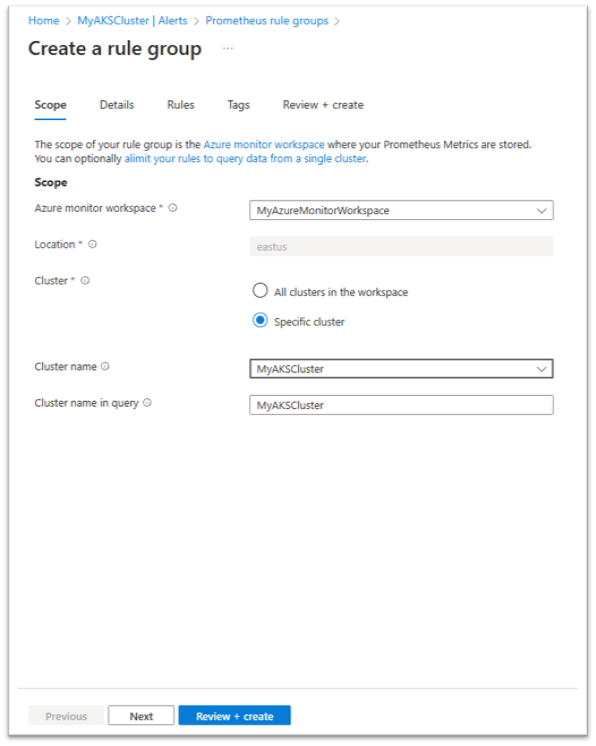
Configure the rule group scope
On the rule group Scope tab:
- Select the Azure Monitor workspace from a list of workspaces available in your subscriptions. The rules in this group query data from this workspace.
- To limit your rule group to a cluster scope, select the Specific cluster option:
- Select the Cluster from the list of clusters that are already connected to the selected Azure Monitor workspace.
- The default Cluster name value is entered for you. You should change this value only if you've changed your cluster label value using cluster_alias.
- Select Next to configure the rule group details
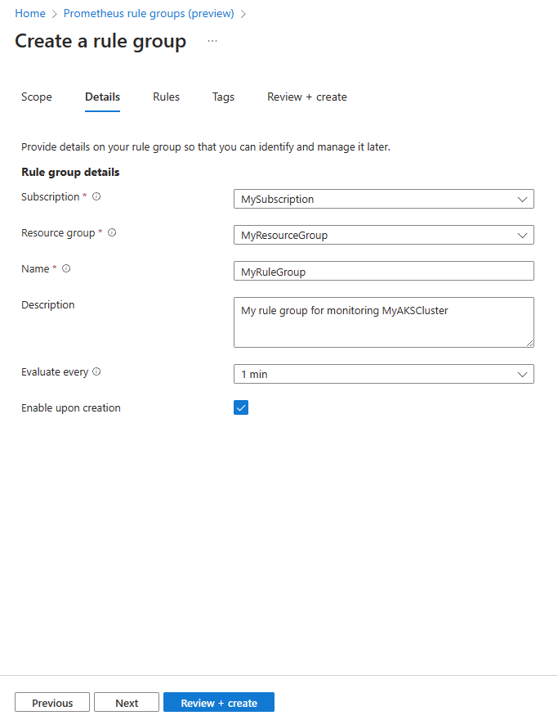
Configure the rule group details
On the rule group Details tab:
- Select the Subscription and Resource group where the rule group should be stored.
- Enter the rule group Name and Description. The rule group name can't be changed after the rule group is created.
- Select the Evaluate every period for the rule group. 1 minute is the default.
- Select if the rule group is to be enabled when created.
- Select Next to configure the rules in the group.
Configure the rules in the group
On the rule group Rules tab you can see the list of recording rules and alert rules in the group.
You can add rules up to the limit of 20 rules in a single group.
Rules are evaluated in the order they appear in the group. You can change the order of rules using the move up and move down options.
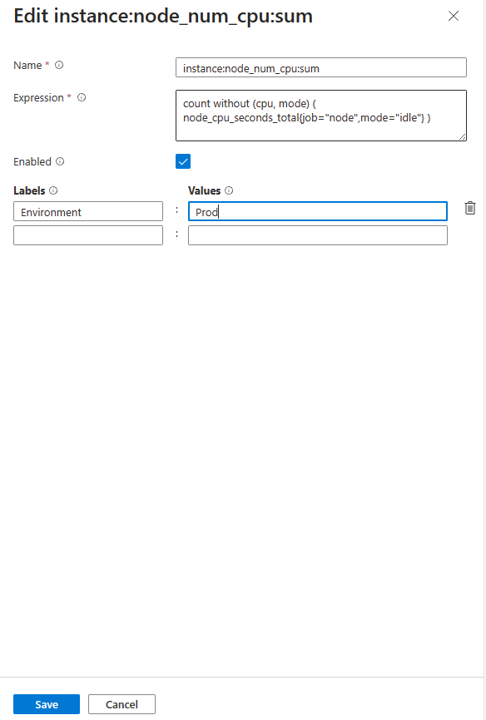
To add a new recording rule:
- Select + Add recording rule to open the Create a recording rule pane.
- Enter the Name of the rule. This name is the name of the metric created by the rule.
- Enter the PromQL Expression for the rule.
- Select if the rule is to be enabled when created.
- You can enter optional Labels key/value pairs for the rule. These labels are added to the metric created by the rule.
- Select Create to add the new rule to the rule list.
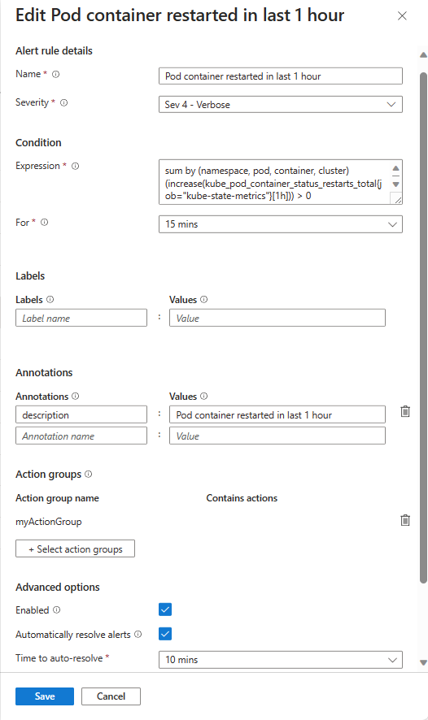
- To add a new alert rule:
- Select + Add alert rule to open the "Create an alert rule" pane.
- Select the Severity of alerts fired by this rule.
- Enter the Name of the rule. This name is the name of alerts fired by the rule.
- Enter the PromQL Expression for the rule.
- Select the For value for the period between the alert expression first becomes true and until the alert is fired.
- You can enter optional Annotations key/value pairs for the rule. These annotations are added to alerts fired by the rule.
- You can enter optional Labels key/value pairs for the rule. These labels are added to the alerts fired by the rule.
- Select the action groups that the rule triggers.
- Select Automatically resolve alert to automatically resolve alerts if the rule condition is no longer true during the Time to auto-resolve period.
- Select if the rule is to be enabled when created.
- Select Create to add the new rule to the rule list.
Finish creating the rule group
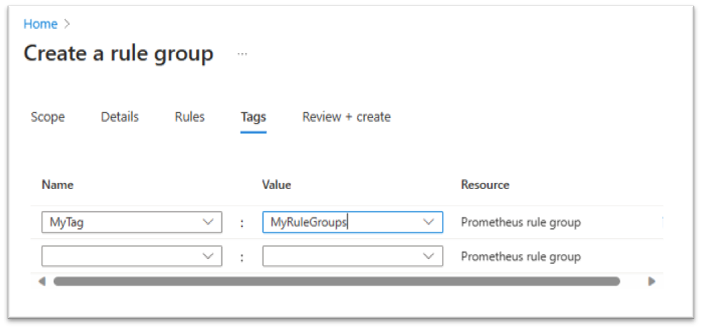
- On the Tags tab, set any required Azure resource tags to be added to the rule group resource.
- On the Review + create tab, the rule group is validated, and lets you know about any issues. On this tab, you can also select the View automation template option, and download the template for the group you're about to create.
- When validation passes and you've reviewed the settings, select the Create button.
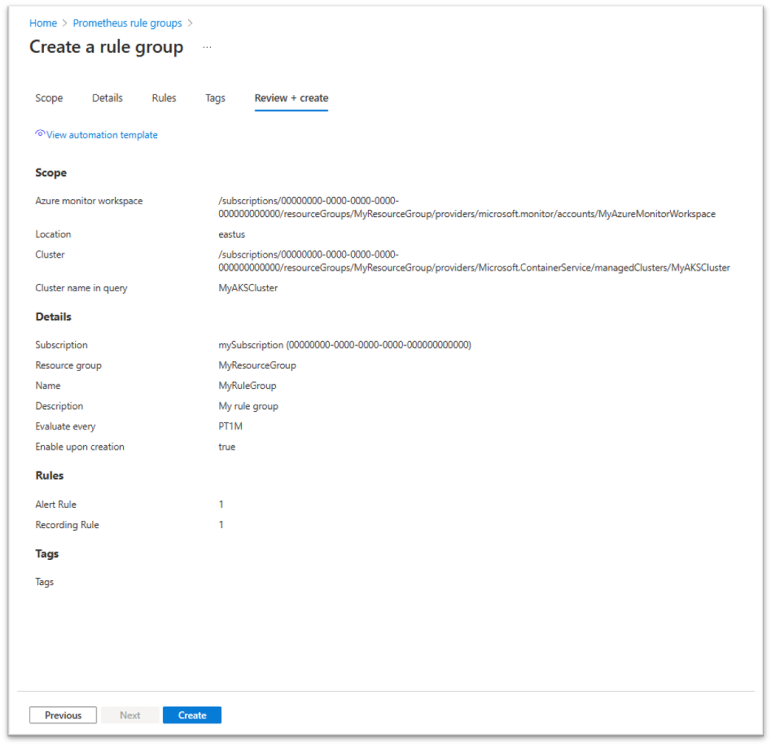
- You can follow up on the rule group deployment to make sure it completes successfully or be notified on any error.
Creating Prometheus rule group using Resource Manager template
You can use a Resource Manager template to create and configure Prometheus rule groups, alert rules, and recording rules. Resource Manager templates enable you to programmatically create and configure rule groups in a consistent and reproducible way across all your environments.
The basic steps are as follows:
- Use the following template as a JSON file that describes how to create the rule group.
- Deploy the template using any deployment method, such as Azure portal, Azure CLI, Azure PowerShell, or Rest API.
Template example for a Prometheus rule group
Following is a sample template that creates a Prometheus rule group, including one recording rule and one alert rule. This template creates a resource of type Microsoft.AlertsManagement/prometheusRuleGroups. The scope of this group is limited to a single AKS cluster. The rules are executed in the order they appear within a group.
{
    "$schema": "https://schema.management.azure.com/schemas/2019-04-01/deploymentTemplate.json#",
    "contentVersion": "1.0.0.0",
    "parameters": {},
    "variables": {},
    "resources": [
        {
           "name": "sampleRuleGroup",
           "type": "Microsoft.AlertsManagement/prometheusRuleGroups",
           "apiVersion": "2023-03-01",
           "location": "northcentralus",
           "properties": {
                "description": "Sample Prometheus Rule Group",
                "scopes": [
                    "/subscriptions/<subscription-id>/resourcegroups/<resource-group-name>/providers/microsoft.monitor/accounts/<azure-monitor-workspace-name>",
                    "/subscriptions/<subscription-id>/resourcegroups/<resource-group-name>/providers/microsoft.containerservice/managedclusters/<myClusterName>"
                ],
                "enabled": true,
                "clusterName": "<myCLusterName>",
                "interval": "PT1M",
                "rules": [
                    {
                        "record": "instance:node_cpu_utilisation:rate5m",
                        "expression": "1 - avg without (cpu) (sum without (mode)(rate(node_cpu_seconds_total{job=\"node\", mode=~\"idle|iowait|steal\"}[5m])))",
                        "labels": {
                            "workload_type": "job"
                        },
                        "enabled": true
                    },
                    {
                        "alert": "KubeCPUQuotaOvercommit",
                        "expression": "sum(min without(resource) (kube_resourcequota{job=\"kube-state-metrics\", type=\"hard\", resource=~\"(cpu|requests.cpu)\"})) /  sum(kube_node_status_allocatable{resource=\"cpu\", job=\"kube-state-metrics\"}) > 1.5",
                        "for": "PT5M",
                        "labels": {
                            "team": "prod"
                        },
                        "annotations": {
                            "description": "Cluster has overcommitted CPU resource requests for Namespaces.",
                            "runbook_url": "https://github.com/kubernetes-monitoring/kubernetes-mixin/tree/master/runbook.md#alert-name-kubecpuquotaovercommit",
                            "summary": "Cluster has overcommitted CPU resource requests."
                        },
                        "enabled": true,
                        "severity": 3,
                        "resolveConfiguration": {
                            "autoResolved": true,
                            "timeToResolve": "PT10M"
                        },
                        "actions": [
                            {
                               "actionGroupID": "/subscriptions/<subscription-id>/resourcegroups/<resource-group-name>/providers/microsoft.insights/actiongroups/<action-group-name>"
                            }
                        ]
                    }
                ]
            }
        }
    ]
}
The following tables describe each of the properties in the rule definition.
Rule group
The rule group contains the following properties.
| Name | Required | Type | Description |
|---|---|---|---|
name |
True | string | Prometheus rule group name |
type |
True | string | Microsoft.AlertsManagement/prometheusRuleGroups |
apiVersion |
True | string | 2023-03-01 |
location |
True | string | Resource location out of supported regions. |
properties.description |
False | string | Rule group description. |
properties.scopes |
True | string[] | Must include the target Azure Monitor workspace ID. Can optionally include one more cluster ID, as well. |
properties.enabled |
False | boolean | Enable/disable group. Default is true. |
properties.clusterName |
False | string | Must match the cluster label that is added to metrics scraped from your target cluster. By default, set to the last part (resource name) of cluster ID that appears in scopes[]. |
properties.interval |
False | string | Group evaluation interval. Default = PT1M |
Recording rules
The rules section contains the following properties for recording rules.
| Name | Required | Type | Description |
|---|---|---|---|
record |
True | string | Recording rule name. This name is used for the new time series. |
expression |
True | string | PromQL expression to calculate the new time series value. |
labels |
True | string | Prometheus rule labels key-value pairs. These labels are added to the recorded time series. |
enabled |
False | boolean | Enable/disable group. Default is true. |
Alert rules
The rules section contains the following properties for alerting rules.
| Name | Required | Type | Description | Notes |
|---|---|---|---|---|
alert |
False | string | Alert rule name | |
expression |
True | string | PromQL expression to evaluate. | |
for |
False | string | Alert firing timeout. Values - PT1M, PT5M etc. | |
labels |
False | object | labels key-value pairs | Prometheus alert rule labels. These labels are added to alerts fired by this rule. |
rules.annotations |
False | object | Annotations key-value pairs to add to the alert. | |
enabled |
False | boolean | Enable/disable group. Default is true. | |
rules.severity |
False | integer | Alert severity. 0-4, default is 3 (informational) | |
rules.resolveConfigurations.autoResolved |
False | boolean | When enabled, the alert is automatically resolved when the condition is no longer true. Default = true | |
rules.resolveConfigurations.timeToResolve |
False | string | Alert auto resolution timeout. Default = "PT5M" | |
rules.action[].actionGroupId |
false | string | One or more action group resource IDs. Each is activated when an alert is fired. |
Converting Prometheus rules file to a Prometheus rule group ARM template
If you have a Prometheus rules configuration file (in YAML format), you can now convert it to an Azure Prometheus rule group ARM template, using the az-prom-rules-converter utility. The rules file can contain definition of one or more rule groups.
In addition to the rules file, you must provide the utility with other properties that are needed to create the Azure Prometheus rule groups, including: subscription, resource group, location, target Azure Monitor workspace, target cluster ID and name, and action groups (used for alert rules). The utility creates a template file that can be deployed directly or within a deployment pipe providing some of these properties as parameters. Properties that you provide to the utility are used for all the rule groups in the template. For example, all rule groups in the file are created in the same subscription, resource group and location, and using the same Azure Monitor workspace. If an action group is provided as a parameter to the utility, the same action group is used in all the alert rules in the template. If you want to change this default configuration (for example, use different action groups in different rules) you can edit the resulting template according to your needs, before deploying it.
Note
The az-prom-convert-utility is provided as a courtesy tool. We recommend that you review the resulting template and verify it matches your intended configuration.
Creating Prometheus rule group using Azure CLI
You can use Azure CLI to create and configure Prometheus rule groups, alert rules, and recording rules. The following code examples use Azure Cloud Shell.
In the portal, select Cloud Shell. At the prompt, use the commands that follow.
To create a Prometheus rule group, use the
az alerts-management prometheus-rule-group createcommand. You can see detailed documentation on the Prometheus rule group create command in theaz alerts-management prometheus-rule-group createsection of the Azure CLI commands for creating and managing Prometheus rule groups.
Example: Create a new Prometheus rule group with rules
az alerts-management prometheus-rule-group create -n TestPrometheusRuleGroup -g TestResourceGroup -l westus --enabled --description "test" --interval PT10M --scopes "/subscriptions/00000000-0000-0000-0000-000000000000/resourcegroups/testrg/providers/microsoft.monitor/accounts/testaccount" --rules [{"record":"test","expression":"test","labels":{"team":"prod"}},{"alert":"Billing_Processing_Very_Slow","expression":"test","enabled":"true","severity":2,"for":"PT5M","labels":{"team":"prod"},"annotations":{"annotationName1":"annotationValue1"},"resolveConfiguration":{"autoResolved":"true","timeToResolve":"PT10M"},"actions":[{"actionGroupId":"/subscriptions/00000000-0000-0000-0000-000000000000/resourceGroups/testrg/providers/microsoft.insights/actionGroups/test-action-group-name1","actionProperties":{"key11":"value11","key12":"value12"}},{"actionGroupId":"/subscriptions/00000000-0000-0000-0000-000000000000/resourceGroups/testrg/providers/microsoft.insights/actionGroups/test-action-group-name2","actionProperties":{"key21":"value21","key22":"value22"}}]}]
Create a new Prometheus rule group with PowerShell
To create a Prometheus rule group using PowerShell, use the new-azprometheusrulegroup cmdlet.
Example: Create Prometheus rule group definition with rules.
$rule1 = New-AzPrometheusRuleObject -Record "job_type:billing_jobs_duration_seconds:99p5m"
$action =  New-AzPrometheusRuleGroupActionObject -ActionGroupId /subscriptions/fffffffff-ffff-ffff-ffff-ffffffffffff/resourceGroups/MyresourceGroup/providers/microsoft.insights/actiongroups/MyActionGroup -ActionProperty @{"key1" = "value1"}
$Timespan = New-TimeSpan -Minutes 15
$rule2 = New-AzPrometheusRuleObject -Alert Billing_Processing_Very_Slow -Expression "job_type:billing_jobs_duration_seconds:99p5m > 30" -Enabled $false -Severity 3 -For $Timespan -Label @{"team"="prod"} -Annotation @{"annotation" = "value"} -ResolveConfigurationAutoResolved $true -ResolveConfigurationTimeToResolve $Timespan -Action $action
$rules = @($rule1, $rule2)
$scope = "/subscriptions/fffffffff-ffff-ffff-ffff-ffffffffffff/resourcegroups/MyresourceGroup/providers/microsoft.monitor/accounts/MyAccounts"
New-AzPrometheusRuleGroup -ResourceGroupName MyresourceGroup -RuleGroupName MyRuleGroup -Location eastus -Rule $rules -Scope $scope -Enabled
View Prometheus rule groups
You can view your Prometheus rule groups and their included rules in the Azure portal in one of the following ways:
- In the portal home page, in the search box, look for Prometheus Rule Groups.
- In the portal home page, select Monitor > Alerts, then select Prometheus Rule Groups.
- In the page of a specific Azure Kubernetes Services (AKS) resource, or a specific Azure Monitor Workspace (AMW), select Monitor > Alerts, then select Prometheus Rule Groups, to view a list of rule groups for this specific resource. You can select a rule group from the list to view or edit its details.
View the resource health states of your Prometheus rule groups
You can now view the resource health state of your Prometheus rule group in the portal. This can allow you to detect problems in your rule groups, such as incorrect configuration, or query throttling problems
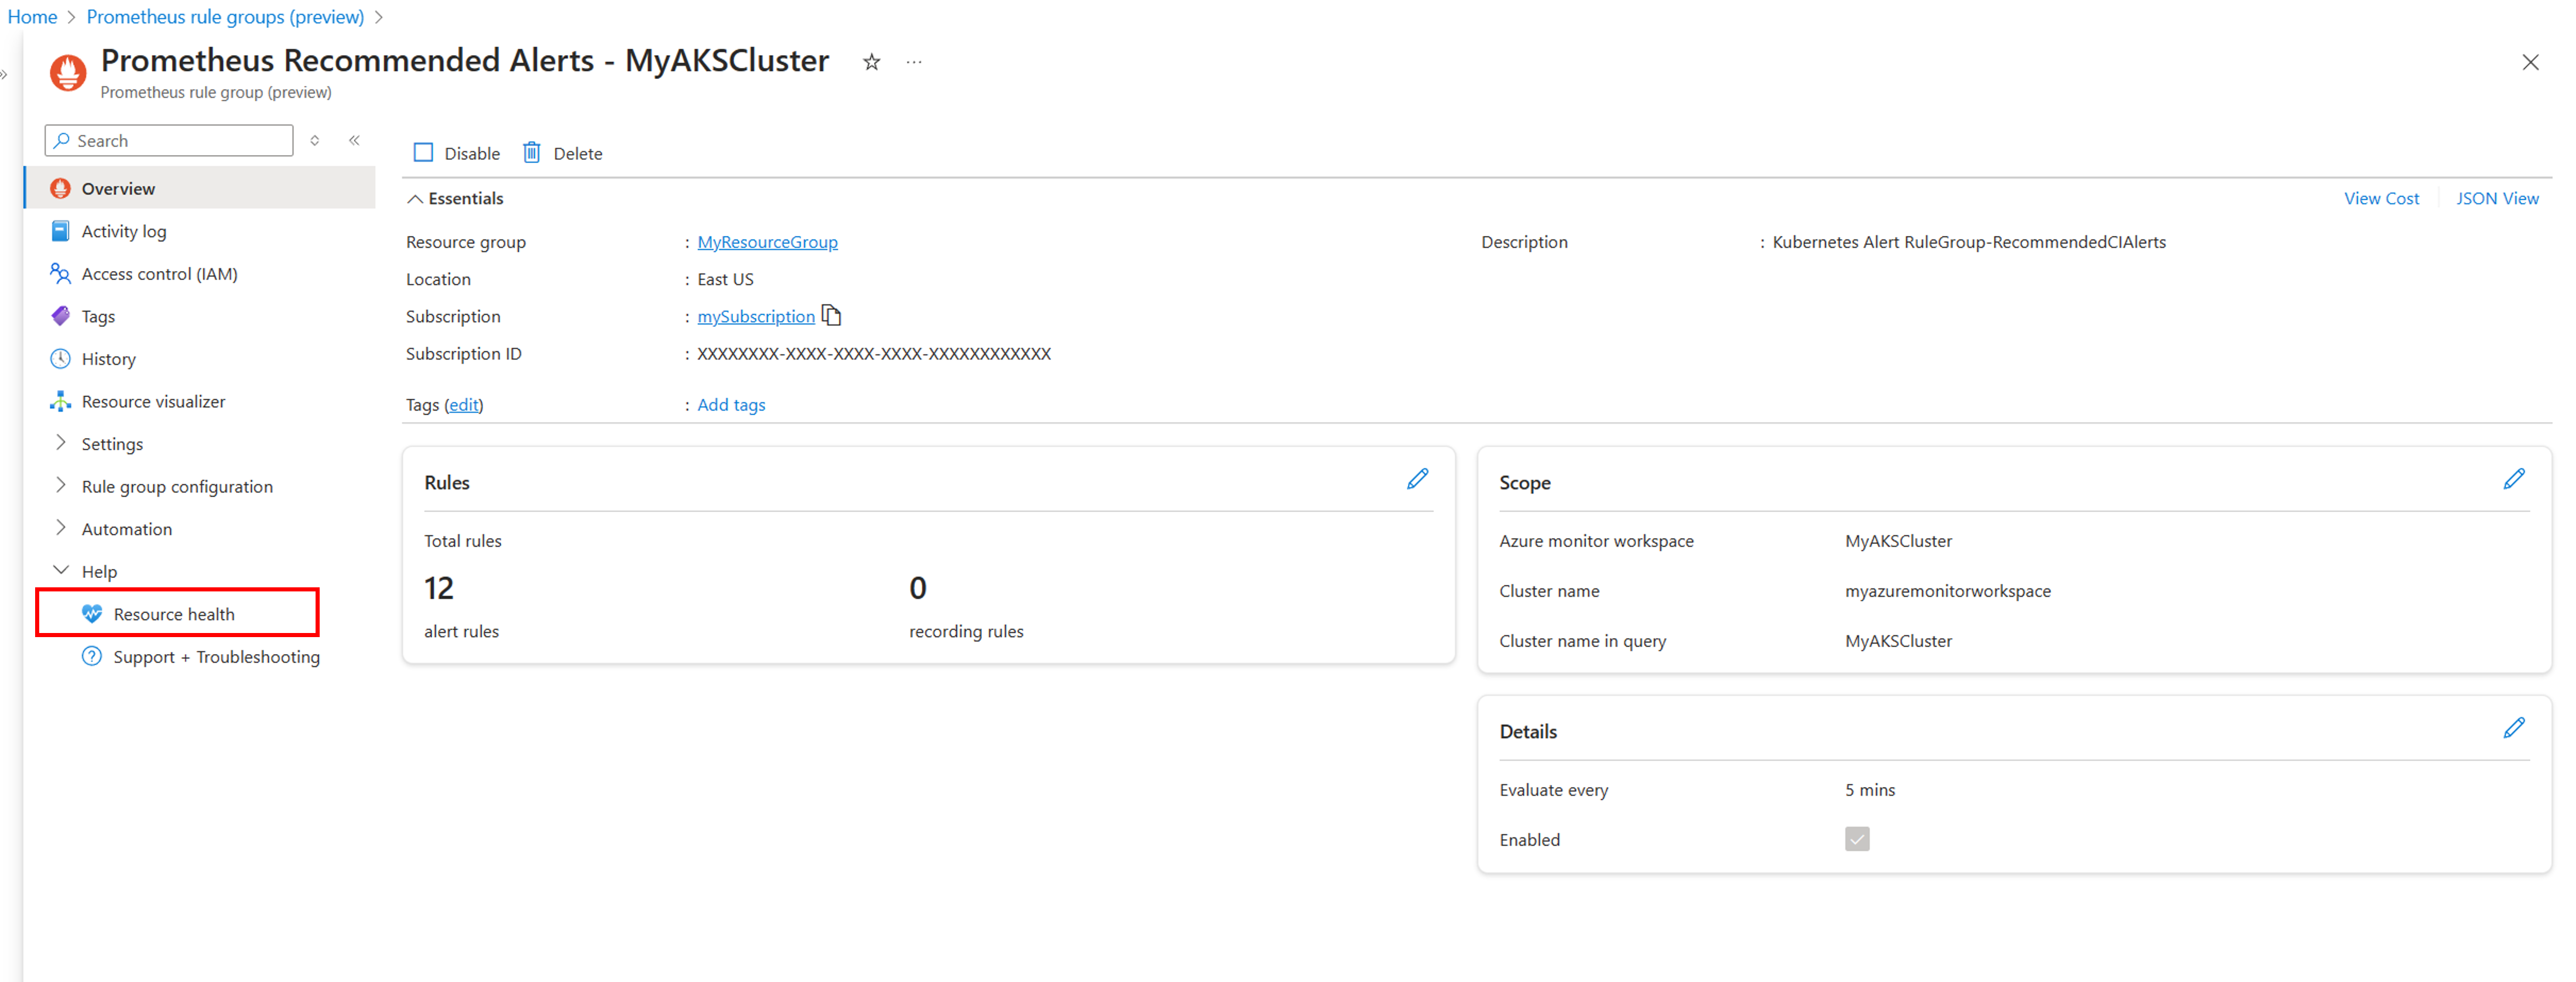
- In the portal, go to the overview of your Prometheus rule group you would like to monitors
- From the left pane, under Help, select Resource health.
- In the rule group resource health screen, you can see the current availability state of the rule group, as well as a history of recent resource health events, up to 30 days back.
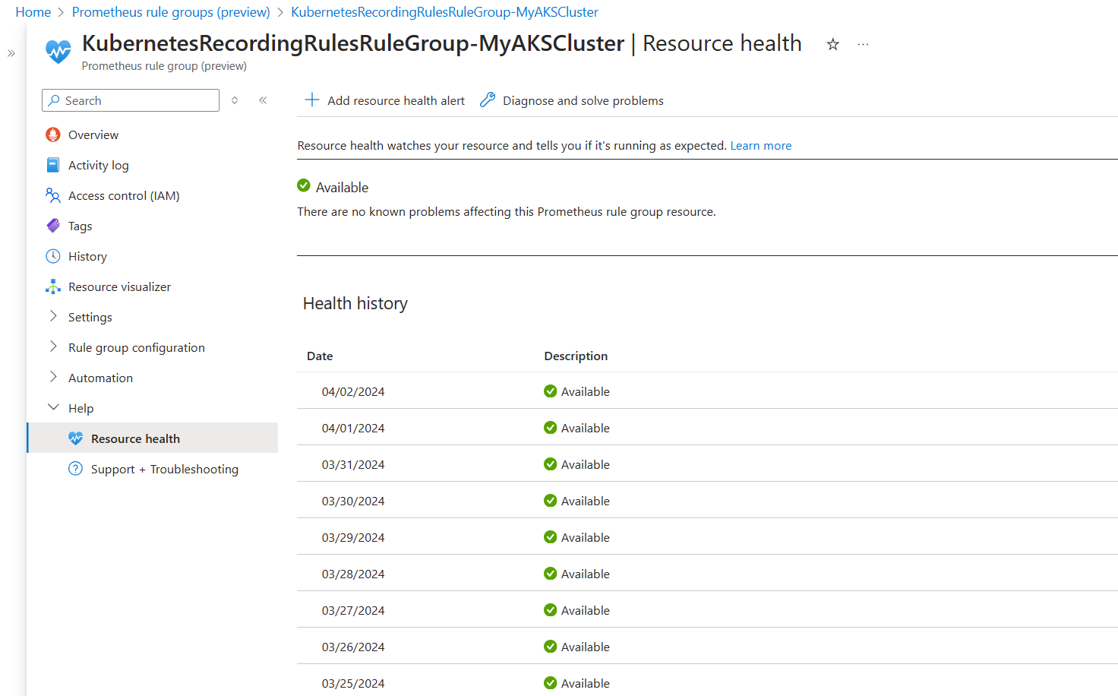
- If the rule group is marked as Available, it is working as expected.
- If the rule group is marked as Degraded, one or more rules in the group are not working as expected. This can be due to the rule query being throttled, or to other issues that may cause the rule evaluation to fail. Expand the status entry for more information on the detected problem, as well as suggestions for mitigation or for further troubleshooting.
- If the rule group is marked as Unavailable, the entire rule group is not working as expected. This can be due the configuration issue (for example, the Azure Monitor Workspace can't be detected) or due to internal service issues. Expand the status entry for more information on the detected problem, as well as suggestions for mitigation or for further troubleshooting.
- If the rule group is marked as Unknown, the entire rule group is disabled or is in an unknown state.
Disable and enable rule groups
To enable or disable a rule, select the rule group in the Azure portal. Select either Enable or Disable to change its status.
Next steps
Feedback
Coming soon: Throughout 2024 we will be phasing out GitHub Issues as the feedback mechanism for content and replacing it with a new feedback system. For more information see: https://aka.ms/ContentUserFeedback.
Submit and view feedback for