Note
Access to this page requires authorization. You can try signing in or changing directories.
Access to this page requires authorization. You can try changing directories.
Important
This feature is in Public Preview.
AI Runtime integrates with MLflow to provide experiment tracking and observability. MLflow provides a single place for a run's parameters, metrics, GPU system metrics, logs, and artifacts, whether you develop in a notebook, submit a workload with the databricks air CLI, or schedule a job.
What MLflow provides
An MLflow experiment groups related training runs, and each run provides a persistent record of the training configuration and results.
- Metrics and parameters: Record training loss, evaluation metrics, learning rates, and hyperparameters, then compare them across runs.
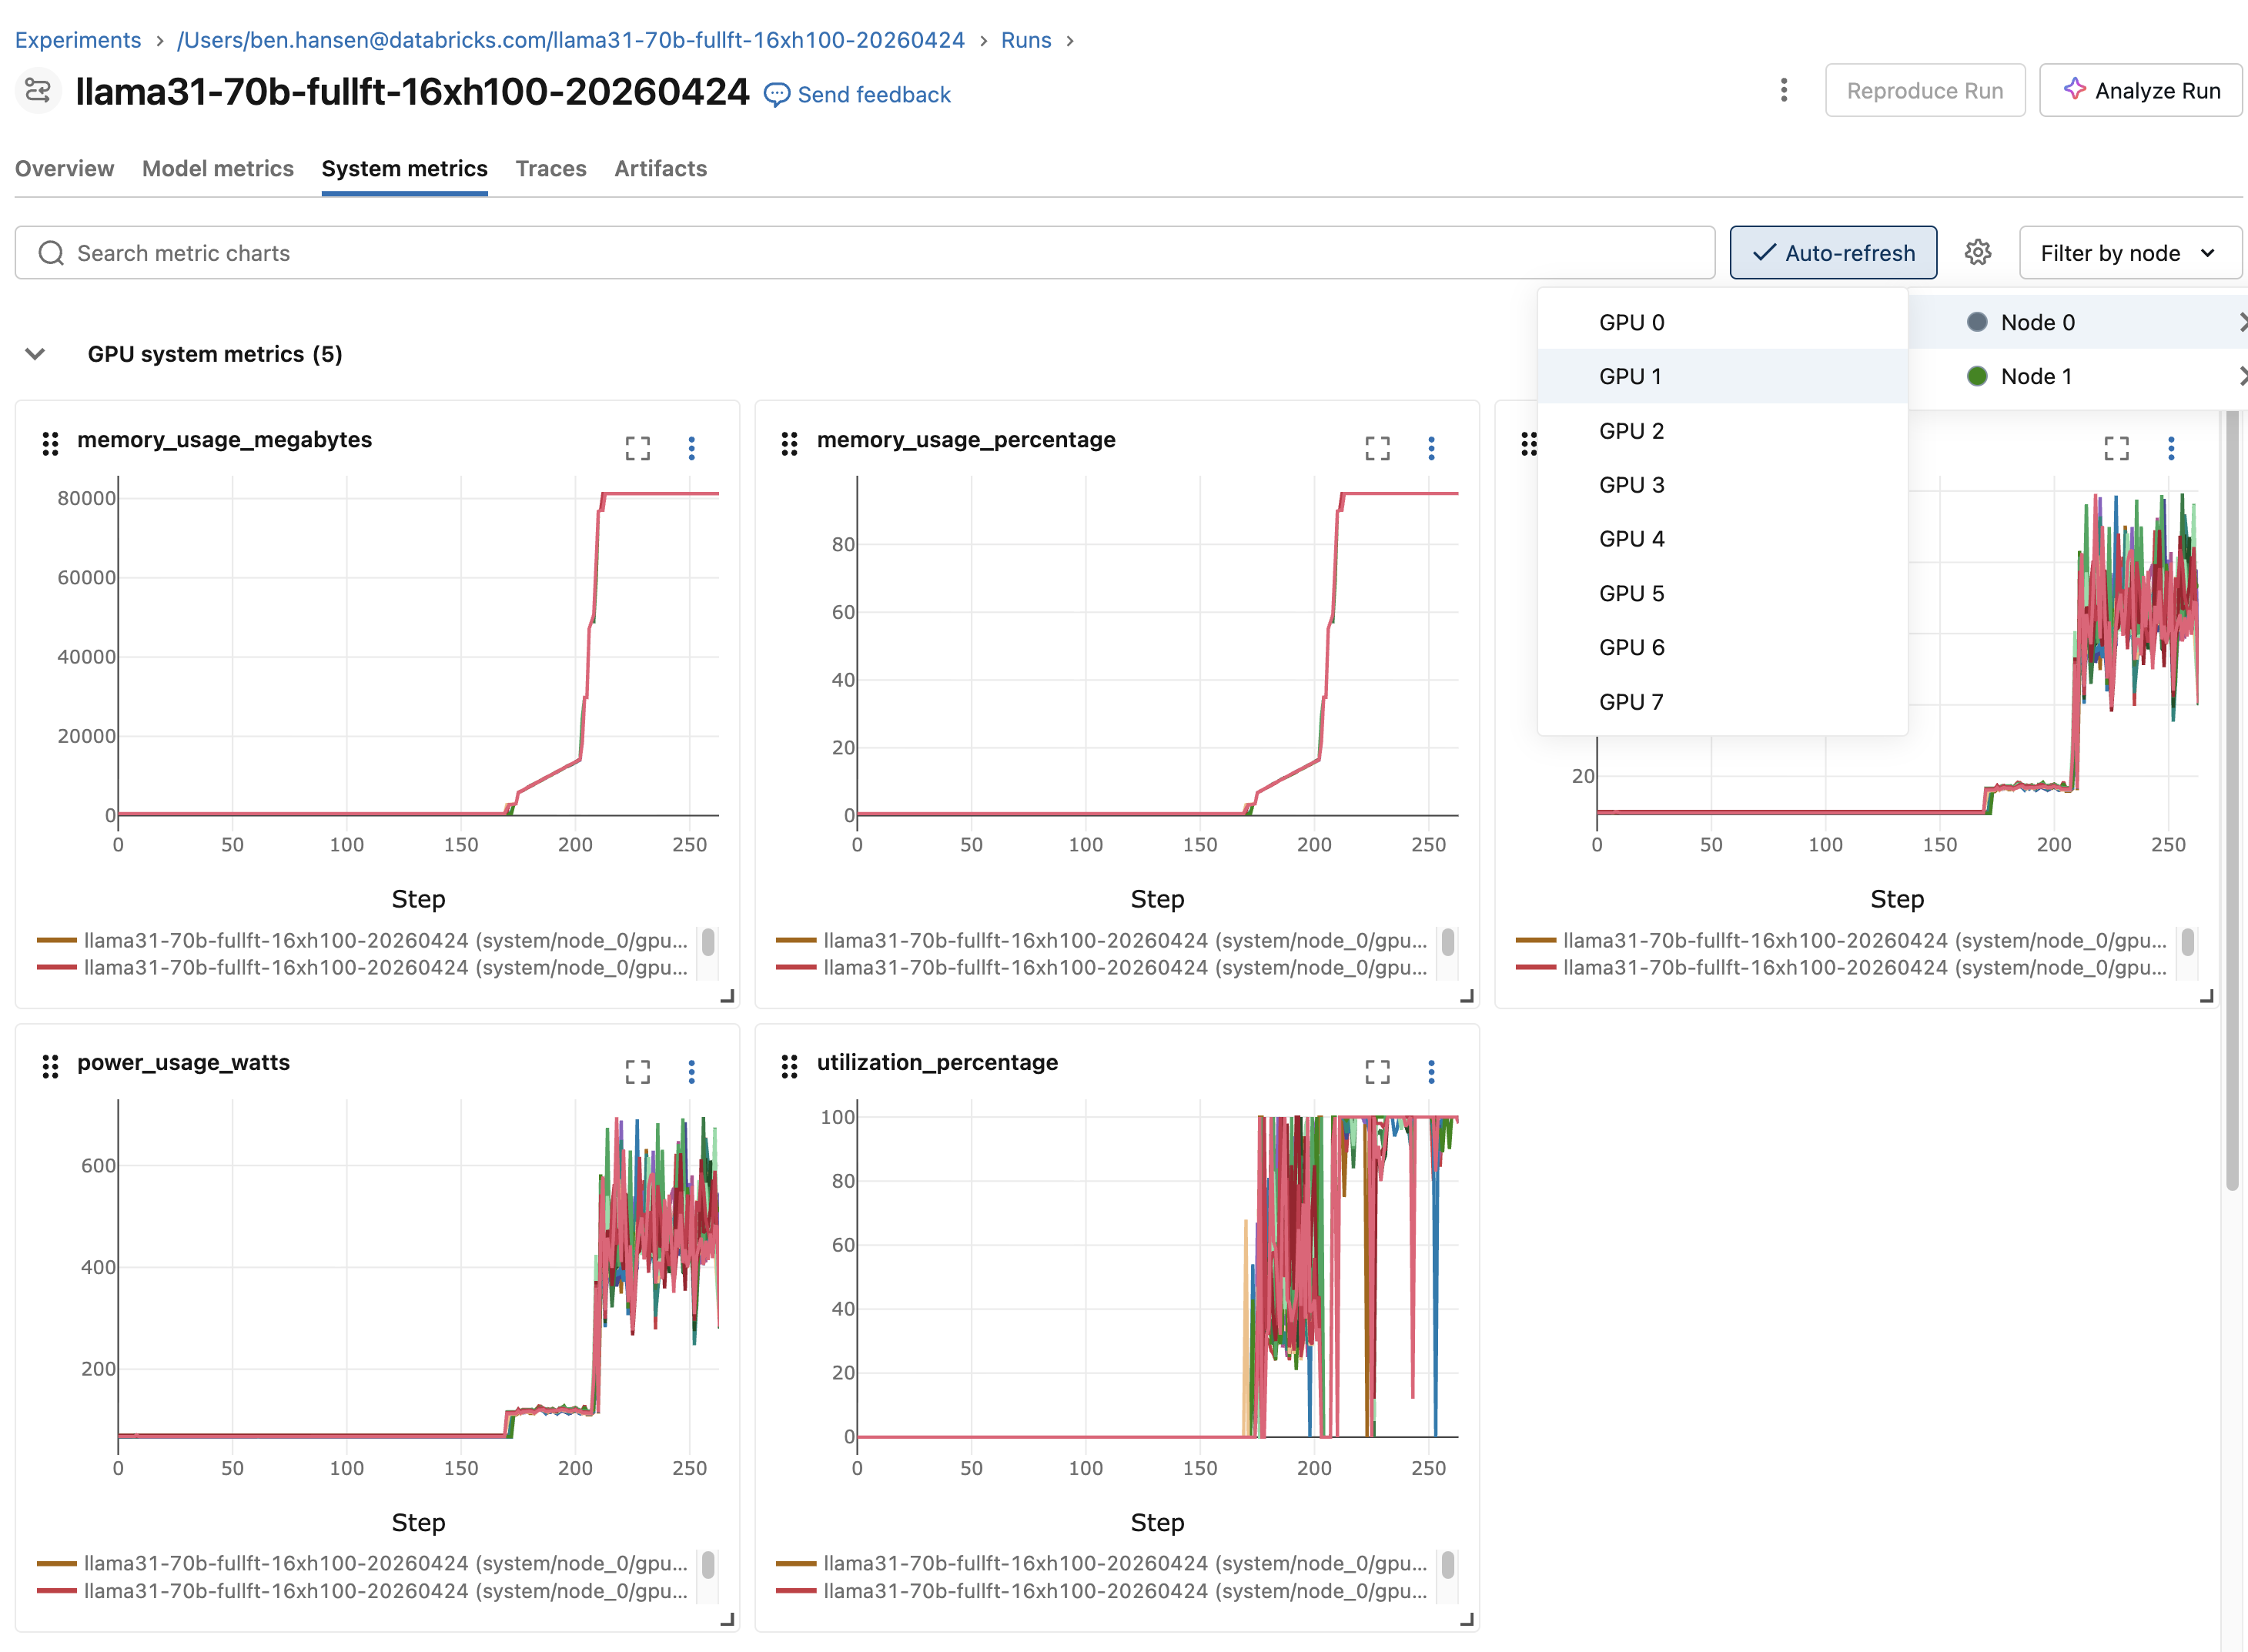
- System metrics: View GPU, CPU, and memory utilization for managed runs on the System metrics tab.
- Logs: View driver output for a job-backed workload on the run's Logs tab.
- Artifacts and models: Store model files, configurations, and other outputs with the run. Use a Unity Catalog volume for large or durable artifacts.
- Sharing and collaboration: Grant access to an experiment so that other workspace users can view and compare its runs. See Organize training runs with MLflow experiments.
- Framework integrations: Use MLflow integrations with Hugging Face Transformers, PyTorch Lightning, and other supported libraries.
For job-backed workloads, such as workloads submitted with databricks air run, the Azure Databricks job run complements MLflow by recording execution status, compute, attempts, and driver output.
How MLflow runs are created
How you start or join an MLflow run depends on how you start the workload:
| How you run the workload | How the MLflow run starts | How to select the experiment |
|---|---|---|
Databricks CLI (databricks air run) |
Each attempt creates a run automatically. | Set experiment_name in the workload YAML. |
Notebook with the Databricks AI Runtime SDK (.distributed()) |
Each call creates a run automatically. | Call mlflow.set_experiment() before .distributed(), or set MLFLOW_EXPERIMENT_NAME. |
| Code run directly in an attached notebook | No run is created automatically. Use mlflow.start_run() or autologging. |
Call mlflow.set_experiment() in the notebook. |
Scheduled ai_runtime_task |
The task creates a run automatically. | Set experiment in the task configuration. See AI Runtime task. |
After your code starts or joins the correct run, use the MLflow tracking API to record custom training data. For supported frameworks, you can use autologging instead of adding individual logging calls. For deep learning patterns, see MLflow 3 deep learning workflow.
Use the following practices when you configure MLflow tracking:
- Set
stepto a meaningful value such as the global batch or epoch. Log at an interval instead of every batch. MLflow limits the number of metric steps per run. See Resource limits. - For distributed training, log a metric from rank 0 only so that each value is recorded one time.
- For notebook workflows, use absolute experiment paths, such as
/Users/<username>/my-experimentor/Workspace/Shared/<team>/my-experiment. Put experiments that you want to share in a shared workspace folder. - Store large, durable checkpoints in a Unity Catalog volume. For checkpointing patterns, see Improve training performance and resiliency on AI Runtime.
Note
Use MLflow 3.7 and above for the examples on this page.
Track Databricks CLI workloads
When you submit a workload with databricks air run, AI Runtime creates a Azure Databricks job run for execution details and an MLflow run for experiment data. The original submission and its retries share one job run, while each attempt creates a separate MLflow run in the same experiment so that you can compare attempts.
GPU, CPU, and memory system metrics are captured automatically for each managed run and appear on the MLflow System metrics tab.
Configure and log to the run
Use the workload YAML to select the experiment and optionally configure the run name and artifact location. The following example shows the MLflow fields only:
experiment_name: my-training
mlflow_run_name: baseline-lr3e5
mlflow_artifact_location: /Volumes/main/default/mlflow-artifacts/my-training
For field requirements, defaults, and supported values, see Workload YAML reference.
AI Runtime exposes the managed run ID through MLFLOW_RUN_ID. To log your own parameters, metrics, and artifacts to that run, reopen it with the MLflow tracking API:
import os

import mlflow

# Log from rank 0 only because all nodes share the same MLFLOW_RUN_ID.
if os.environ.get("RANK", "0") == "0":
    with mlflow.start_run(run_id=os.environ["MLFLOW_RUN_ID"]):
        mlflow.log_param("learning_rate", 3e-4)
        for step, loss in enumerate(training_losses):
            mlflow.log_metric("train_loss", loss, step=step)
Find runs and logs
Logs are available through both the Databricks CLI and the MLflow run page. Use the following commands to find workloads, inspect a workload, and stream or download logs:
databricks air list --all-status
databricks air get <job-run-id>
databricks air logs <job-run-id>
databricks air logs <job-run-id> --node 2
databricks air logs <job-run-id> --download-to ./logs/
Track notebook workloads
From a notebook, you can run code directly in the attached session or run distributed training through the @distributed decorator from the Databricks AI Runtime SDK.
Run code directly in a notebook
Code run directly in an attached notebook does not automatically create an MLflow run. Select an experiment, then start a run or enable autologging:
import mlflow

mlflow.set_experiment("/Users/<username>/my-experiment")

with mlflow.start_run(run_name="baseline"):
    train()
To enable PyTorch Lightning autologging, use the following pattern:
mlflow.pytorch.autolog()

with mlflow.start_run(run_name="lightning-baseline"):
    trainer.fit(model, datamodule=datamodule)
For Hugging Face Transformers, configure TrainingArguments as follows:
from transformers import TrainingArguments

args = TrainingArguments(
    output_dir="/Volumes/<catalog>/<schema>/<volume>/checkpoints",
    report_to="mlflow",
    run_name="llama7b-sft-lr3e5",
    logging_steps=50,
)
Use the Databricks AI Runtime SDK
For distributed training from a notebook, use the @distributed decorator from the Databricks AI Runtime SDK (databricks-sdk-air). The SDK is available under the databricks.air namespace in GPU environment version 6 and above, or as serverless_gpu in GPU environment version 5 and below.
from databricks.air import distributed

@distributed()
def train():
    # Training code
    ...

train.distributed()
Each .distributed() call creates an MLflow run automatically. The default experiment is /Users/{WORKSPACE_USER}/{notebook-name}. To select another experiment, set it before you call .distributed():
mlflow.set_experiment("/Users/<username>/my-experiment")
train.distributed()
When you call .distributed() inside an active run, AI Runtime creates a nested child run:
with mlflow.start_run() as parent_run:
    train.distributed()
To resume a previous run, set MLFLOW_RUN_ID before .distributed():
import os

os.environ["MLFLOW_RUN_ID"] = "<previous-run-id>"
train.distributed()
Use the run link in the cell output or the notebook Experiment panel to open the MLflow run.
View logs
- Notebook output: Standard output and errors from the training code appear in the notebook cell output.
- MLflow logs: For job-backed notebook workloads such as
.distributed(remote=True)calls, the MLflow Logs tab displays output from the associated job run.
Monitor live GPU resources
The notebook GPU resources pane shows live GPU utilization, memory, and temperature for single-node and multi-node workloads. Use the MLflow System metrics tab when you need a persistent record tied to a run.
To open the pane, connect the notebook to AI Runtime, then click  GPU resources in the right side pane.
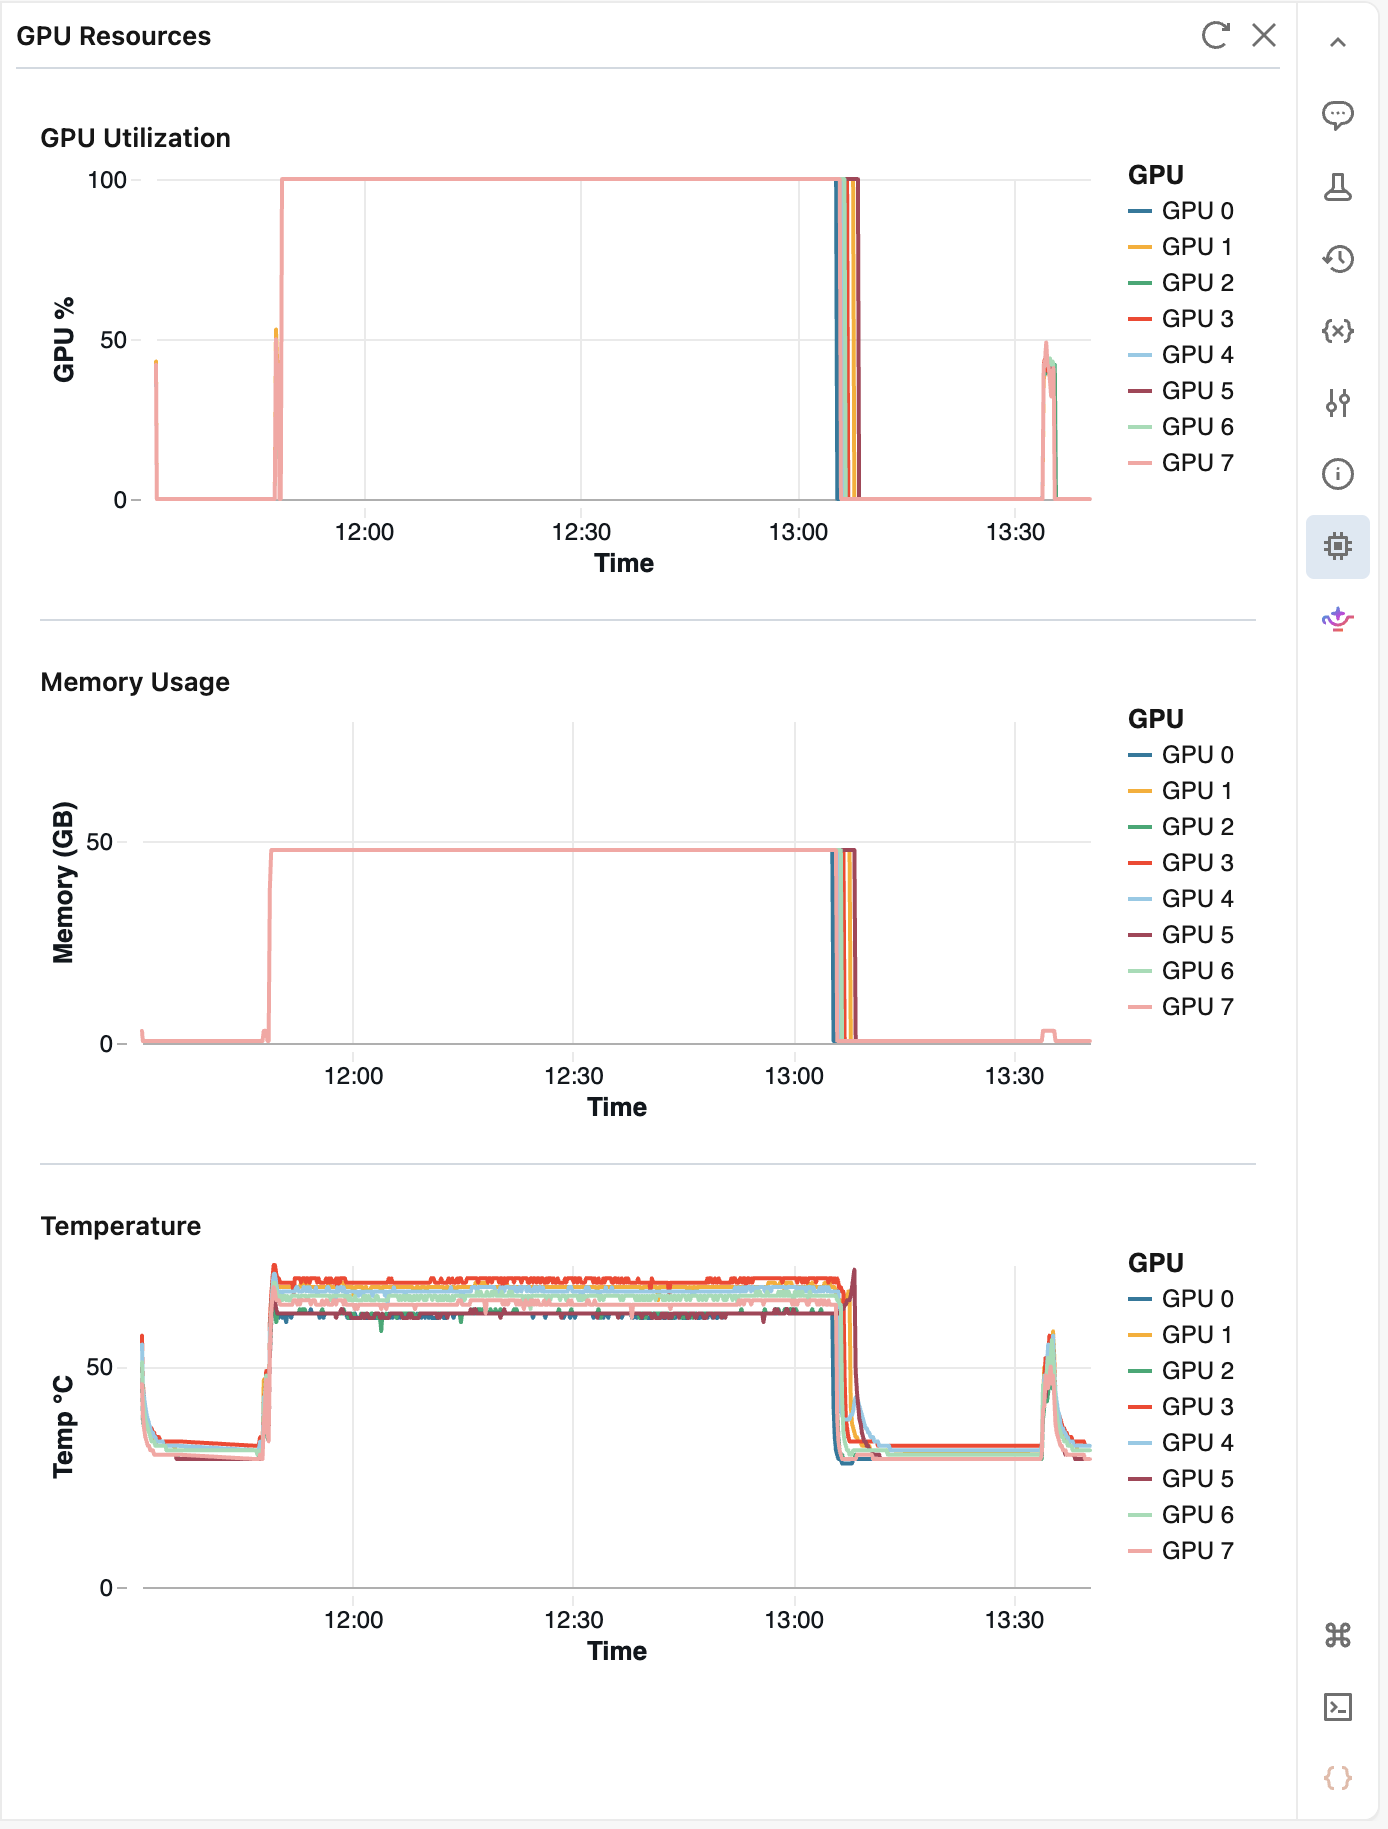
The pane polls metrics every 10 seconds and retains up to 2 hours of history. Click  Refresh to fetch the latest values. After 5 minutes of inactivity, the pane pauses. Reopen it to resume monitoring.
Troubleshoot access to logs
The Logs tab on an MLflow run page streams output from the associated Azure Databricks job run. Access to the MLflow experiment does not imply access to the job.
If the tab shows You don't have access to these logs, ask a user with Can Manage permission or a workspace admin to grant you at least Can View on the job. See Control access to a job.
Global limits in Azure Databricks
See Resource limits.