Track network and sensor activity with the event timeline
Activity detected by your Microsoft Defender for IoT sensors is recorded in the event timeline. Activity includes alerts and alert management actions, network events, and user operations such as user sign-in or user deletion.
The OT sensor's event timeline provides a chronological view and context of all network activity, to help determine the cause and effect of incidents. The timeline view makes it easy to extract information from network events, and more efficiently analyze alerts and events observed on the network. With the ability to store vast amounts of data, the event timeline view can be a valuable resource for security teams to perform investigations and gain a deeper understanding of network activity.
Use the event timeline during investigations, to understand and analyze the chain of events that preceded and followed an attack or incident. The centralized view of multiple security-related events on the same timeline helps to identify patterns and correlations, and enable security teams to quickly assess the impact of incidents and respond accordingly.
For more information, see:
- View events on the timeline
- Audit user activity
- View and manage alerts
- Analyze programming details and changes
Permissions
Before you perform the procedures described in this article, make sure that you have access to an OT sensor as an Admin or Security Analyst role. For more information, see On-premises users and roles for OT monitoring with Defender for IoT.
View the event timeline
Sign in to the sensor console, and select Event Timeline from the left menu.
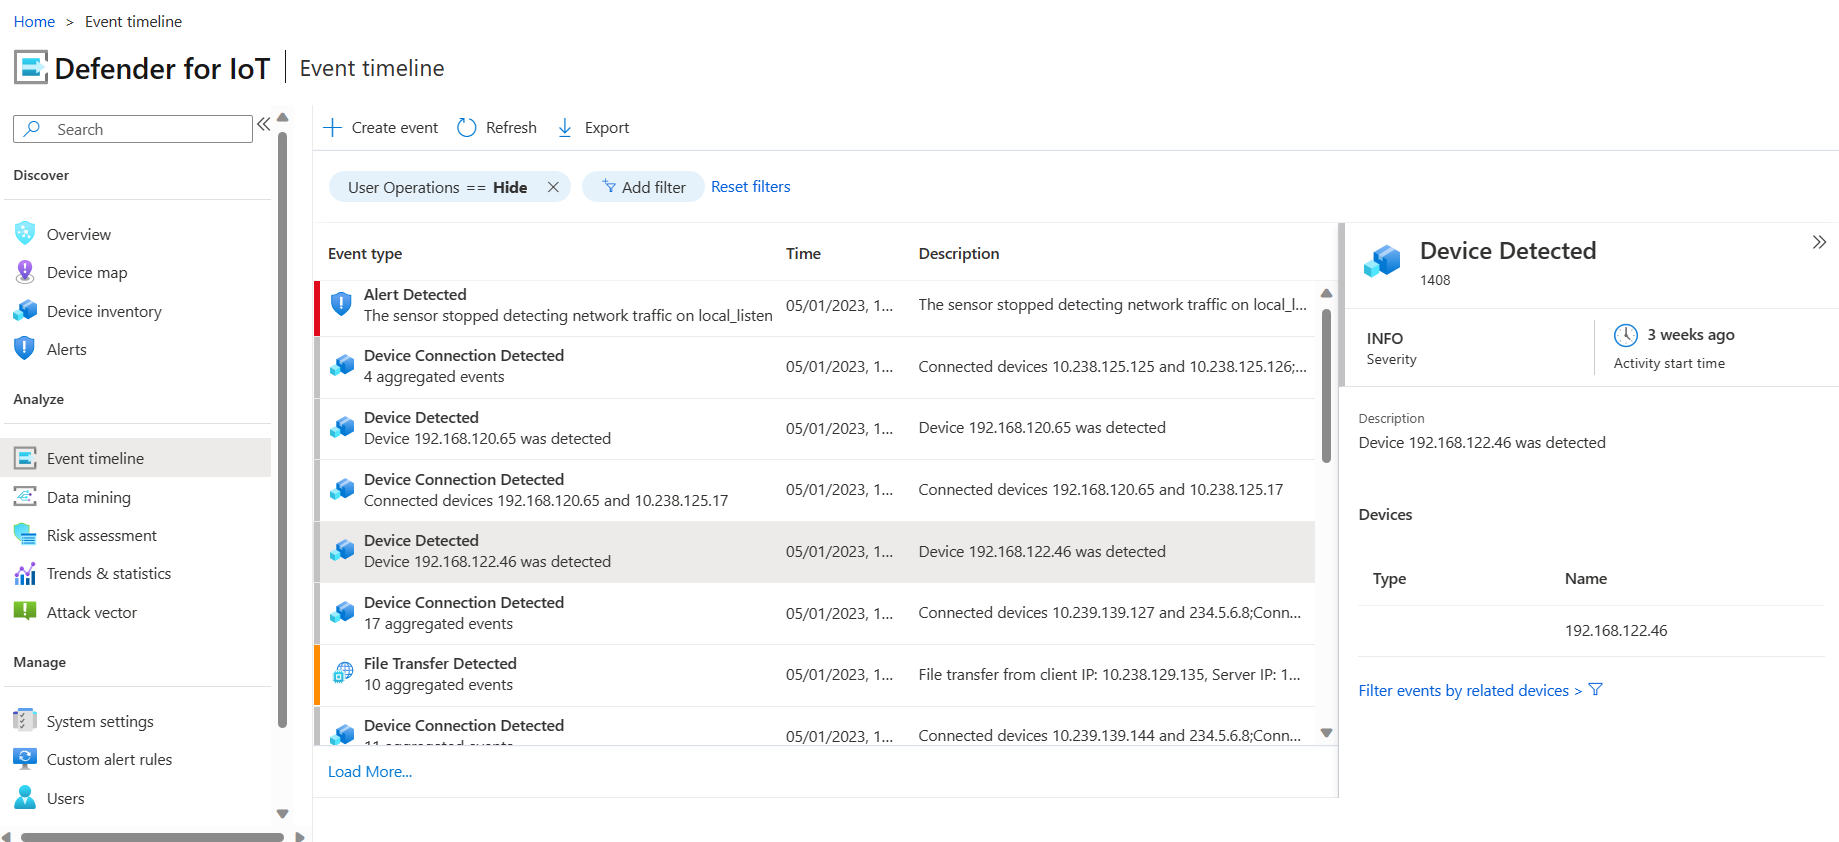
Review and filter the events as needed.
Select an event row to view the event details in a pane on the right, where you can also filter to view events of related devices. The User Operations filter is on by default, you can select to hide or show user events as needed.
For example:

You can also view the event timeline of a specific device from the Device inventory.
To view the event timeline of a specific device:
In the sensor console, go to Device inventory.
Select the specific device to open the device details pane, and then select View full details to open the device properties page.
Select the Event timeline tab to view all events associated with this device, and filter the events as needed.
For example:


Filter events on the timeline
On the event timeline page, select Add filter to specify the events shown.
Select the filter Type. Use any of the following options to filter the devices shown:
Type Description User operations This filter is on by default, choose to show or hide user operation events. Date Search for events in a specific date range. Device group Filter specific devices by group as defined in the device map. Event severity Show Alerts Only, Alerts and Notices, or All Events. Exclude devices Search for and filter devices you want to exclude. Include devices Search for and filter devices you want to include. Exclude Event Types Search for and filter specific event types to exclude. Include Event Types Search for and filter specific event types to include. Keywords Filter events by specific keywords. Select Apply to set the filter.
Export the event timeline to CSV
You can export the event timeline to a CSV file, the exported data is according to any filters applied when exporting.
To export the event timeline:
On the Event timeline page, select Export from the top menu to export the event timeline to a CSV file.
Create an event
In addition to viewing the events that the sensor has detected, you can manually add events to the timeline. This process is useful if an external system event impacts your network, and you want to record it on the timeline.
On the Event timeline page, select Create Event.
In the Create Event dialog, add the following event details:
Type. Specify the event type (Info, Notice, or Alert).
Timestamp. Set the date and time of the event.
Device. Select the device the event should be connected with.
Description. Provide a description of the event.
Select Save to add the event to the timeline.
For example:

Event timeline capacity
The amount of data that can be stored in the event timeline depends on various factors, such as the size of the network, the frequency of events, and the storage capacity of your sensor. The data stored in the event timeline can include information about network traffic, security events, and other relevant data points.
The maximum number of events shown in the event timeline is dependent on the hardware profile selected during sensor installation. Each hardware profile has a maximum capacity of events. For more information on the maximum event capacity for each hardware profile, see OT event timeline retention.
Next steps
For more information, see:
Feedback
Coming soon: Throughout 2024 we will be phasing out GitHub Issues as the feedback mechanism for content and replacing it with a new feedback system. For more information see: https://aka.ms/ContentUserFeedback.
Submit and view feedback for