Example query charts
Azure DevOps Services | Azure DevOps Server 2022 - Azure DevOps Server 2019
Query charts are a great way to visualize status and trends. Also, by adding several charts to a dashboard, you can quickly review all the important data you want to monitor for your team or project. With that in mind, consider addressing the following questions with your team:
- What are the most useful query charts for us to create and monitor?
- What charts help to maintain backlog hygiene?
- What time frame should we monitor when creating trend charts?
Not all teams have the same goals or tracking needs. However, teams that adopt Agile methods tend to routinely perform the following tasks. So consider the status and trend charts that can help your team perform these tasks.
- Triage incoming work, ensure new work is well defined
- Plan sprints and set sprint goals as described in Scrum and best practices
- Conduct daily stand-ups.
Prerequisites
- To create a query chart or view query charts from the Queries page, you must have Basic access or higher. Users with Stakeholder access can't view or create charts from the Queries page, however, they can view charts added to a team dashboard. For more information, see Stakeholder access quick reference.
- To add a query chart to a dashboard:
- You need to save the query under the Shared Queries folder. To do that, you must be granted permissions to save queries under a folder. To get permissions granted, see Set permissions on queries and query folders.
- You must have created the dashboard or be granted permissions to edit the dashboard. To learn more about dashboard permissions, see Set dashboard permissions.
- To view a query chart added to a dashboard, you must have Read permissions to the underlying query. If that permission is denied, then the widget displays a Widget failed to load message.
Note
Users with Stakeholder access for a public project have full access to query chart features just like users with Basic access. For more information, see Stakeholder access quick reference.
Tips for creating query charts
For details on creating query charts, see Track progress with status and trend query-based charts. Make sure your queries meet the following guidelines.
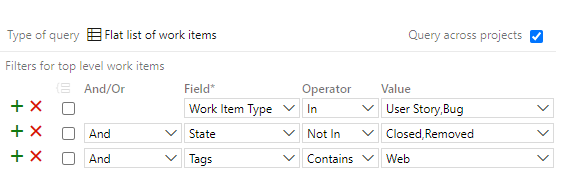
- Only choose Flat list of work items for the query type. Only flat-list queries support query charts.
- Always save a query after modifying the clauses or column options before switching to the Charts page.
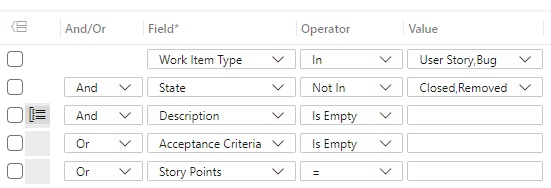
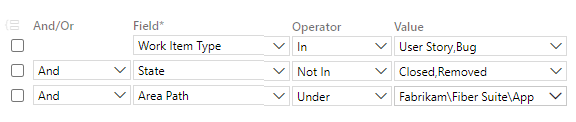
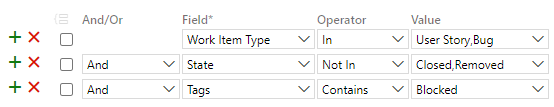
- Use the In and Not In operators to specify more than one work item type, workflow state, or other groupings of interest
- When creating a trend chart, make sure that your query returns no more than 1000 work items. You'll receive a widget error if that number is exceeded.
- Add the fields to either a query clause or the column options that you want to use within your chart. You can group charts by any field except date-time, free-form text, and tag fields. For example:
- To group by status, include the State field
- To group by work assignments, include the Assigned To field
- To group by sprints or iterations, include the Iteration Path
- To group by team, include the Node Name field that displays the leaf node of the Area Path
- To group by a custom field, include it.
- To sum a numeric column, include the corresponding field in your query clause or column options. For more examples of charts created from numeric fields, see Query by a numeric field.
- You can't group charts by the following field data types:
- Work item ID or Parent fields
- Date-time fields, such as Created Date, Changed Date
- Plain text fields, such as Title
- Rich-text fields, such as Description, Acceptance Criteria, Repro Steps
- Tags (You can filter a query using tags, however you can't use tags to configure your query chart).
Note
While you can't group a query-based chart by tags, you can group a Chart for Work Items widget by tags that you add to a dashboard as described in Configure a chart for work items widget.
- If you plan to add a query chart to a dashboard, first create the dashboard. Then, you can add it to the dashboard from the Queries>Charts page.
- If you add a query and then want to add it to a dashboard from the dashboard, you must first refresh your browser for the dashboard to register the newly added query.
- To optimize performance of complex queries, see Best integration practices, Optimize queries.
Maintain backlog hygiene
The following queries can help your team maintain a healthy backlog by ensuring that work is assigned. The following table provides some example queries to review periodically, usually at the beginning or end of a sprint. Review this list for what makes sense for your team and organization goals. Substitute the Fabrikam Team for your team and add other filters as needed.
Note
Work item types and workflow states applicable to your project may differ from those shown in the following examples depending on the process used by your project.
Query focus
Query clauses
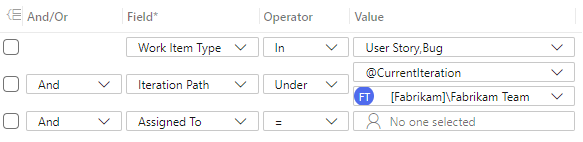
Unassigned work: Work assigned to the current sprint but not assigned to a team member
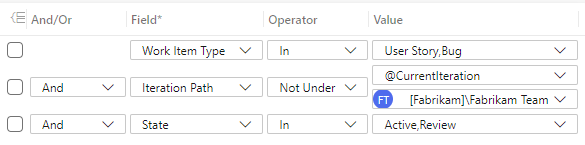
Active work not assigned to the current sprint
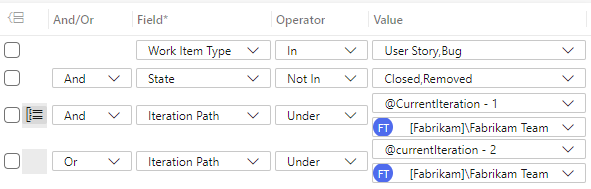
Active work assigned to a past sprint
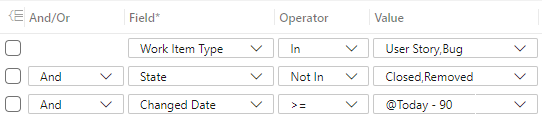
Stale work: Work items with no changes made in the last two to three months (query by Changed Date)
Ill-defined work: For example, ones with no Description, Acceptance Criteria, Story Points, or Effort defined
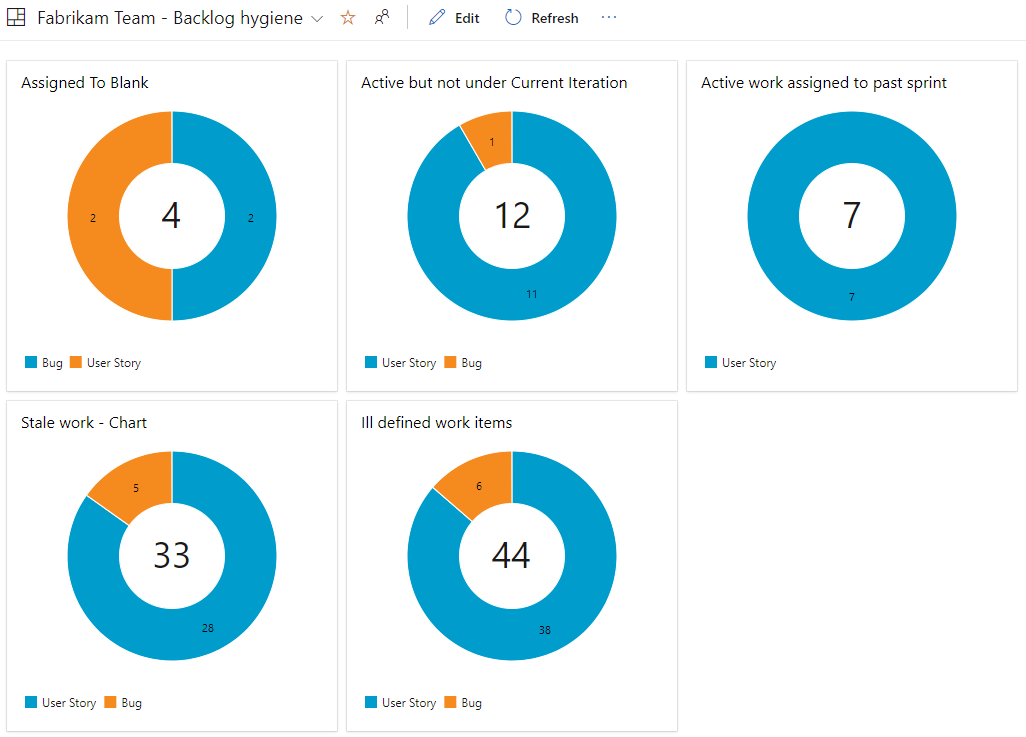
In the following image, all five query charts appear on a team dashboard. To add query charts to a dashboard, see Add charts to a dashboard
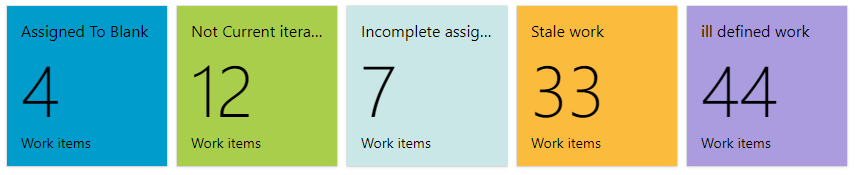
Alternatively, you can add query tiles that reference the same query and show the total count of work items as shown in the following image.
Note
The query tile widget is a 1x1 tile, whereas the smallest query chart dashboard widget is 2x2. To add query tiles to a dashboard, see Add widgets to a dashboard.
Example status charts
The following table provides some examples of status charts you can create and the queries behind them.
Query focus
Query clauses
Planned work: How much work is represented in the backlog. A query that looks at work in the New or Proposed category state provides a snapshot of work in the backlog.
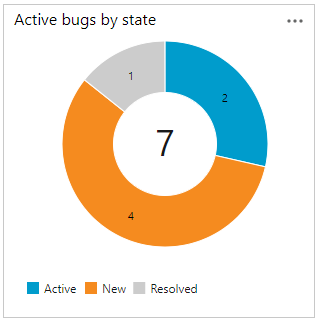
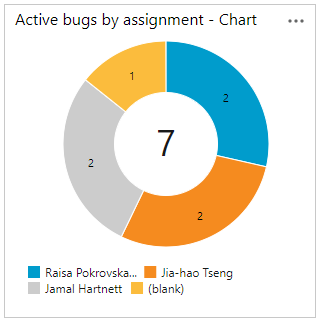
Active bugs: Agile teams monitor their bug or technical debt and set goals to maintain the total number under a specific number.
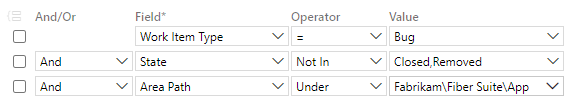
From this one query, you can create a chart based on assignment or state.
Tagged work items: Monitor tagged work to ensure the team is meeting specific goals, milestones, or categories of work.
Blocked work: How much work is currently blocked? You can query blocked work using a tag or custom field.
Example trend charts
The following table provides some examples of trend charts you can create.
Query focus
Query clauses and chart
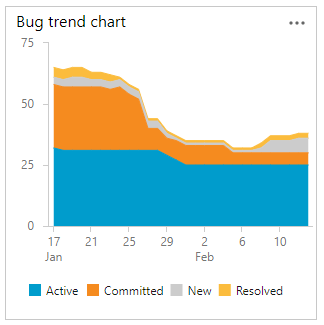
Bug trends over time by state (last 30 days)
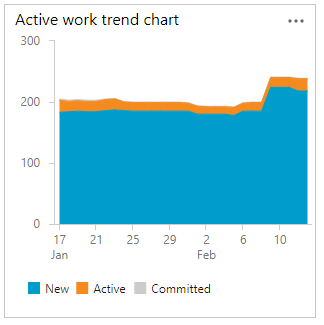
Active work trends by state (last 30 days)
Useful work tracking widgets and charts
In addition to the query charts provided earlier in this article, the following built-in widgets provide a wealth of information for teams working to monitor progress and continuous improvement goals. Each of these charts can be added to a team dashboard.
Related articles
Feedback
Coming soon: Throughout 2024 we will be phasing out GitHub Issues as the feedback mechanism for content and replacing it with a new feedback system. For more information see: https://aka.ms/ContentUserFeedback.
Submit and view feedback for