Note
Access to this page requires authorization. You can try signing in or changing directories.
Access to this page requires authorization. You can try changing directories.
The Microsoft Quantum Development Kit (QDK) offers several quantum simulators and a visualizer for neutral atom quantum computers. The neutral atom device visualizer produces an interactive diagram that lets you track how qubits move and get processed when your program runs on a basic neutral atom device. This article explains how to access and use the visualizer in Jupyter Notebook.
For instructions on how to install the simulators and visualizer, see How to install and run the QDK quantum simulators.
How to create a neutral atom qubit diagram
To create a qubit diagram with the neutral atom visualizer, follow these steps:
In VS Code, open the View menu and choose Command Palette.
Enter and select Create: New Jupyter Notebook. A new tab opens with an empty Jupyter Notebook file.
Import the necessary packages and objects. In the first cell, enter and run the following code:
from qdk.openqasm import compile
from qdk.simulation import NeutralAtomDevice
Write your OpenQASM circuit and compile the circuit into QIR. For example, the following circuit entangles two qubits:
qasm_src = """
include "stdgates.inc";
qubit[2] qs;
bit[2] r;

h qs[0];
cx qs[0], qs[1];
r = measure qs;
"""

qir = compile(qasm_src)
Create a simulator object using
NeutralAtomDevice.simulator = NeutralAtomDevice()To access the visualizer, call the
show_tracemethod and pass the QIR for your program.simulator.show_trace(qir)The visualizer renders in the output cell.
Note
The visualizer doesn't include qubit loss or other noise.
How to interact with the visualizer
The visualizer has interactive elements that let you explore a simulation of how qubits behave as your program runs on a basic neutral atom quantum computer. The device diagram is a 2D grid with labeled rows and columns. Each dot in a grid position represents one neutral atom qubit on the device.
The diagram contains three zones:
| Zone | Description |
|---|---|
| Storage zone | This zone is labeled Register 1. The qubits start in the storage zone and stay there until they're ready for processing or measurement. Qubits always move back to the storage zone after operations and measurements. |
| Interaction zone | This zone is where quantum gates are applied to the qubits for processing. |
| Measurement zone | This zone is where the qubits are measured. |
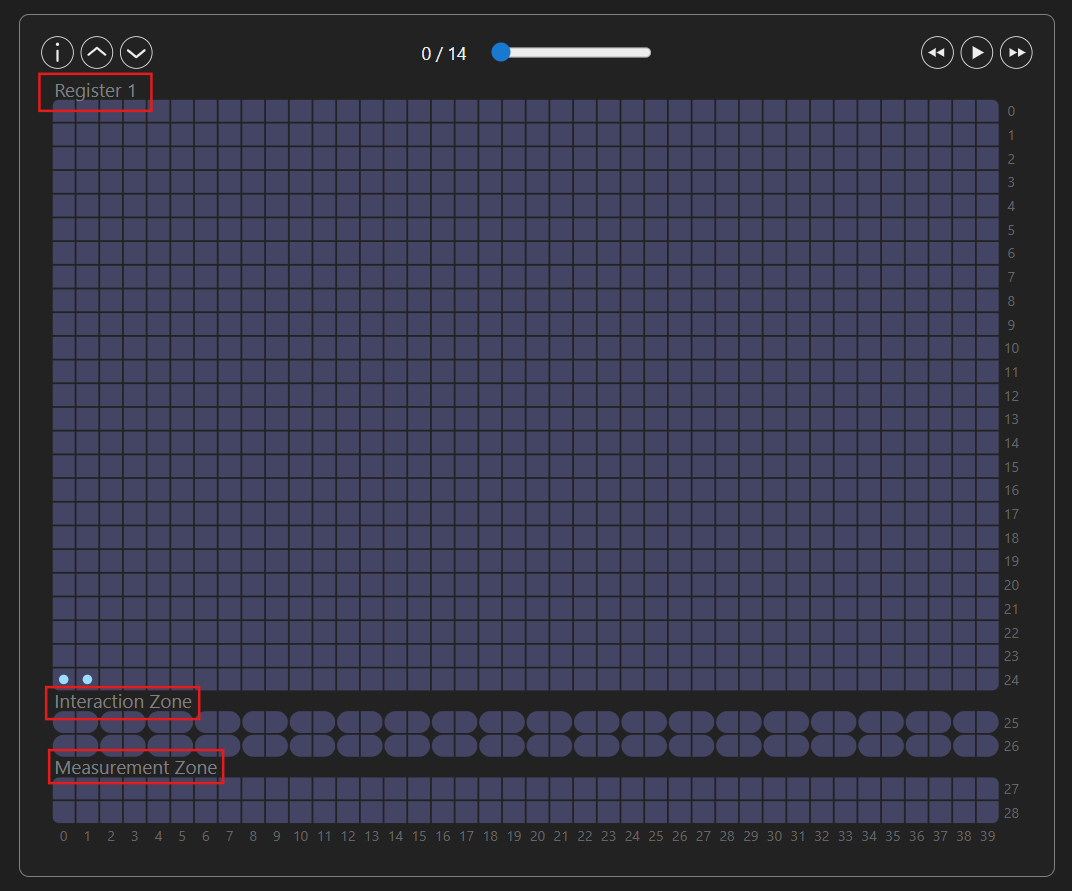
Interactive elements in the visualizer
To interact with the visualizer, use the elements at the top of the diagram. The diagram contains the following elements:
- Play button: Select this button to play an animation of your program run. The animation goes through each step of the program until the program ends. During the animation, select this button again to pause the animation on the current step. When the animation ends, select this button again to start the animation from the beginning.
- Forward and backward buttons: Select these buttons to go through the program one step at a time without playing the full animation.
- Progress slider: This element shows the current step of the program. Move the slider to go through the program and choose a specific step. At each step, hover over a qubit to see where the qubit moved from in the previous step.
- Resize buttons: Select the up arrow button to increase the size of the diagram, and select the down arrow button to decrease the size of the diagram.
- Information icon: Hover over this icon to view a list of keyboard shortcuts that let you interact with the diagram. The keyboard shortcut F speeds up the animation and S slows down the animation when you select the Play button.
