Tutorial: Automatically check and record IP address reputation information in incidents
One quick and easy way to assess the severity of an incident is to see if any IP addresses in it are known to be sources of malicious activity. Having a way to do this automatically can save you a lot of time and effort.
In this tutorial, you'll learn how to use Microsoft Sentinel automation rules and playbooks to automatically check IP addresses in your incidents against a threat intelligence source and record each result in its relevant incident.
When you complete this tutorial, you'll be able to:
- Create a playbook from a template
- Configure and authorize the playbook's connections to other resources
- Create an automation rule to invoke the playbook
- See the results of your automated process
Important
Microsoft Sentinel is available as part of the public preview for the unified security operations platform in the Microsoft Defender portal. For more information, see Microsoft Sentinel in the Microsoft Defender portal.
Prerequisites
To complete this tutorial, make sure you have:
An Azure subscription. Create a free account if you don't already have one.
A Log Analytics workspace with the Microsoft Sentinel solution deployed on it and data being ingested into it.
An Azure user with the following roles assigned on the following resources:
- Microsoft Sentinel Contributor on the Log Analytics workspace where Microsoft Sentinel is deployed.
- Logic App Contributor, and Owner or equivalent, on whichever resource group will contain the playbook created in this tutorial.
A (free) VirusTotal account will suffice for this tutorial. A production implementation requires a VirusTotal Premium account.
Create a playbook from a template
Microsoft Sentinel includes ready-made, out-of-the-box playbook templates that you can customize and use to automate a large number of basic SecOps objectives and scenarios. Let's find one to enrich the IP address information in our incidents.
For Microsoft Sentinel in the Azure portal, select the Configuration > Automation page. For Microsoft Sentinel in the Defender portal, select Microsoft Sentinel > Configuration > Automation.
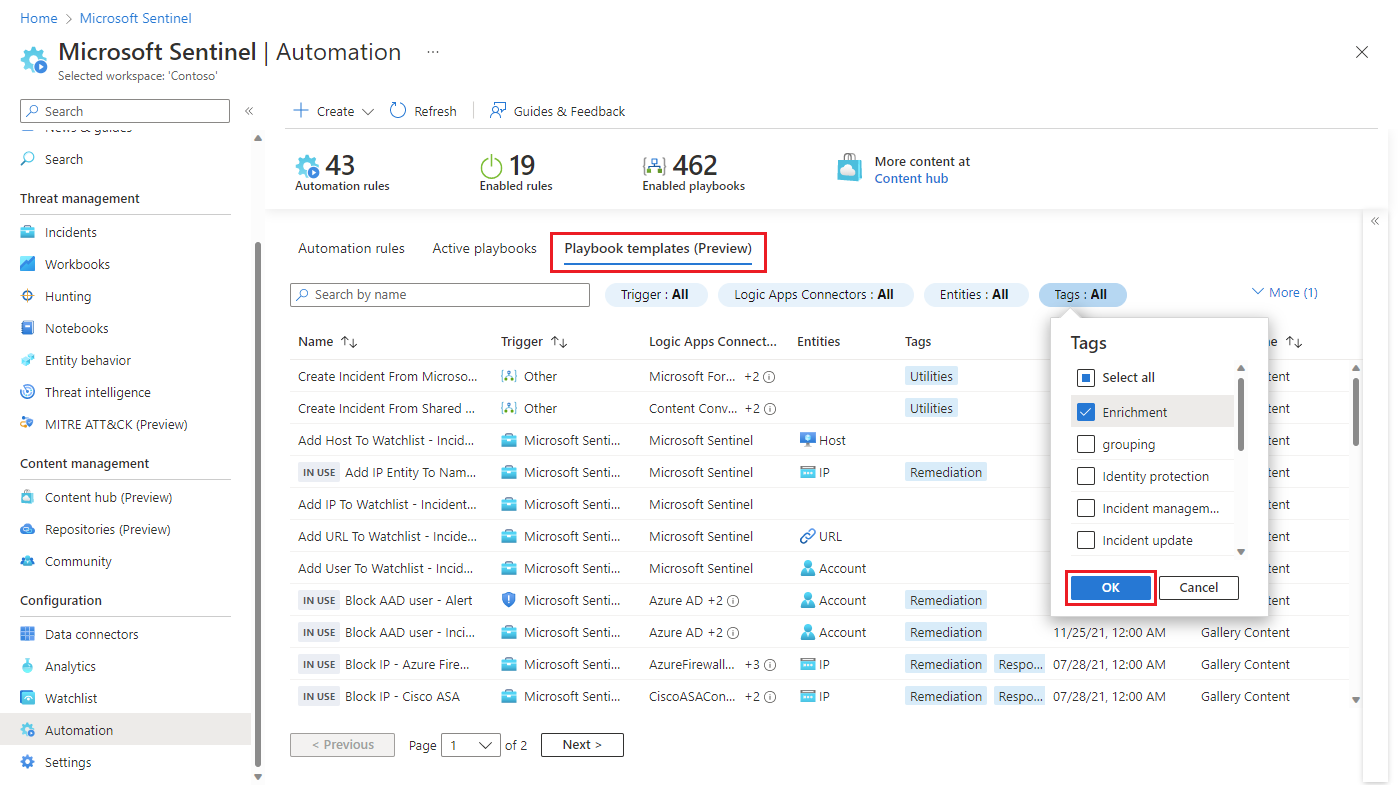
From the Automation page, select the Playbook templates (Preview) tab.
Filter the list of templates by tag:
Select the Tags filter toggle at the top of the list (to the right of the Search field).
Clear the Select all checkbox, then mark the Enrichment checkbox. Select OK.
For example:
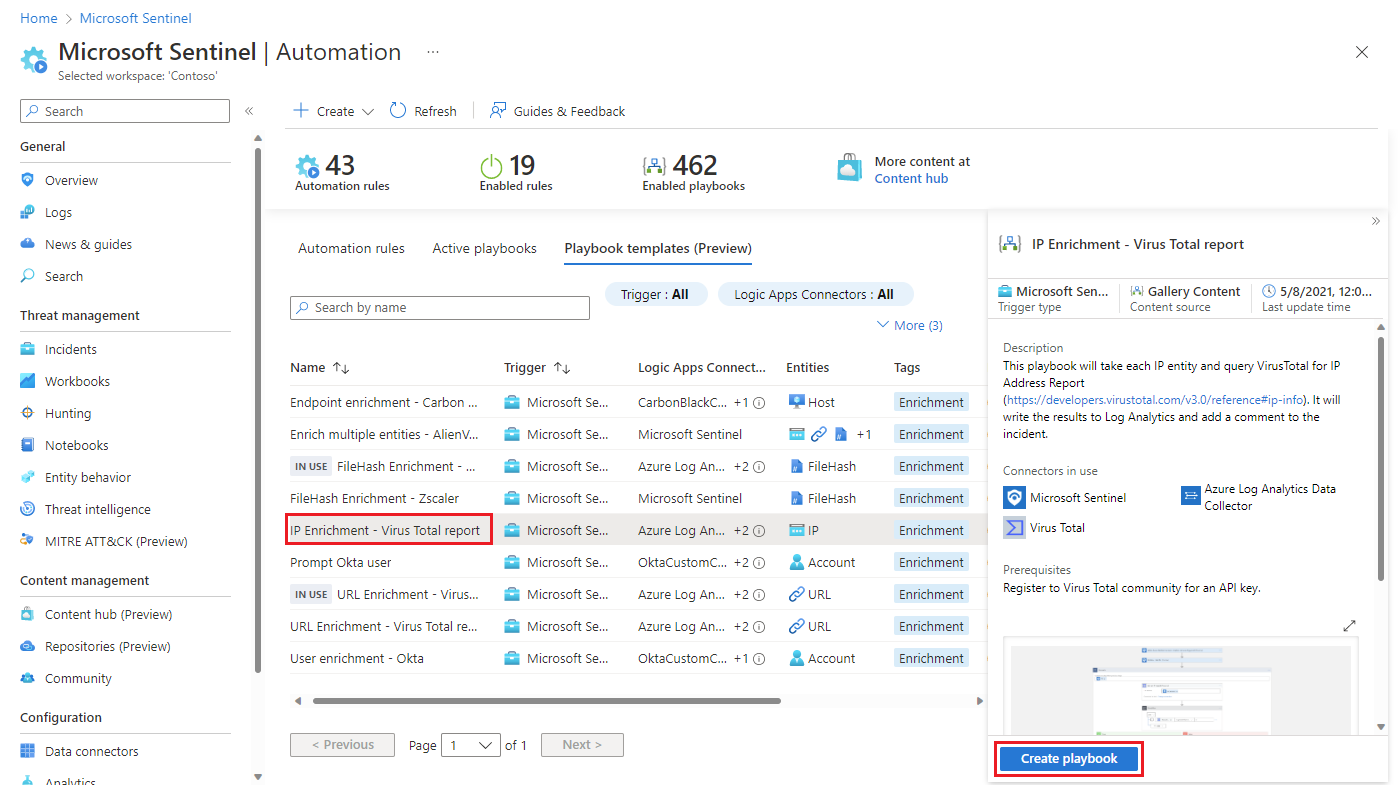
Select the IP Enrichment - Virus Total report template, and select Create playbook from the details pane.
The Create playbook wizard will open. In the Basics tab:
Select your Subscription, Resource group, and Region from their respective drop-down lists.
Edit the Playbook name by adding to the end of the suggested name "Get-VirusTotalIPReport". (This way you'll be able to tell which original template this playbook came from, while still ensuring that it has a unique name in case you want to create another playbook from this same template.) Let's call it "Get-VirusTotalIPReport-Tutorial-1".
Let's leave the last two checkboxes unmarked as they are, as we don't need these services in this case:
- Enable diagnostics logs in Log Analytics
- Associate with integration service environment
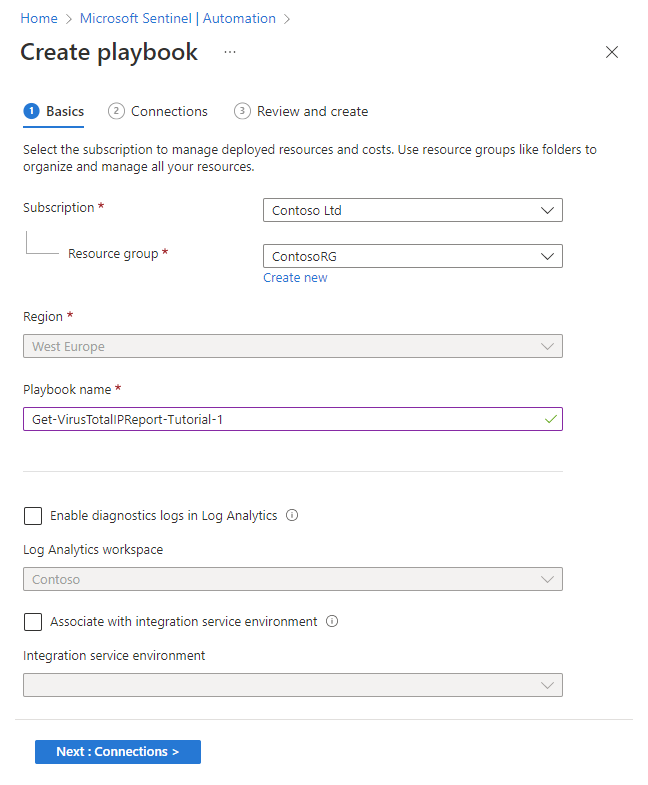
Select Next : Connections >.
In the Connections tab, you'll see all the connections that this playbook needs to make to other services, and the authentication method that will be used if the connection has already been made in an existing Logic App workflow in the same resource group.
Leave the Microsoft Sentinel connection as is (it should say "Connect with managed identity").
If any connections say "New connection will be configured," you will be prompted to do so at the next stage of the tutorial. Or, if you already have connections to these resources, select the expander arrow to the left of the connection and choose an existing connection from the expanded list. For this exercise, we'll leave it as is.
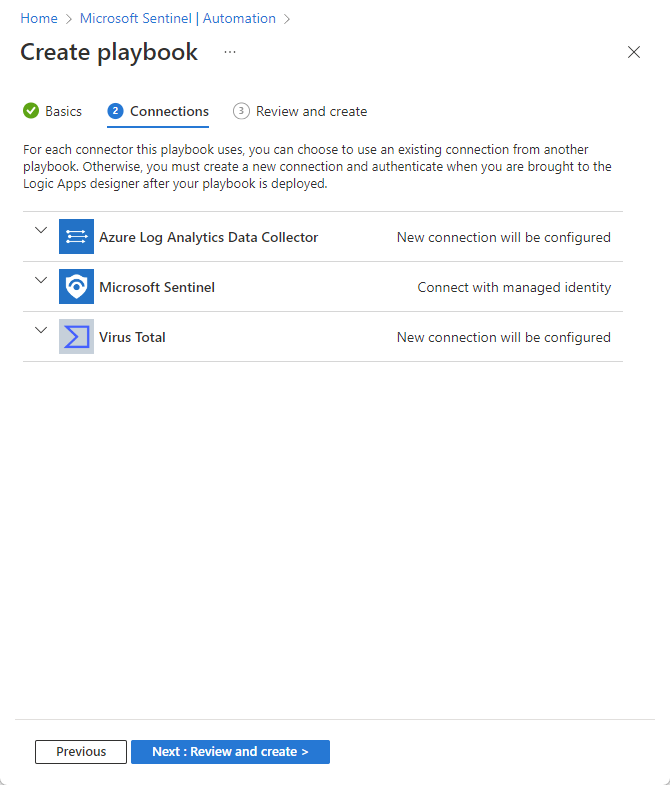
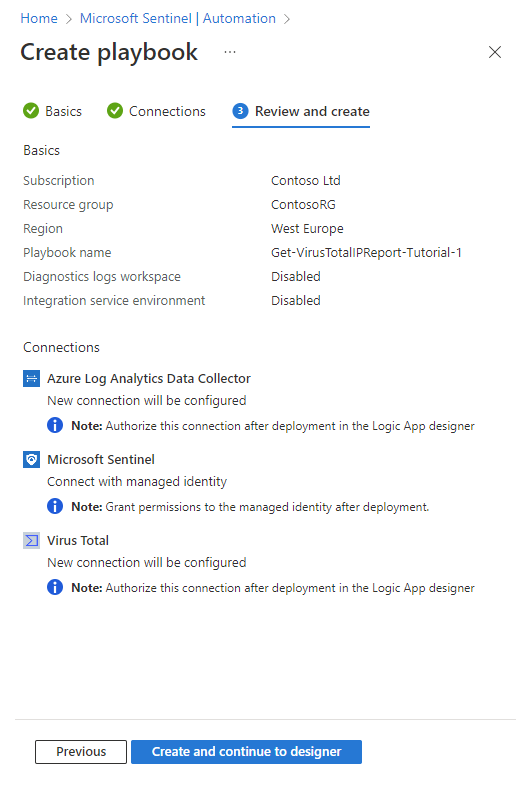
Select Next : Review and create >.
In the Review and create tab, review all the information you've entered as it's displayed here, and select Create and continue to designer.
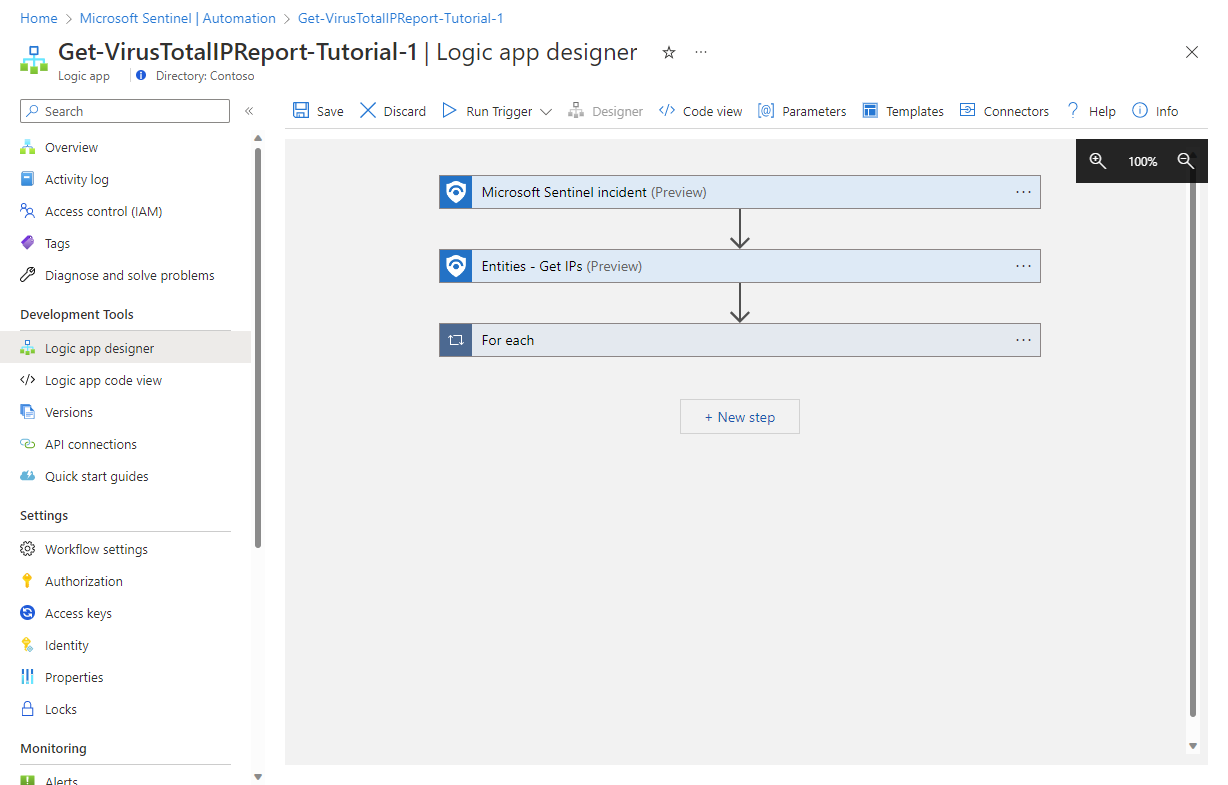
As the playbook is deployed, you'll see a quick series of notifications of its progress. Then the Logic app designer will open with your playbook displayed. We still need to authorize the logic app's connections to the resources it interacts with so that the playbook can run. Then we'll review each of the actions in the playbook to make sure they're suitable for our environment, making changes if necessary.


Authorize logic app connections
Recall that when we created the playbook from the template, we were told that the Azure Log Analytics Data Collector and Virus Total connections would be configured later.
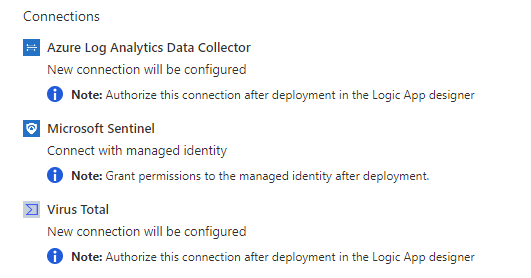
Here's where we do that.
Authorize Virus Total connection
Select the For each action to expand it and review its contents (the actions that will be performed for each IP address).
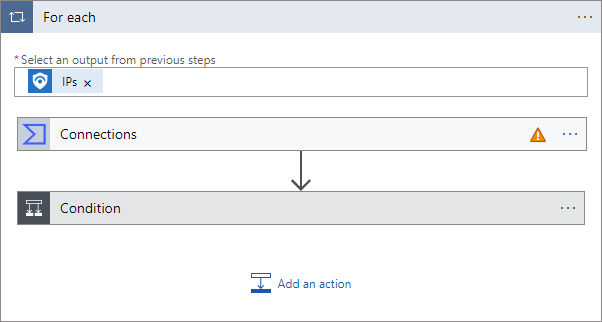
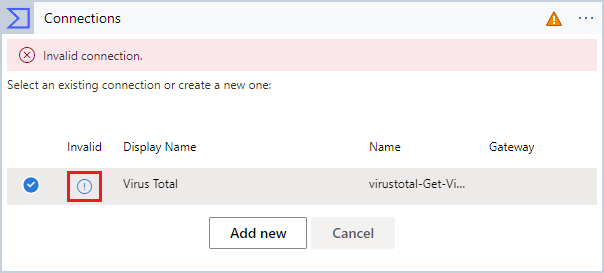
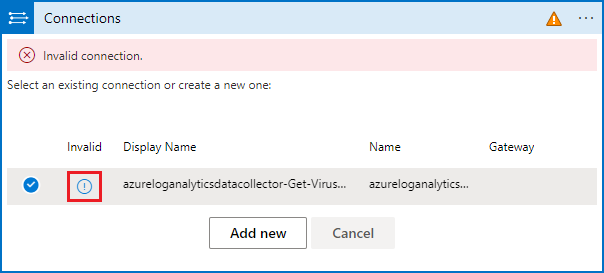
The first action item you see is labeled Connections and has an orange warning triangle.
(If instead, that first action is labeled Get an IP report (Preview), that means you already have an existing connection to Virus Total and you can go to the next step.)
Select the Connections action to open it.
Select the icon in the Invalid column for the displayed connection.
You'll be prompted for connection information.
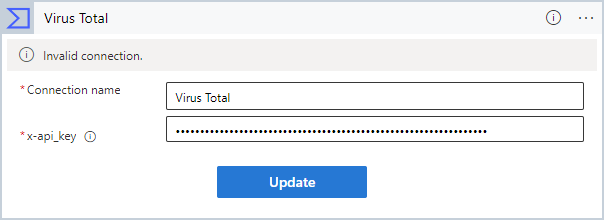
Enter "Virus Total" as the Connection name.
For x-api_key, copy and paste the API key from your Virus Total account.
Select Update.
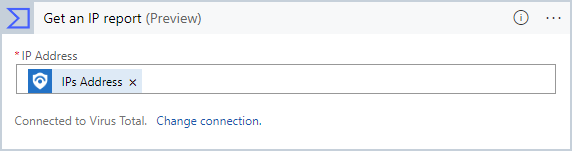
Now you'll see the Get an IP report (Preview) action properly. (If you already had a Virus Total account, you'll already be at this stage.)
Authorize Log Analytics connection
The next action is a Condition that determines the rest of the for-each loop's actions based on the outcome of the IP address report. It analyzes the Reputation score given to the IP address in the report. A score higher than 0 indicates the address is harmless; a score lower than 0 indicates it's malicious.
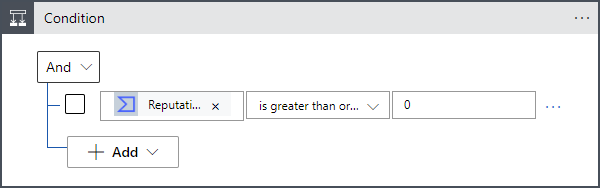
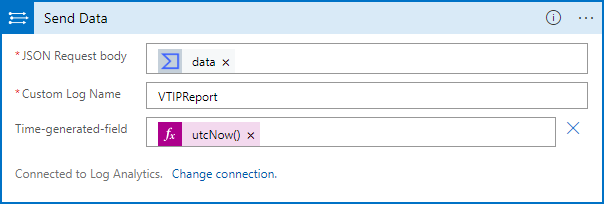
Whether the condition is true or false, we want to send the data in the report to a table in Log Analytics so it can be queried and analyzed, and add a comment to the incident.
But as you'll see, we have more invalid connections we need to authorize.

Select the Connections action in the True frame.
Select the icon in the Invalid column for the displayed connection.
You'll be prompted for connection information.
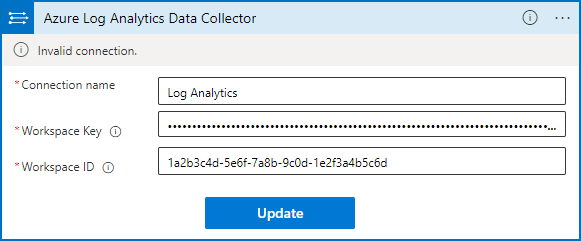
Enter "Log Analytics" as the Connection name.
For Workspace Key and Workspace ID, copy and paste the key and ID from your Log Analytics workspace settings. They can be found in the Agents management page, inside the Log Analytics agent instructions expander.
Select Update.
Now you'll see the Send data action properly. (If you already had a Log Analytics connection from Logic Apps, you'll already be at this stage.)
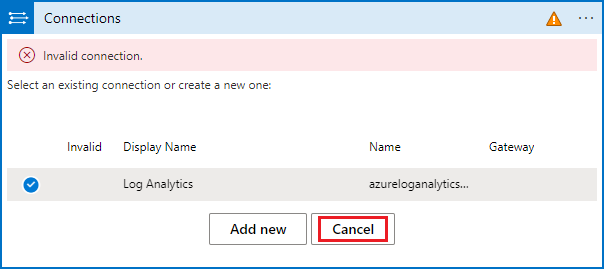
Now select the Connections action in the False frame. This action uses the same connection as the one in the True frame.
Verify the connection called Log Analytics is marked, and select Cancel. This ensures that the action will now be displayed properly in the playbook.
Now you'll see your entire playbook, properly configured.
Very important! Don't forget to select Save at the top of the Logic app designer window. After you see notification messages that your playbook was saved successfully, you'll see your playbook listed in the Active playbooks* tab in the Automation page.
Create an automation rule
Now, to actually run this playbook, you'll need to create an automation rule that will run when incidents are created and invoke the playbook.
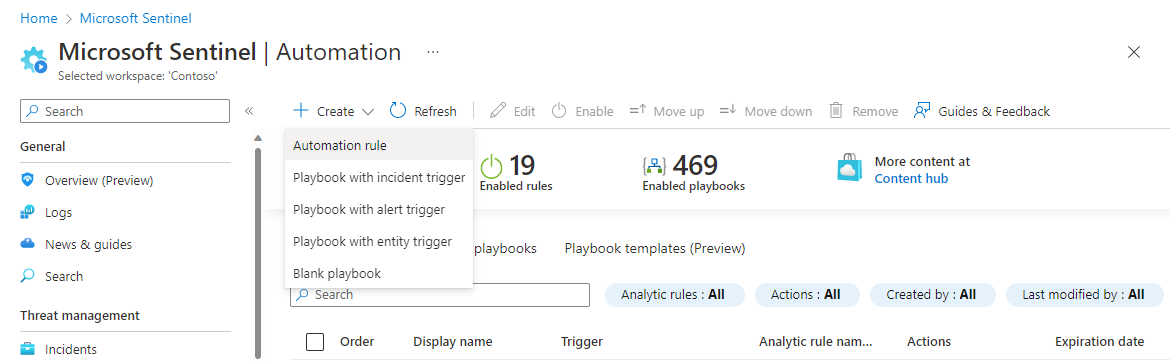
From the Automation page, select + Create from the top banner. From the drop-down menu, select Automation rule.
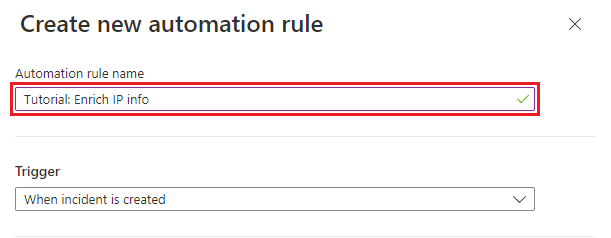
In the Create new automation rule panel, name the rule "Tutorial: Enrich IP info".
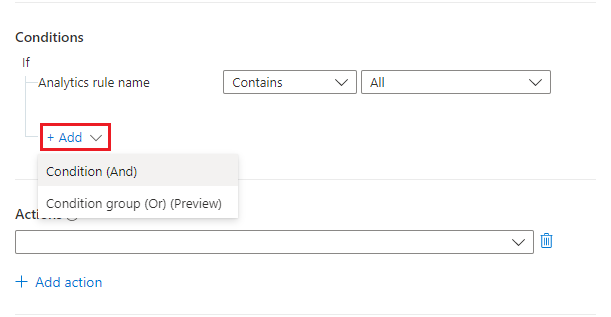
Under Conditions, select + Add and Condition (And).
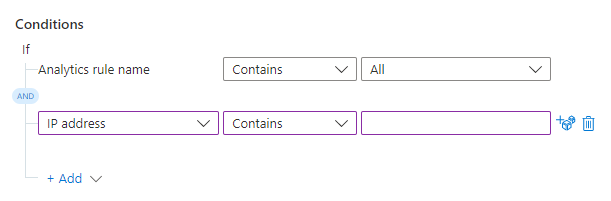
Select IP Address from the property drop-down on the left. Select Contains from the operator drop-down, and leave the value field blank. This effectively means that the rule will apply to incidents that have an IP address field that contains anything.
We don't want to stop any analytics rules from being covered by this automation, but we don't want the automation to be triggered unnecessarily either, so we're going to limit the coverage to incidents that contain IP address entities.
Under Actions, select Run playbook from the drop-down.
Select the new drop-down that appears.
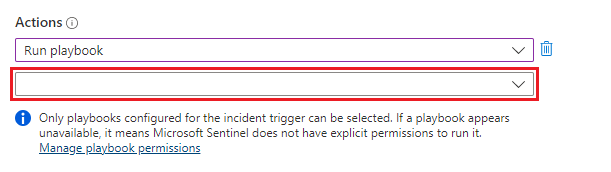
You'll see a list of all the playbooks in your subscription. The grayed-out ones are those you don't have access to. In the Search playbooks text box, begin typing the name - or any part of the name - of the playbook we created above. The list of playbooks will be dynamically filtered with each letter you type.
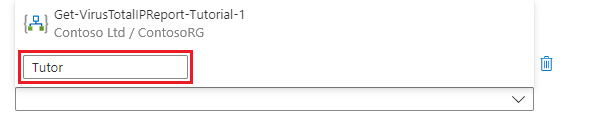
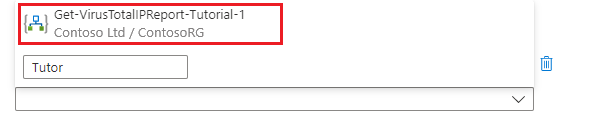
When you see your playbook in the list, select it.
If the playbook is grayed out, select the Manage playbook permissions link (in the fine-print paragraph below where you selected a playbook - see the screenshot above). In the panel that opens up, select the resource group containing the playbook from the list of available resource groups, then select Apply.
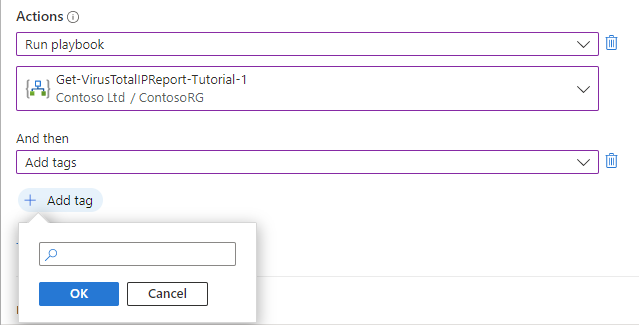
Select + Add action again. Now, from the new action drop-down that appears, select Add tags.
Select + Add tag. Enter "Tutorial-Enriched IP addresses" as the tag text and select OK.
Leave the remaining settings as they are, and select Apply.
Verify successful automation
In the Incidents page, enter the tag text Tutorial-Enriched IP addresses into the Search bar and hit the Enter key to filter the list for incidents with that tag applied. These are the incidents that our automation rule ran on.
Open any one or more of these incidents and see if there are comments about the IP addresses there. The presence of these comments indicates that the playbook ran on the incident.
Clean up resources
If you're not going to continue to use this automation scenario, delete the playbook and automation rule you created with the following steps:
In the Automation page, select the Active playbooks tab.
Enter the name (or part of the name) of the playbook you created in the Search bar.
(If it doesn't show up, make sure any filters are set to Select all.)Mark the check box next to your playbook in the list, and select Delete from the top banner.
(If you don't want to delete it, you can select Disable instead.)Select the Automation rules tab.
Enter the name (or part of the name) of the automation rule you created in the Search bar.
(If it doesn't show up, make sure any filters are set to Select all.)Mark the check box next to your automation rule in the list, and select Delete from the top banner.
(If you don't want to delete it, you can select Disable instead.)
Next steps
Now that you've learned how to automate a basic incident enrichment scenario, learn more about automation and other scenarios you can use it in.
- See more examples of using playbooks together with automation rules.
- Take a deeper dive into adding actions to playbooks.
- Explore some basic automation scenarios that don't require playbooks.
Feedback
Coming soon: Throughout 2024 we will be phasing out GitHub Issues as the feedback mechanism for content and replacing it with a new feedback system. For more information see: https://aka.ms/ContentUserFeedback.
Submit and view feedback for