Tutorial: Detect threats by using analytics rules in Microsoft Sentinel
As a Security Information and Event Management (SIEM) service, Microsoft Sentinel is responsible for detecting security threats to your organization. It does this by analyzing the massive volumes of data generated by all of your systems' logs.
In this tutorial, you'll learn how to set up a Microsoft Sentinel analytics rule from a template to search for exploits of the Apache Log4j vulnerability across your environment. The rule will frame user accounts and IP addresses found in your logs as trackable entities, surface notable pieces of information in the alerts generated by the rules, and package alerts as incidents to be investigated.
When you complete this tutorial, you'll be able to:
- Create an analytics rule from a template
- Customize a rule's query and settings
- Configure the three types of alert enrichment
- Choose automated threat responses for your rules
Prerequisites
To complete this tutorial, make sure you have:
An Azure subscription. Create a free account if you don't already have one.
A Log Analytics workspace with the Microsoft Sentinel solution deployed on it and data being ingested into it.
An Azure user with the Microsoft Sentinel Contributor role assigned on the Log Analytics workspace where Microsoft Sentinel is deployed.
The following data sources are referenced in this rule. The more of these you have deployed connectors for, the more effective the rule will be. You must have at least one.
Data source Log Analytics tables referenced Office 365 OfficeActivity (SharePoint)
OfficeActivity (Exchange)
OfficeActivity (Teams)DNS DnsEvents Azure Monitor (VM Insights) VMConnection Cisco ASA CommonSecurityLog (Cisco) Palo Alto Networks (Firewall) CommonSecurityLog (PaloAlto) Security Events SecurityEvents Microsoft Entra ID SigninLogs
AADNonInteractiveUserSignInLogsAzure Monitor (WireData) WireData Azure Monitor (IIS) W3CIISLog Azure Activity AzureActivity Amazon Web Services AWSCloudTrail Microsoft Defender XDR DeviceNetworkEvents Azure Firewall AzureDiagnostics (Azure Firewall)
Sign in to the Azure portal and Microsoft Sentinel
Sign in to the Azure portal.
From the Search bar, search for and select Microsoft Sentinel.
Search for and select your workspace from the list of available Microsoft Sentinel workspaces.
Install a solution from the content hub
In Microsoft Sentinel, on the left-hand side menu under Content management, select Content hub.
Search for and select the solution Log4j Vulnerability Detection.
From the toolbar at the top of the page, select
 Install/Update.
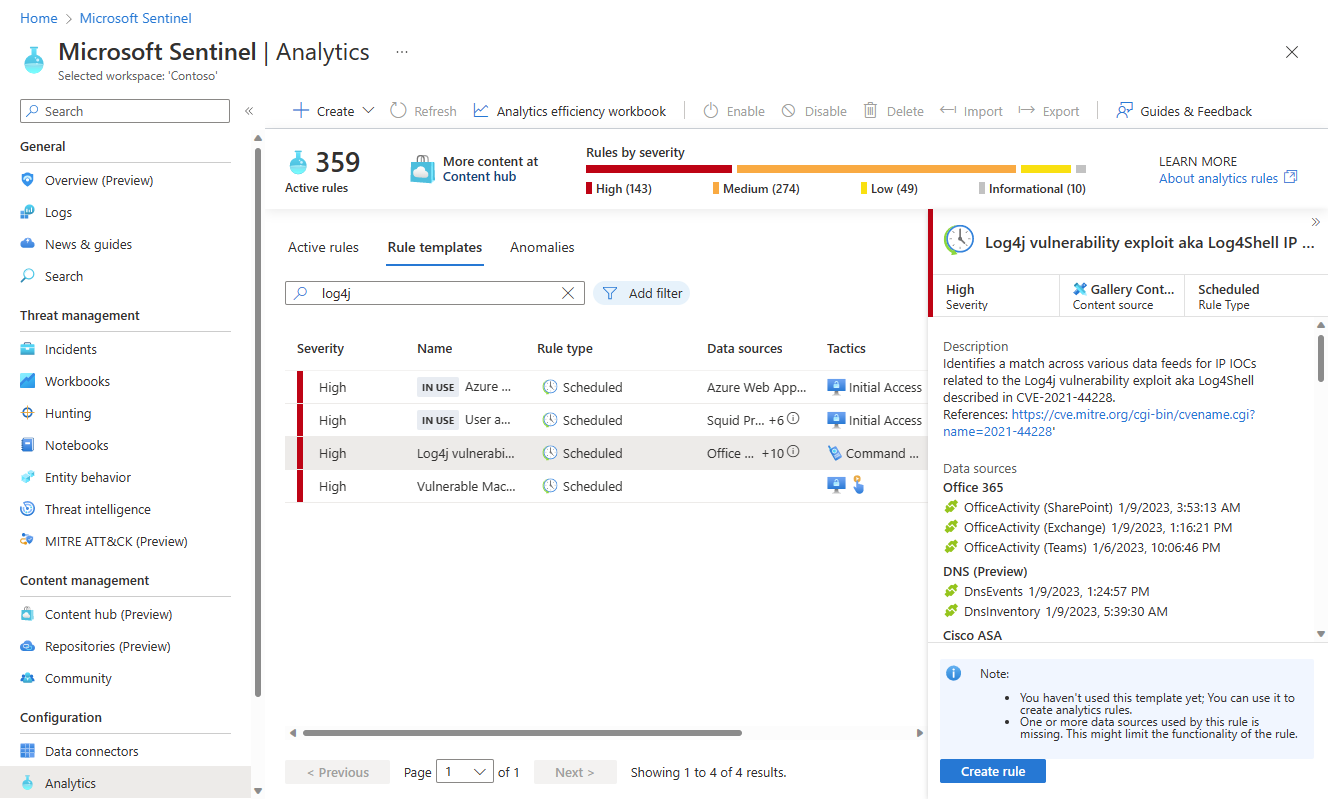
Create a scheduled analytics rule from a template
In Microsoft Sentinel, on the left-hand side menu under Configuration, select Analytics.
From the Analytics page, select the Rule templates tab.
In the search field at the top of the list of rule templates, enter log4j.
From the filtered list of templates, select Log4j vulnerability exploit aka Log4Shell IP IOC. From the details pane, select Create rule.
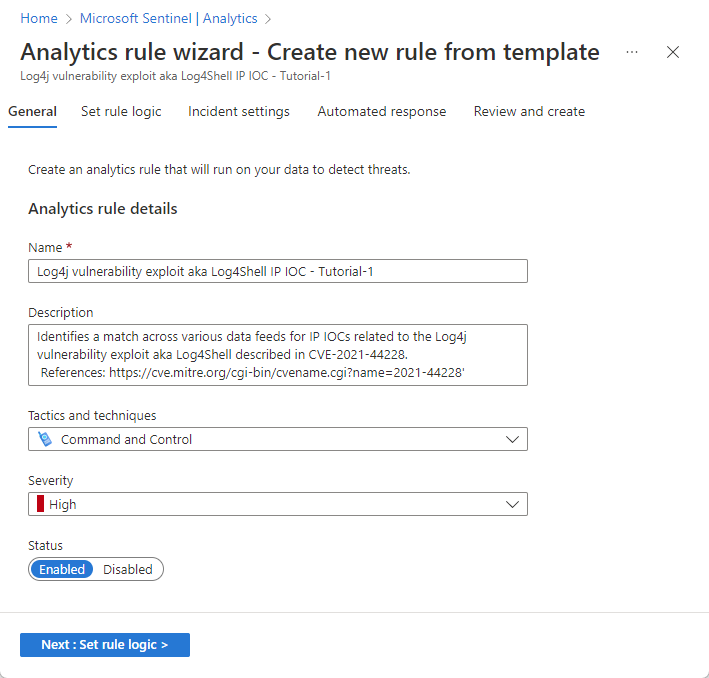
The Analytics rule wizard will open.
In the General tab, in the Name field, enter Log4j vulnerability exploit aka Log4Shell IP IOC - Tutorial-1.
Leave the rest of the fields on this page as they are. These are the defaults, but we will add customization to the alert name at a later stage.
If you don’t want the rule to run immediately, select Disabled, and the rule will be added to your Active rules tab and you can enable it from there when you need it.
Select Next : Set rule logic.

Review rule query logic and configuration of settings
In the Set rule logic tab, review the query as it appears under the Rule query heading.
To see more of the query text at one time, select the diagonal double-arrow icon at the upper right corner of the query window to expand the window to a larger size.


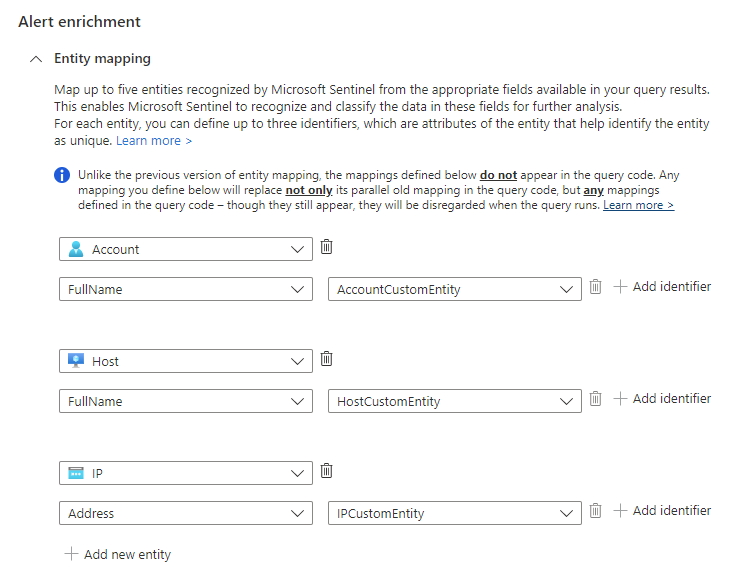
Enrich alerts with entities and other details
Under Alert enrichment, keep the Entity mapping settings as they are. Note the three mapped entities.
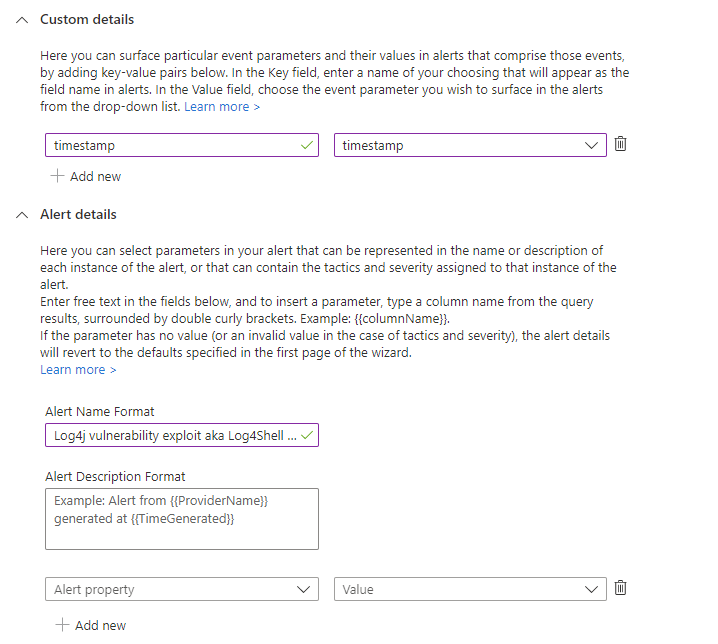
In the Custom details section, let's add the timestamp of each occurrence to the alert, so you can see it right in the alert details, without having to drill down.
- Type timestamp in the Key field. This will be the property name in the alert.
- Select timestamp from the Value drop-down list.
In the Alert details section, let's customize the alert name so that the timestamp of each occurrence appears in the alert title.
In the Alert name format field, enter Log4j vulnerability exploit aka Log4Shell IP IOC at {{timestamp}}.
Review remaining settings
Review the remaining settings on the Set rule logic tab. There's no need to change anything, though you can if you'd like to change the interval, for example. Just make sure that the lookback period matches the interval in order to maintain continuous coverage.
Query scheduling:
- Run query every 1 hour.
- Lookup data from the last 1 hour.
Alert threshold:
- Generate alert when number of query results is greater than 0.
Event grouping:
- Configure how rule query results are grouped into alerts: Group all events into a single alert.
Suppression:
- Stop running query after alert is generated: Off.
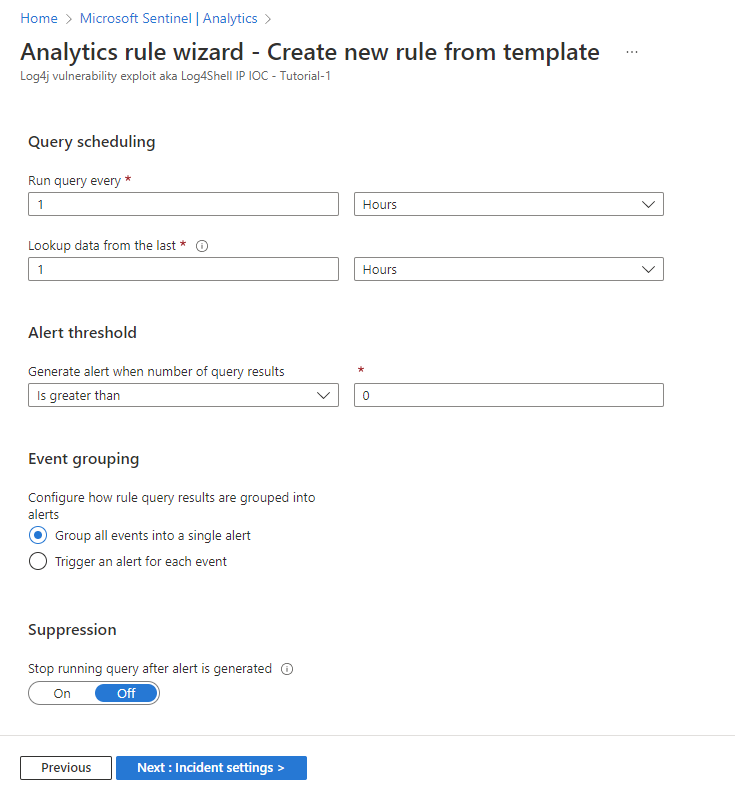
Select Next : Incident settings.
Review the incident creation settings
Review the settings on the Incident settings tab. There's no need to change anything, unless, for example, you have a different system for incident creation and management, in which case you'd want to disable incident creation.
Incident settings:
- Create incidents from alerts triggered by this analytics rule: Enabled.
Alert grouping:
- Group related alerts, triggered by this analytics rule, into incidents: Disabled.
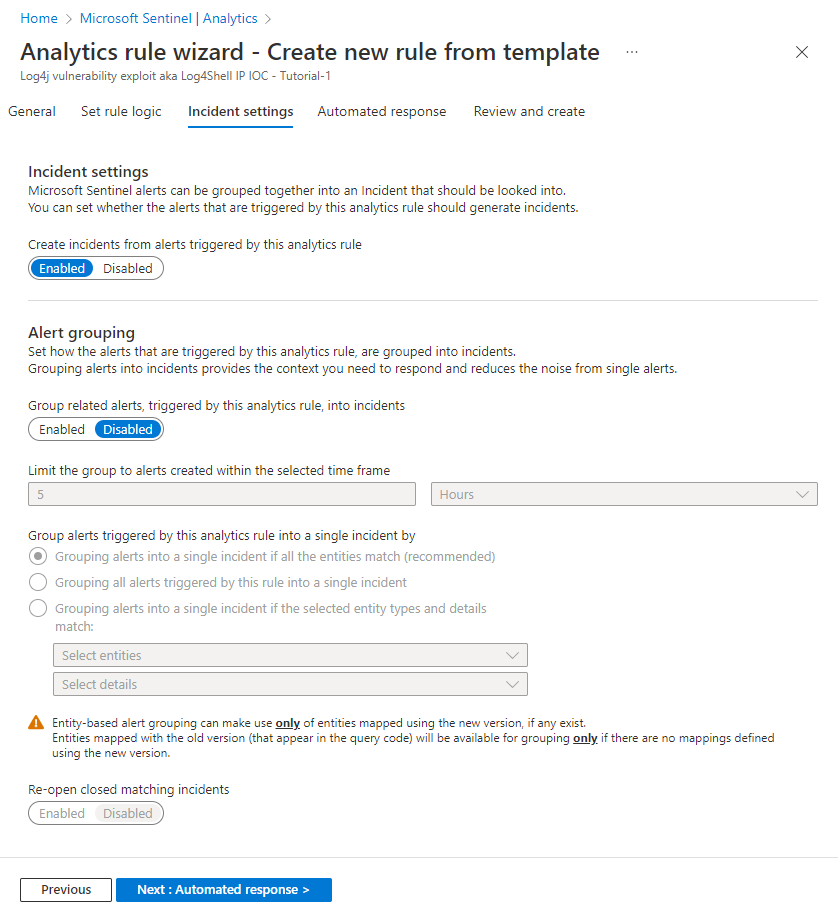
Select Next : Automated response.
Set automated responses and create the rule
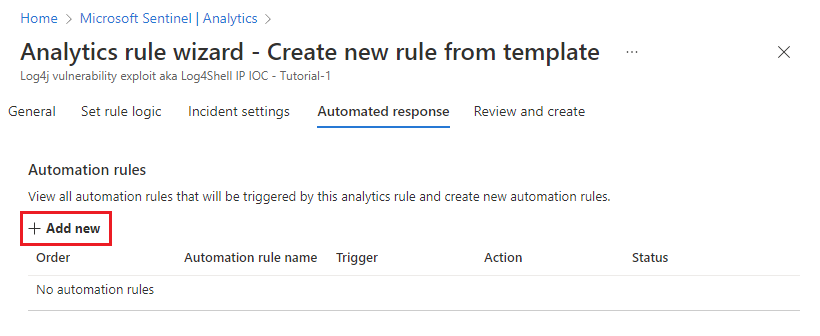
In the Automated response tab:
Select + Add new to create a new automation rule for this analytics rule. This will open the Create new automation rule wizard.
In the Automation rule name field, enter Log4J vulnerability exploit detection - Tutorial-1.
Leave the Trigger and Conditions sections as they are.
Under Actions, select Add tags from the drop-down list.
- Select + Add tag.
- Enter Log4J exploit in the text box and select OK.
Leave the Rule expiration and Order sections as they are.
Select Apply. You'll soon see your new automation rule in the list in the Automated response tab.
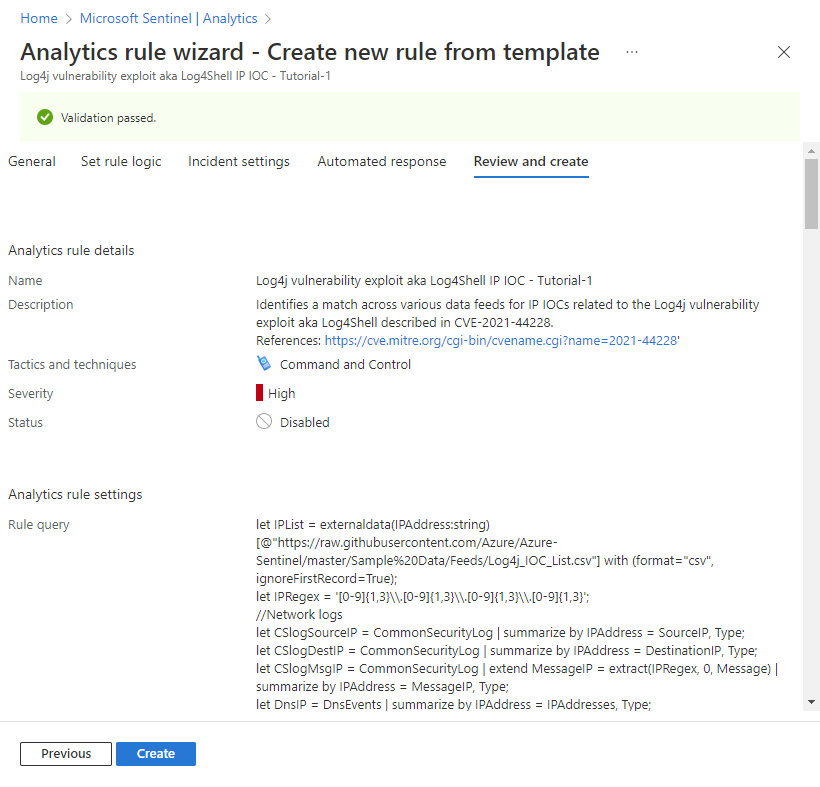
Select Next : Review to review all the settings for your new analytics rule. When the "Validation passed" message appears, select Create. Unless you set the rule to Disabled in the General tab above, the rule will run immediately.
Select the image below for a display of the full review (most of the query text was clipped for viewability).
Verify the success of the rule
To view the results of the alert rules you create, go to the Incidents page.
To filter the list of incidents to those generated by your analytics rule, enter the name (or part of the name) of the analytics rule you created in the Search bar.
Open an incident whose title matches the name of the analytics rule. See that the flag you defined in the automation rule was applied to the incident.
Clean up resources
If you're not going to continue to use this analytics rule, delete (or at least disable) the analytics and automation rules you created with the following steps:
In the Analytics page, select the Active rules tab.
Enter the name (or part of the name) of the analytics rule you created in the Search bar.
(If it doesn't show up, make sure any filters are set to Select all.)Mark the check box next to your rule in the list, and select Delete from the top banner.
(If you don't want to delete it, you can select Disable instead.)In the Automation page, select the Automation rules tab.
Enter the name (or part of the name) of the automation rule you created in the Search bar.
(If it doesn't show up, make sure any filters are set to Select all.)Mark the check box next to your automation rule in the list, and select Delete from the top banner.
(If you don't want to delete it, you can select Disable instead.)
Next steps
Now that you've learned how to search for exploits of a common vulnerability using analytics rules, learn more about what you can do with analytics in Microsoft Sentinel:
Learn about the full range of settings and configurations in scheduled analytics rules.
In particular, learn more about the different types of alert enrichment you saw here:
Learn about other kinds of analytics rules in Microsoft Sentinel and their function.
Learn more about writing queries in Kusto Query Language (KQL). Learn more about KQL concepts and queries, and see this handy quick reference guide.
Feedback
Coming soon: Throughout 2024 we will be phasing out GitHub Issues as the feedback mechanism for content and replacing it with a new feedback system. For more information see: https://aka.ms/ContentUserFeedback.
Submit and view feedback for