Debug Azure Stream Analytics queries locally using job diagram in Visual Studio Code (Preview)
Streaming jobs that output no result or unexpected results often need troubleshooting. The Visual Studio Code extension for Azure Stream Analytics integrates job diagrams, metrics, diagnostic logs, and intermediate results to help you quickly isolate the source of a problem. You can use the job diagram while testing your query locally to examine the intermediate result set and metrics for each step.
Debug a query using job diagram
An Azure Stream Analytics script is used to transform input data to output data. The job diagram shows how data flows from input sources, like Event Hubs or IoT Hub, through multiple query steps to output sinks. Each query step is mapped to a temporary result set defined in the script using a WITH statement. You can view the data as well as metrics of each query step in each intermediate result set to find the source of an issue.
Note
This job diagram only shows the data and metrics for local testing in a single node. It should not be used for performance tuning and troubleshooting.
Start local testing
Use this Quickstart to learn how to create a Stream Analytics job using Visual Studio Code or export an existing job to a local project. Credentials for inputs and outputs are automatically populated for exported jobs.
If you want to test the query with local input data, follow these instructions. If you want to test with live input, configure your input move to the next step.
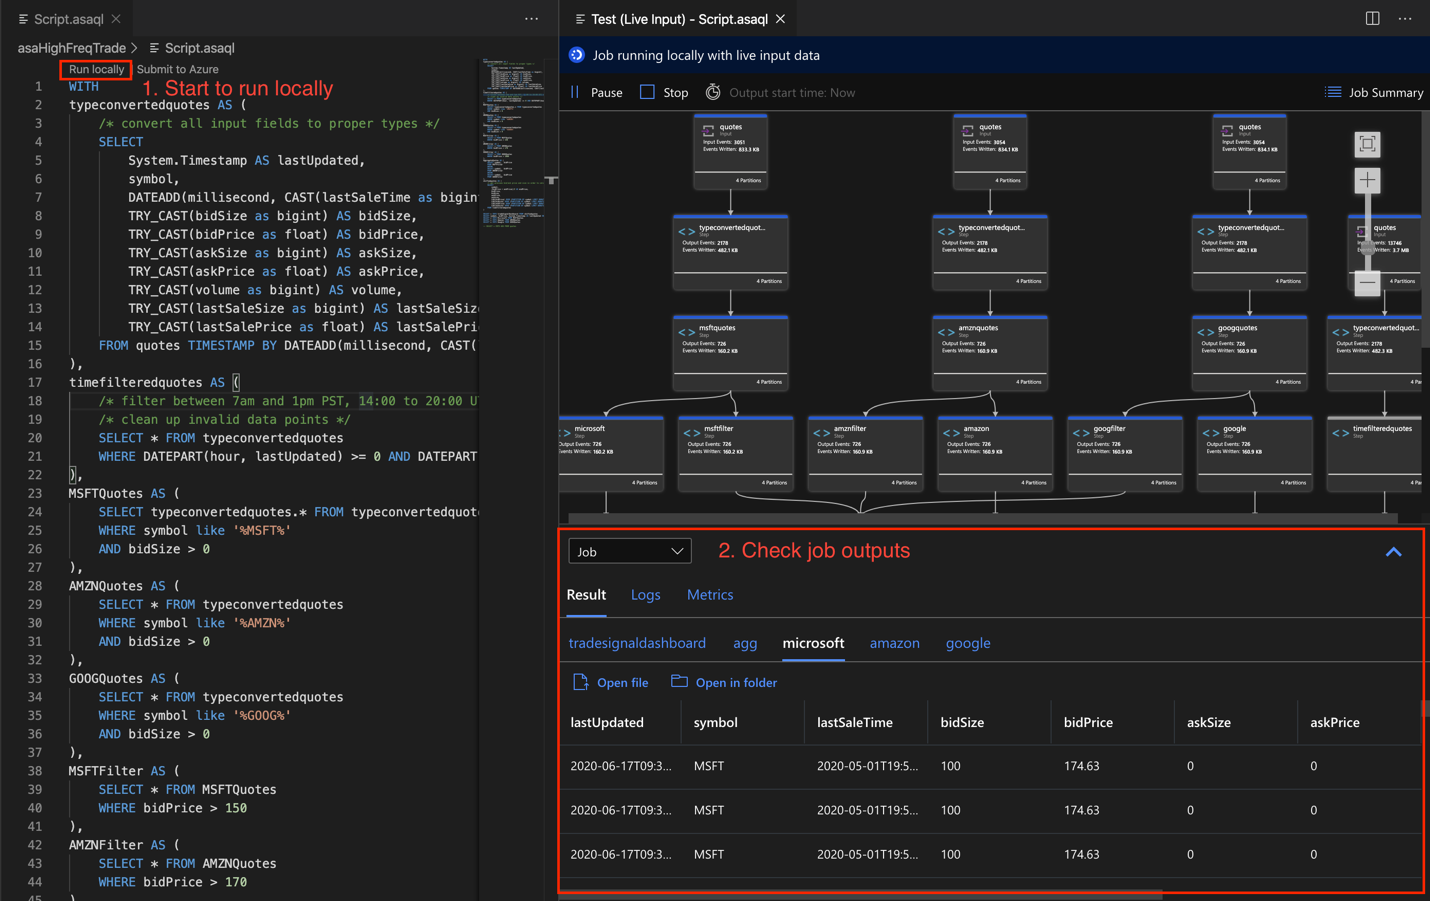
Open the .asaql script file and select Run locally. Then, select Use local input or Use live input. The job diagram appears on the right side of the window.
View the output and intermediate result set
All the job outputs are displayed in the result window at the bottom-right side of the Visual Studio Code window.
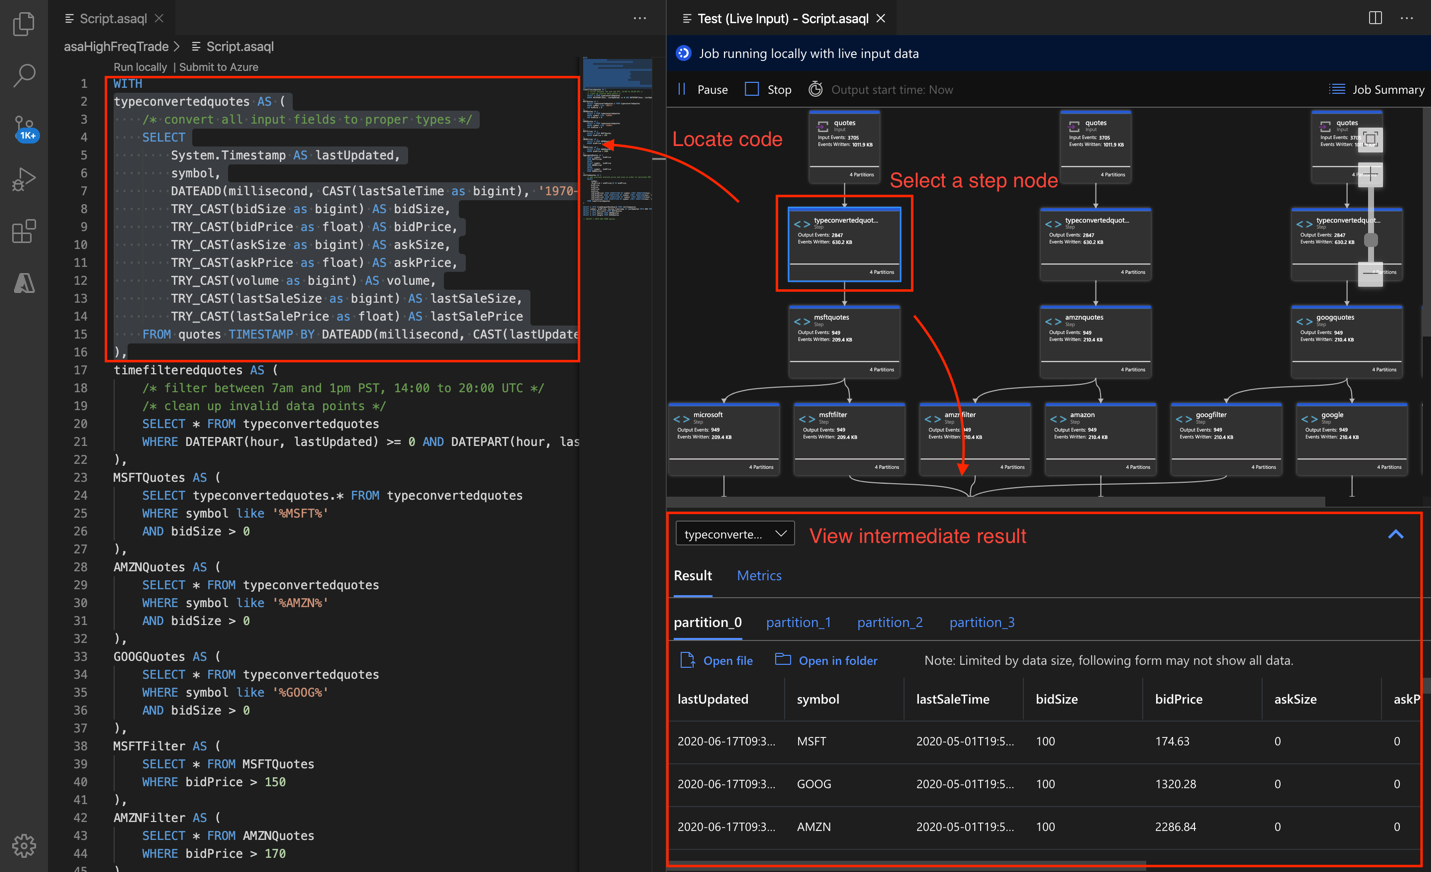
Select the query step to navigate to the script. You're automatically directed to the corresponding script in the editor on the left. The intermediate result appears in the result window at the bottom-right side of the Visual Studio Code window.
View metrics
In this section, you explore the metrics available for each part of the diagram.
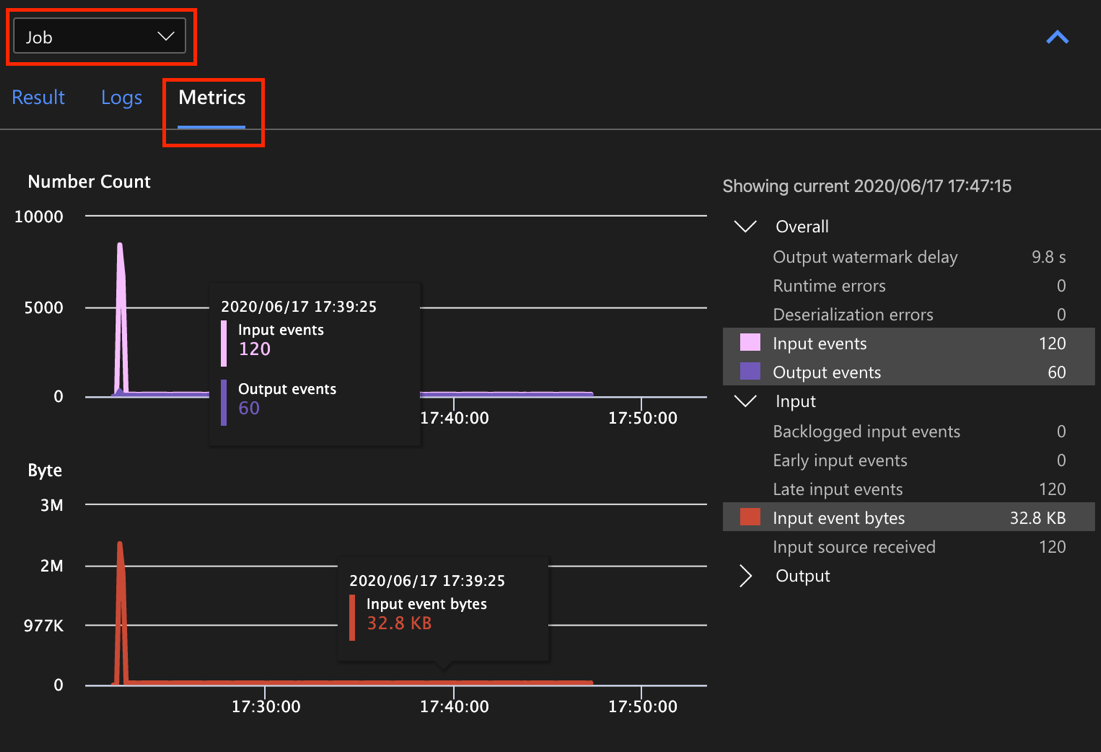
Select the Metrics tab next to the Result tab on the bottom-right side of the Visual Studio Code window.
Select Job from the dropdown. You can select any empty space in a graph node to navigate to job level metrics. This view contains all the metrics, which are updated every 10 seconds when the job is running. You can select or unselect the metrics on the right side to view them in the charts.
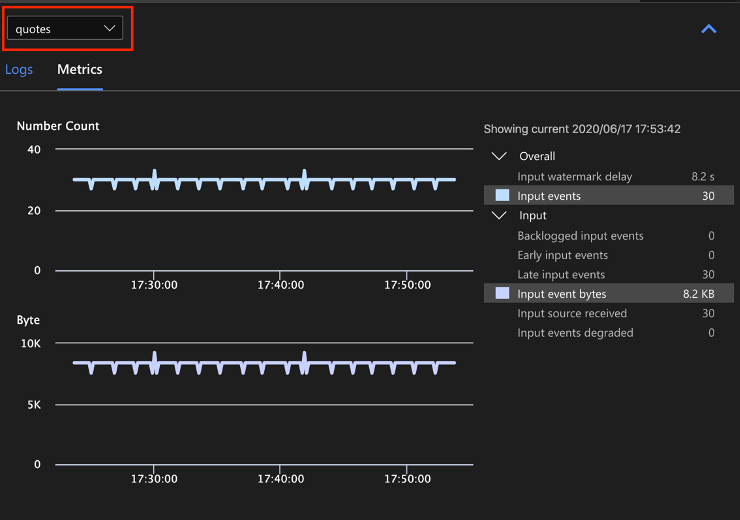
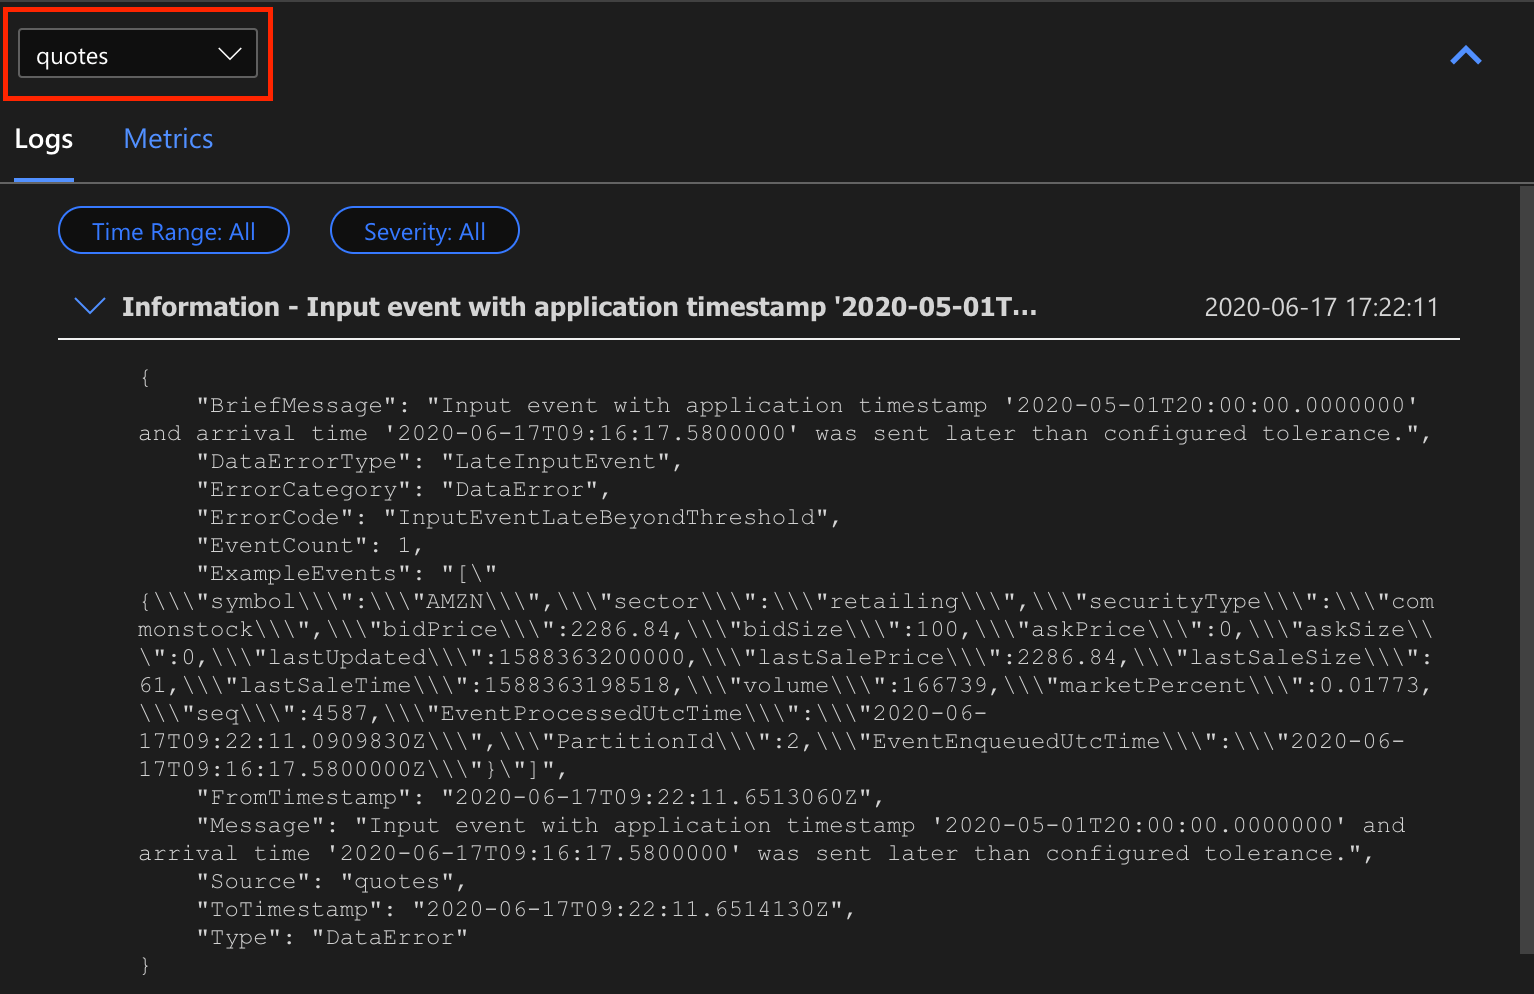
Select the name of the input data source from the dropdown to see input metrics. The input source in the screenshot below is called quotes. For more information about input metrics, see Azure Stream Analytics job metrics.
Select a query step from the job diagram or select the step name from the dropdown to see step level metrics. Watermark delay is the only available step metric.
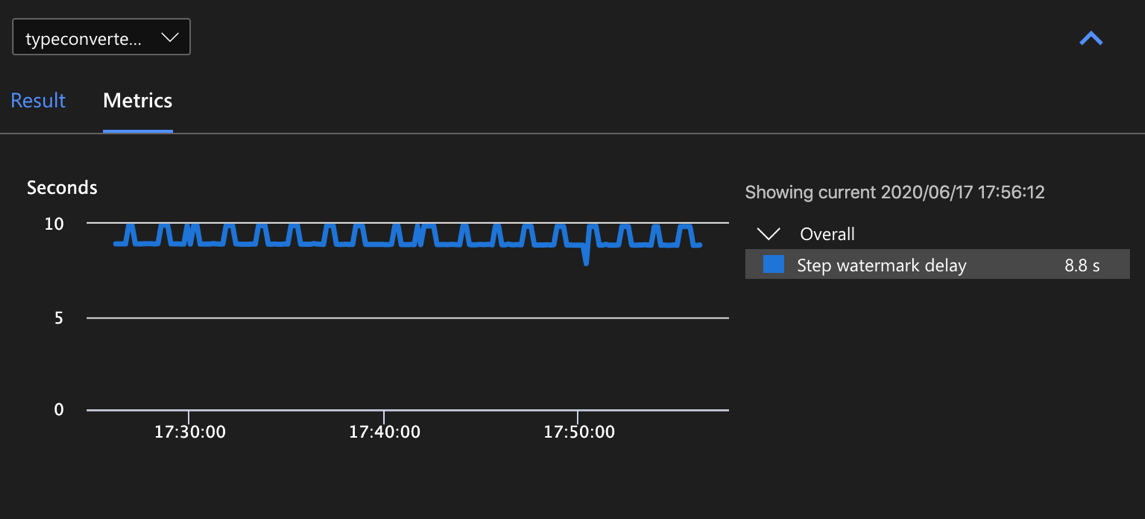
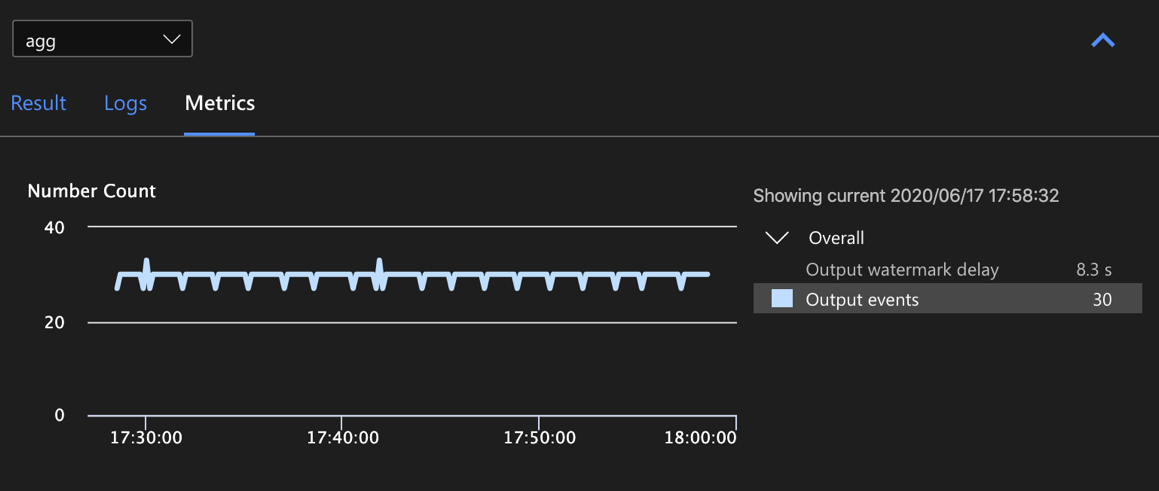
Select an output in the diagram or from the dropdown to see output-related metrics. For more information about output metrics, see Azure Stream Analytics job metrics. Live output sinks aren't supported.
View diagnostic logs
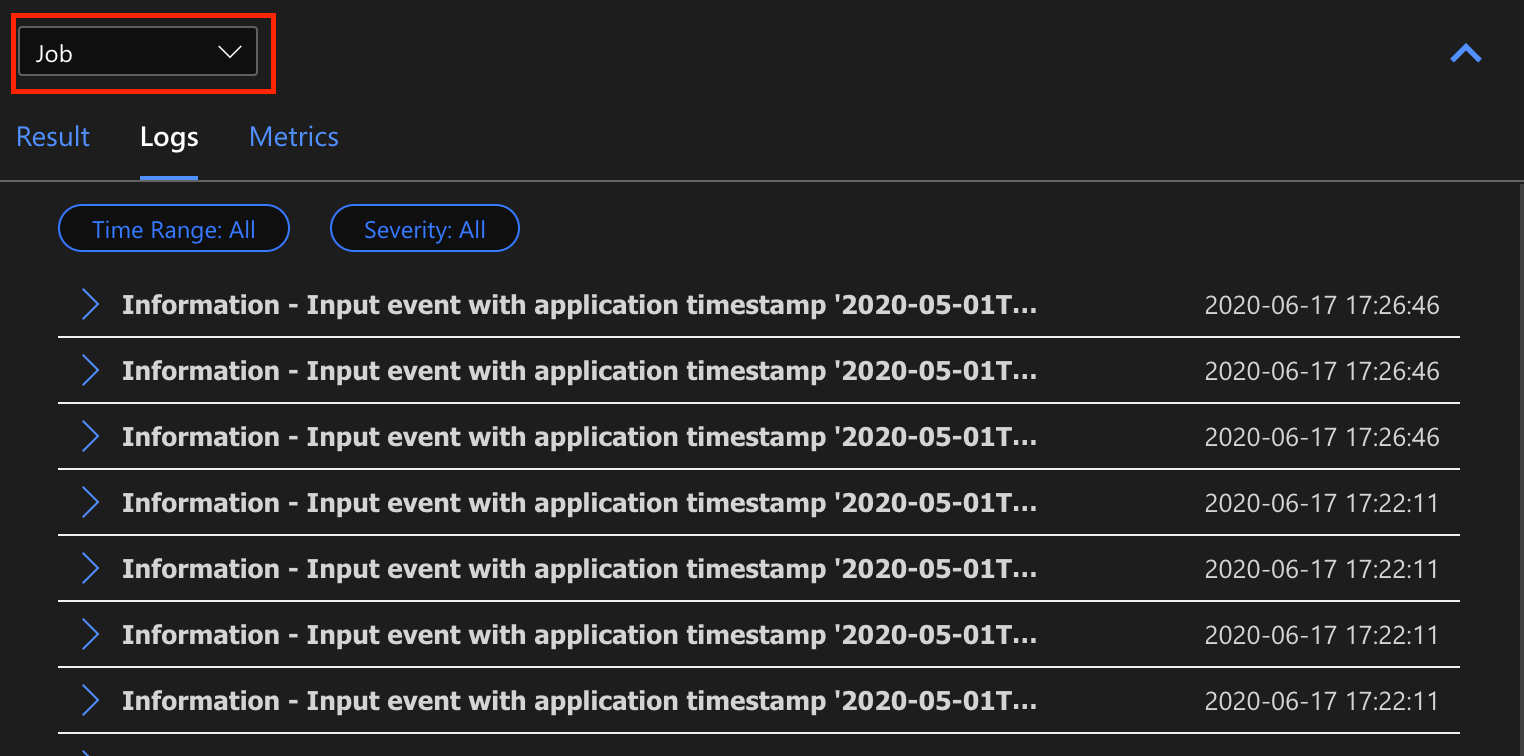
Job level diagnostic logs contain diagnostic information for input data sources and output sinks. When you select an input node or output node, only the corresponding logs are shown. There are no logs shown if you select a query step. You can find all logs at the job level, and you can filter the logs by severity and time.
Select a log entry to see the entire message.
Other job diagram features
You can select Stop or Pause from the tool bar as needed. Once the job is paused, you can resume it from last output.
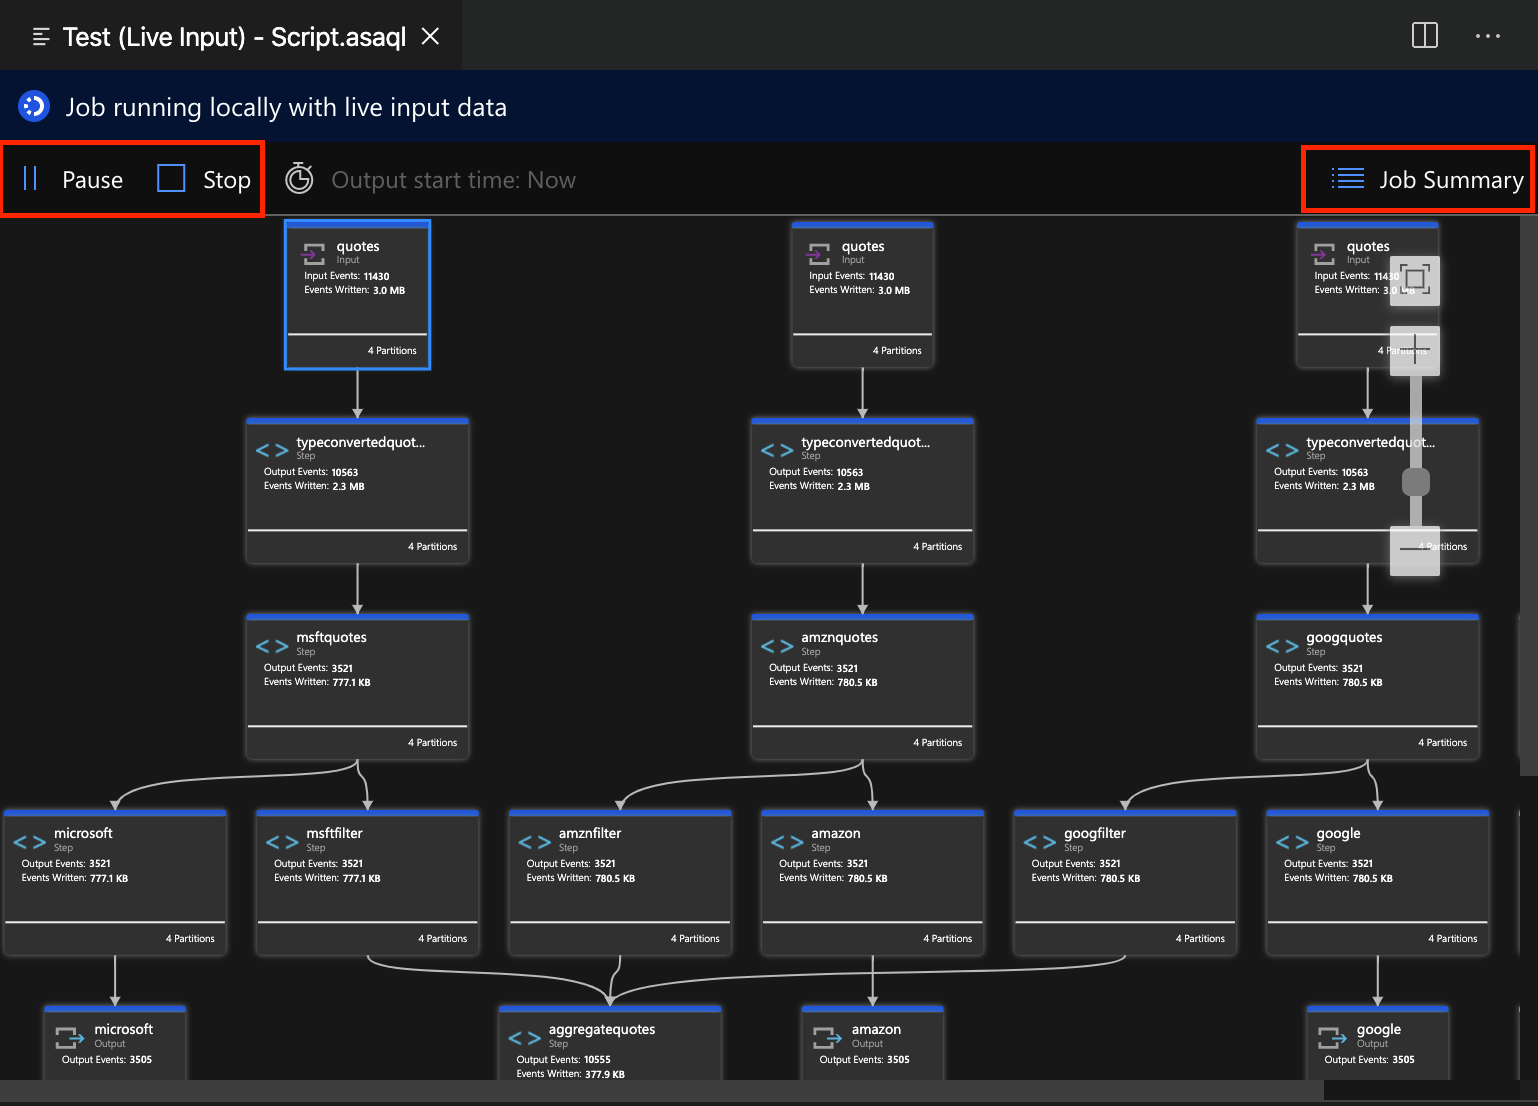
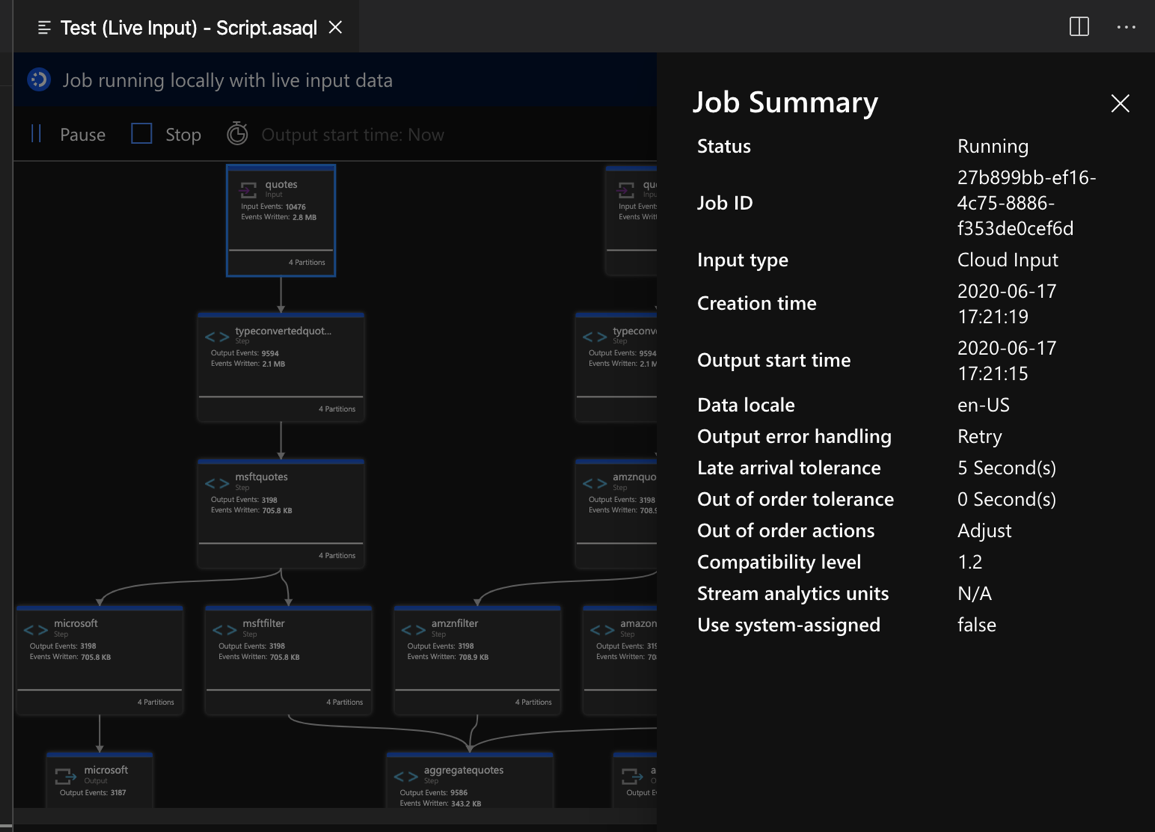
Select Job Summary at the top-right of the job diagram to see properties and configurations for your local job.
Limitations
Run job locally with JavaScript function is only supported on the Windows operating system.
Azure Machine Learning functions aren't supported.
Only cloud input options have time policies support, while local input options don't.