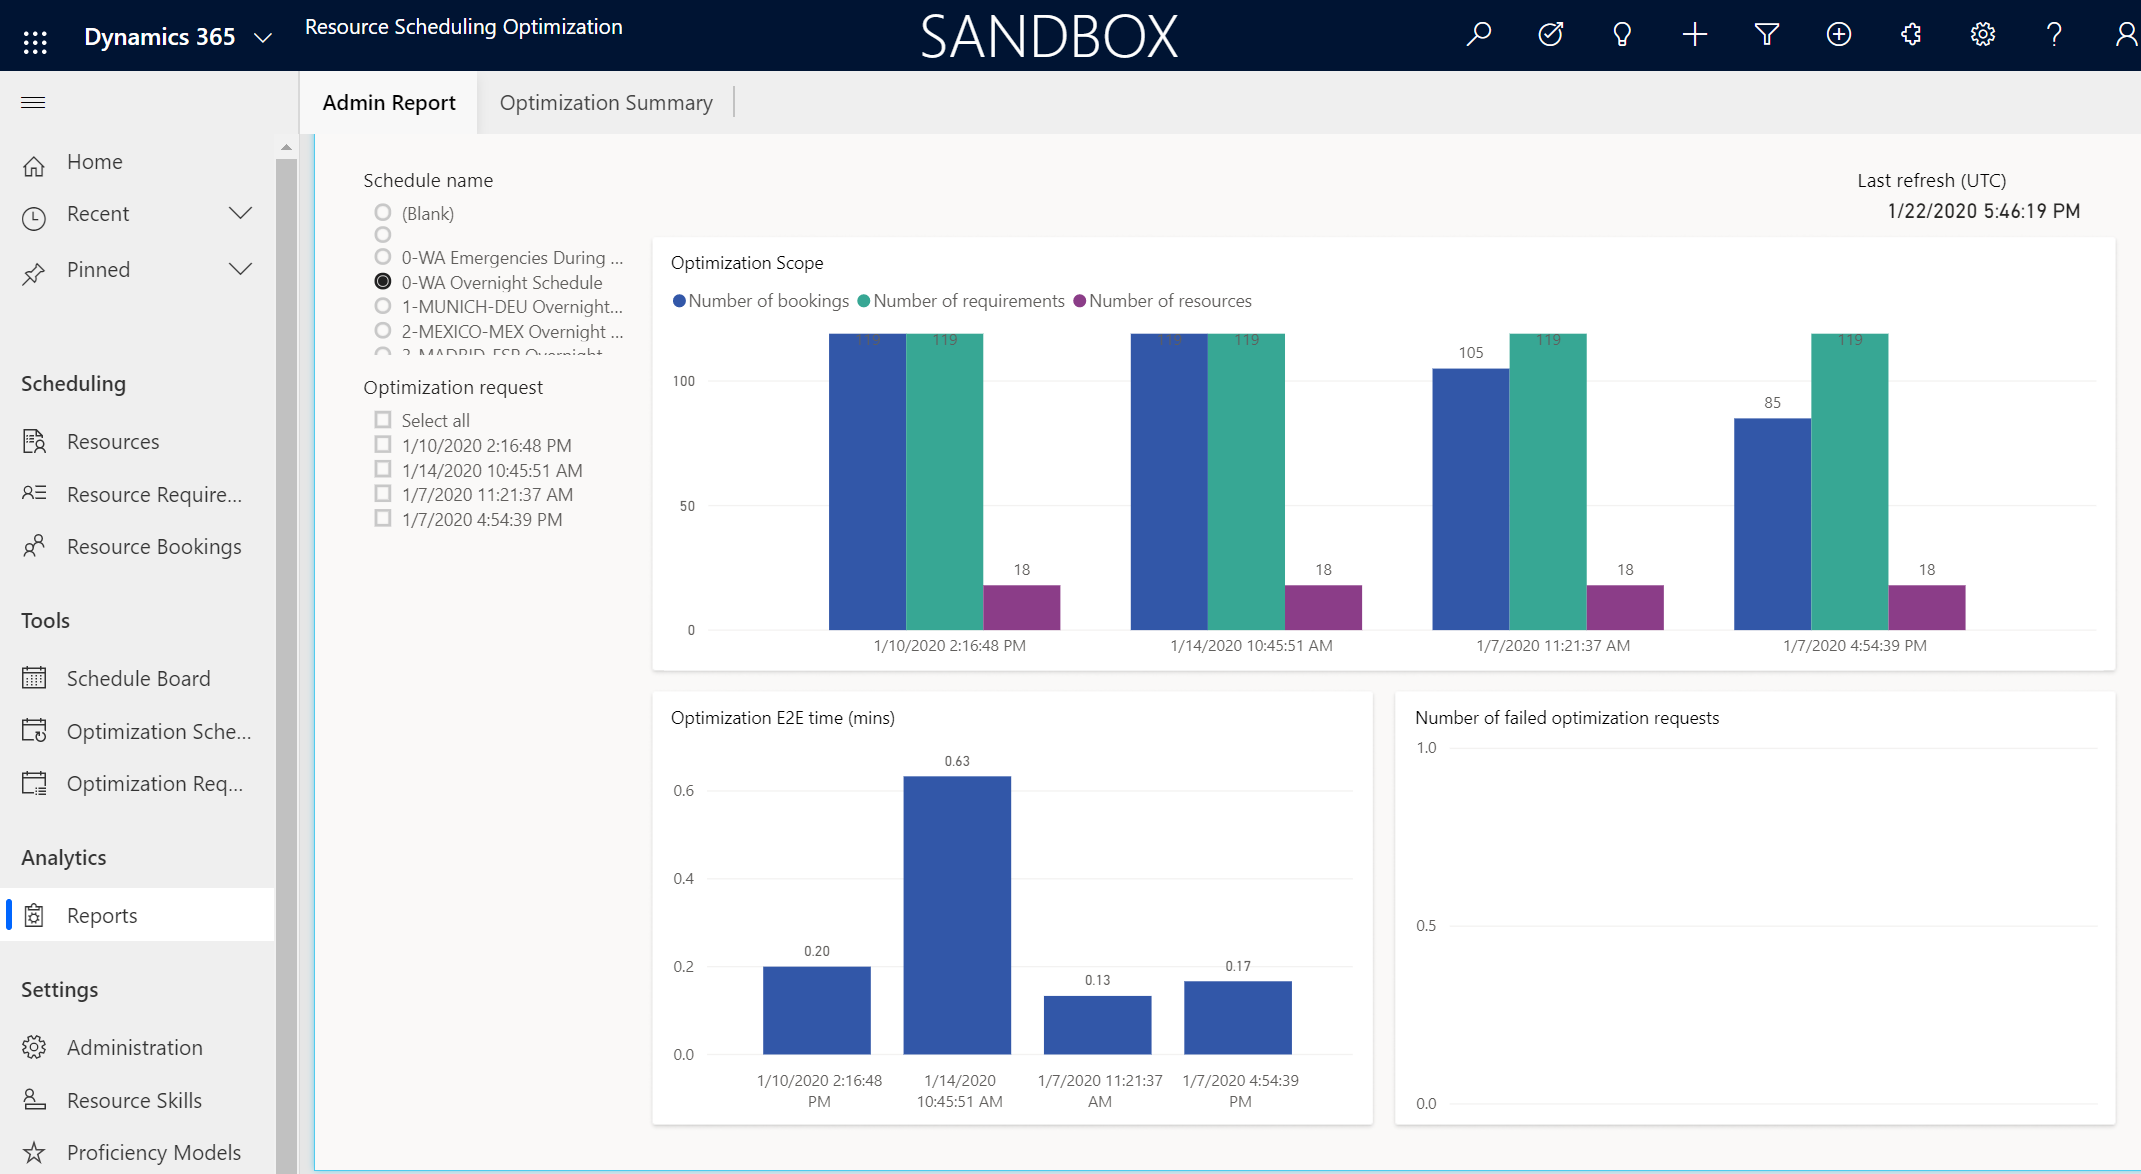
Resource Scheduling Optimization admin report
The admin report in the Resource Scheduling Optimization Add-in analyzes when and how Resource Scheduling Optimization runs, but not the actual booking results.
Tip
As an alternative, Dynamics 365 offers various ways to visualize your data in Power BI. One option is to use the built-in visualization tool within Dynamics 365 to quickly generate insights. Learn more: Visualize your data quickly.
For more customized reporting, you can build your own reports using the Dataverse connector for Power BI. You can create tailored visualizations based on your specific data needs. Learn more: Create a Power BI report using data from Dataverse.
You can also embed Power BI reports directly within Dynamics 365. Learn more: Embed a Power BI report.
Before you start
To run the report, the Resource Scheduling Optimization administrator needs to publish at least one optimization schedule.
Filters and slicers
- Schedule name: Name of the optimization schedule.
- Optimization request: List of jobs that ran to optimize schedules.
Report metrics
To access the admin report, open Resource Scheduling Optimization and go to Analytics > Reports.

Optimization Scope: Number of bookings, requirements, and resources in the selected schedule requests.
Optimization E2E time (mins): Time in minutes to run the optimization job from start to finish.
Number of failed optimization requests: Number of failed optimization requests in the selected schedule requests.