Note
Access to this page requires authorization. You can try signing in or changing directories.
Access to this page requires authorization. You can try changing directories.
In Real-Time Intelligence, you interact with your data in the context of eventhouses, KQL databases, and tables. A single workspace can hold multiple eventhouses, an eventhouse can hold multiple KQL databases, and each database can hold multiple tables.
In this article, you learn how to create a new KQL database. Once your KQL database has data, you can proceed to query your data using Kusto Query Language in a KQL queryset.
Prerequisites
Create a new KQL database
To create a new KQL database, in the Eventhouse explorer either:
Select Eventhouse then + Database +
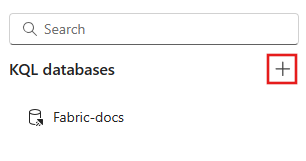
Under KQL Databases select +
Enter your database name, select your database type, either New database (default) or New shortcut database (follower), and then select Create. For information about follower databases, see Create a database shortcut.
Note
The database name can contain alphanumeric characters, underscores, periods, and hyphens. Special characters aren't supported.


The KQL database is created within the context of the selected eventhouse. You can also Create an empty table.
Explore your KQL database with the embedded KQL queryset
When you create a new KQL database, the portal automatically creates an attached environment. Use this environment to explore and manage the KQL database by using KQL queries.
Tip
You can also analyze data with an SQL analytics endpoint or notebook, or create a standalone KQL queryset.
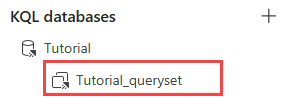
To access the embedded KQL queryset, select the KQLdatabasename_queryset item from your KQL database object tree.
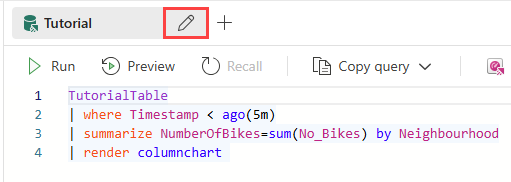
To rename the query environment, select the Pencil icon next to its name, and enter a new name.