Create a custom report in Microsoft Sustainability Manager
![]() Microsoft Cloud for Sustainability
Microsoft Cloud for Sustainability
This article shows you how to create a custom report for your Microsoft Sustainability Manager environment. These instructions use Power BI to create the report and Azure Synapse for Dataverse to make the data available in an easy-to-use and performant format.
Creating a custom report involves the following steps:
- Prerequisites
- Gather information
- Prepare your Azure environment
- Connect Dataverse to Azure Synapse
- Connect Power BI to Azure Synapse workspace
- Embed Power BI report in Microsoft Sustainability Manager
Prerequisites
To complete the instructions in this article, you'll need to meet the following prerequisites:
- Microsoft Sustainability Manager
- Power BI
- An Azure subscription that you can create resources in
Important
Microsoft Sustainability Manager, Power BI, and your Azure subscription must all be in the same tenant.
Gather information
In Power Apps maker portal, select Dataverse on the left navigation, and then select Azure Synapse Link.
Select New link on the top menu bar.
Make a note of the region listed next to Your environment is located in:. You'll need this information in the next steps.
Prepare your Azure environment
Before you can create your report, you must prepare an area in your Azure subscription to sync your report data.
In a new browser tab, go to Microsoft Azure portal.
Enter resource groups in the search box at the top of the screen. In the search results, select Resource groups. On the Resource groups page, select Create to create a new resource group.
On the Create a resource group page, complete the following fields:
Field Description Subscription The subscription you want to use for this resource group. Resource group Enter a name for the resource group. In this example, we're using rg-msm-customreports. Region Select the region you obtained in the Gather information step. In this example, we're using East US. 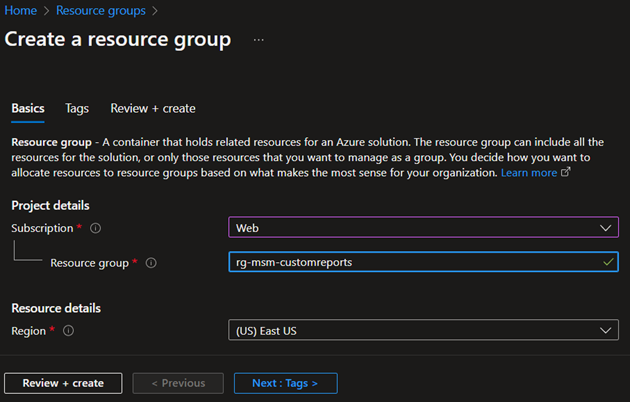
Select the Review + create button at the bottom of the screen. After Azure validates the configuration, select the Create button on the bottom of the page to complete the resource group creation.
After that step completes, enter storage account in the search box at the top of the page. In the search results, select Storage accounts. On the Storage accounts page, select Create to create a new storage account.
On the Create a storage account page, complete the following fields:
Field Description Subscription The subscription you used earlier. Resource group The name of the resource group you created. Storage account name Enter a name for the storage account. In this example, we're using stmsmcustomreports. Region The same region you specified earlier. Performance Accept the default. Redundancy Accept the default. 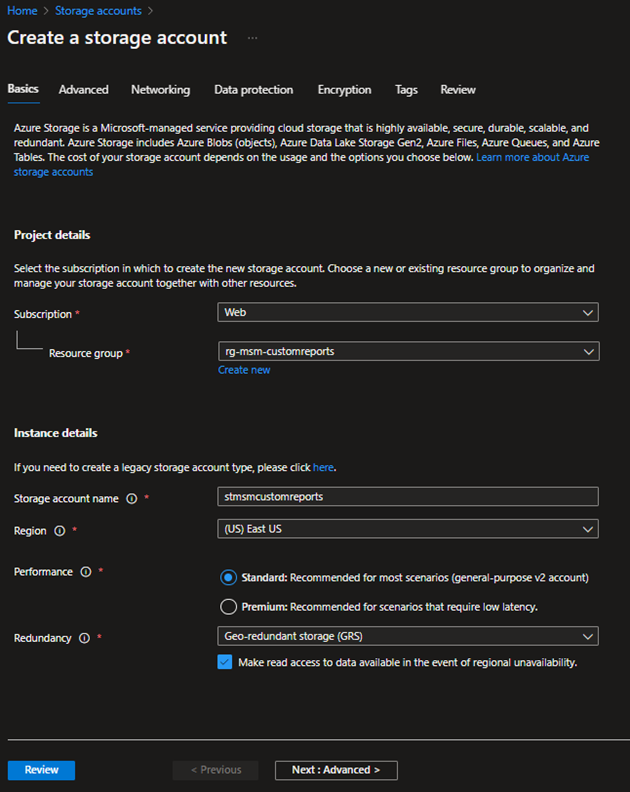
Select the Next : Advanced > button at the bottom of the page. On the Advanced tab, check the box for Enable hierarchical namespace under Data Lake Storage Gen2. Select the Review button at the bottom of the page. After Azure validates the configuration, select the Create button on the bottom of the page to complete the storage account creation.
After that step completes, enter Azure Synapse in the search box at the top of the page. In the search results, select Azure Synapse Analytics. On the Azure Synapse Analytics page, select Create to create a new Synapse workspace.
On the Create Synapse workspace page, complete the following fields:
Field Description Subscription The subscription you used earlier. Resource group The name of the resource group you created earlier. Managed resource group Leave blank. Workspace name Enter a name for your Synapse workspace. In this example, we're using synmsmcustomreports. Region The same region you specified earlier. Account name Enter the storage account name you created earlier. In this example, we entered stmsmcustomreports. File system name Select Create new and enter the name you want. In this example, we entered synapse. 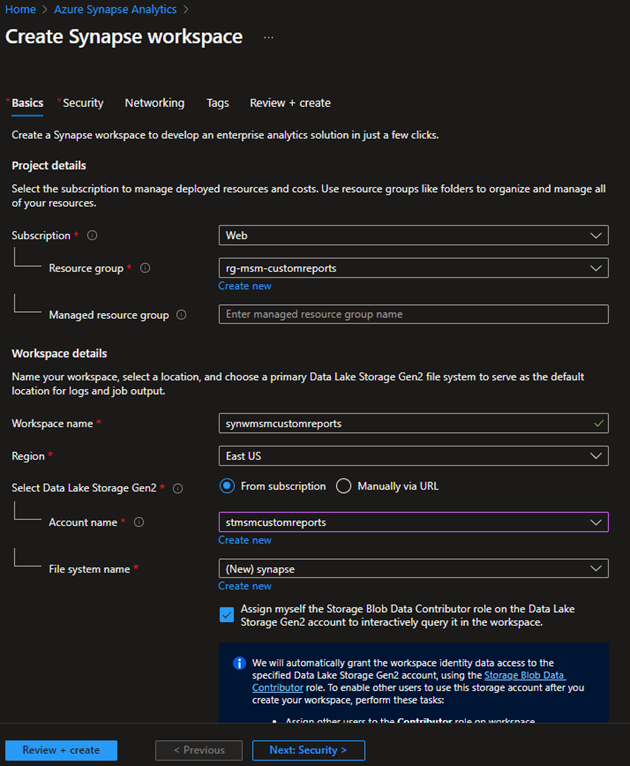
Select the Review + create button at the bottom of the page. After Azure has validated the configuration, select Create.
Connect Dataverse to Azure Synapse
In a new browser tab, go to Power Apps maker portal.
Select Dataverse on the left navigation, and then select Azure Synapse Link.
Select New link.
On the New link page, complete the following fields:
Field Description Subscription The subscription you used earlier. Resource group The name of the resource group you created earlier. Storage account The name of the storage account you created earlier. Check the box for Connect to your Azure Synapse Analytics workspace.
Select the Next button on the bottom right of the page.
On the next page, select all tables you want to use to build your report. You don't need to select all the tables unless you need them for your reports.
Select the Save button.
It will take a few minutes for the maker portal to connect and synchronize with your Azure Synapse workspace. When it completes, select the ellipse, and then select Go to Azure Synapse Analytics workspace.
In the Azure portal, navigate to your workspace. On the Data tab, you'll see that your data has populated from Microsoft Sustainability Manager.
Connect Power BI to Azure Synapse workspace
Open the Power BI desktop app, select Get data in the ribbon, and then select More.. from the dropdown.
Select Azure SQL database from the options.
Enter the server details, select DirectQuery as the mode of data connectivity, and then select OK. To find server details, go to your synapse workspace and copy the serverless SQL endpoint.
Select the tables for the query to use for building visuals in the report.
After you prepare the report, select Publish to publish it in your workspace.
Embed Power BI report in Microsoft Sustainability Manager
First, you need to clone the dashboard:
Sign into Power BI, select Workspaces from the left navigation, select your Power BI report, and then copy its URL.
In Power Apps maker portal, select your environment from the dropdown list in the upper right of the page.
On the Home page, scroll down to the see the list of environments, select the ellipses (...) next to Cloud for Sustainability Preview, and then select Edit.
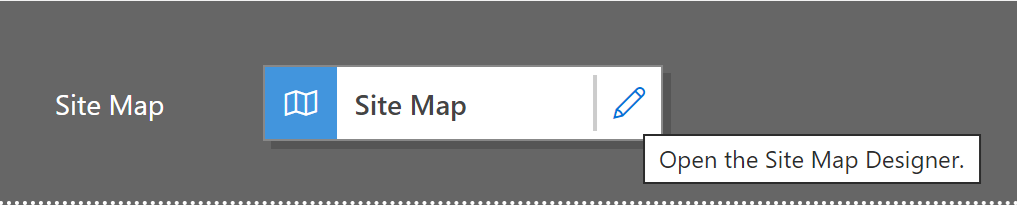
Select the edit (pencil) icon next to the site map of the app.
Under Overview, select Getting Started, and then select Clone on the menu at the top.
Rename the title of the new item to Custom dashboard or the name of the Power BI report.
Change the URL field to the URL of the Power BI report you previously copied.
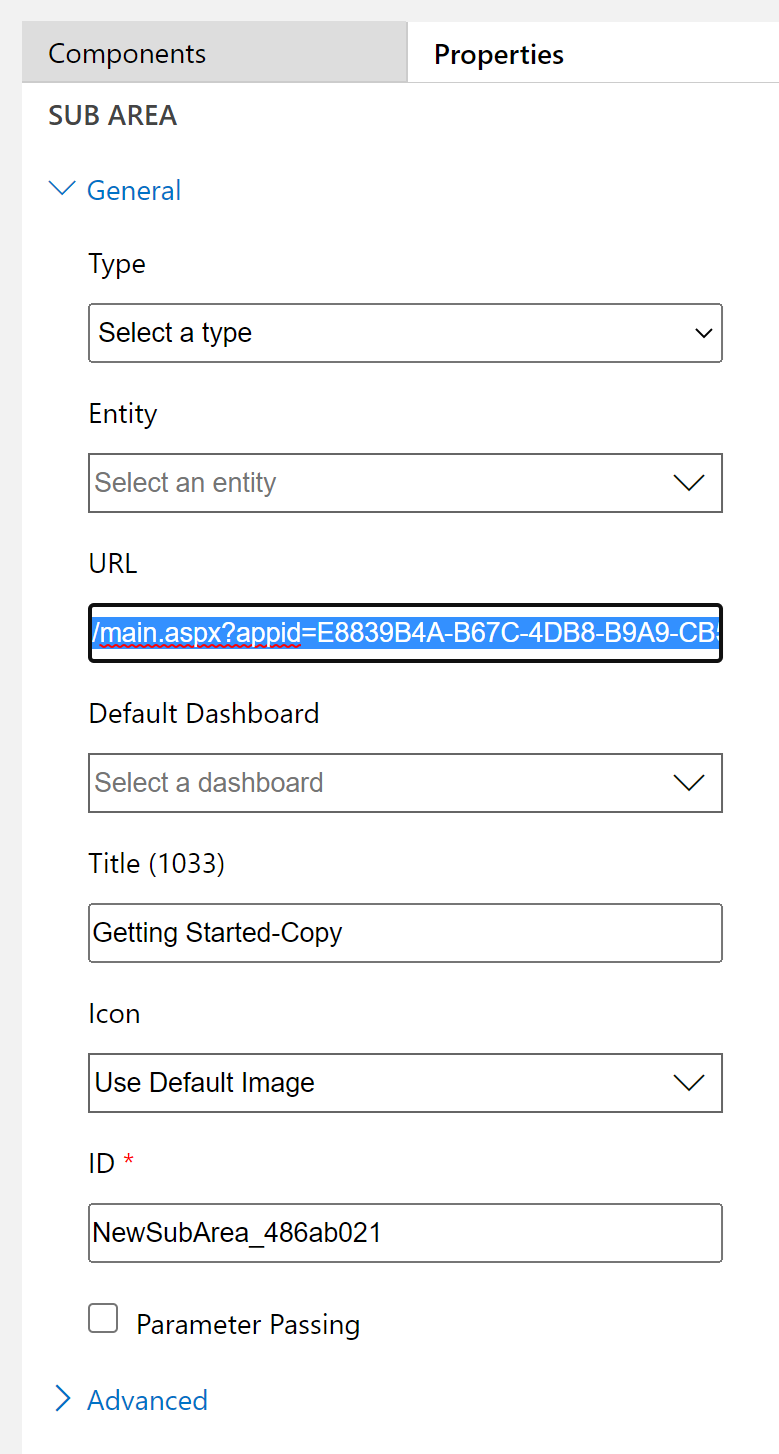
Select Save at the top right of the page.
After the save completes, select Publish.
Refresh the application. Your custom dashboard will display under Overview in the left navigation.
Next, you'll embed the report into Microsoft Sustainability Manager:
Note
These instructions assume that a Power BI report already exists in a shared workspace in Power BI in the same Microsoft 365 tenant. They also assume that the Power BI report has at least one report and one dashboard.
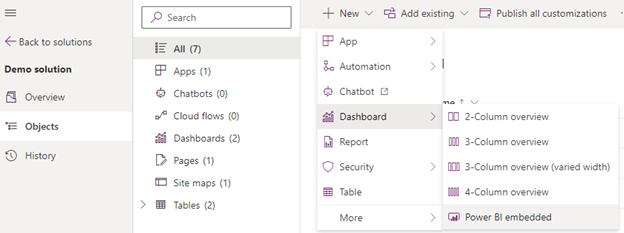
In Power Apps maker portal, go to Solutions > New solution to create a solution. In this example, the solution is called Demo solution.
Select the solution to open it. In the solution, go to New > Dashboard > Power BI embedded.
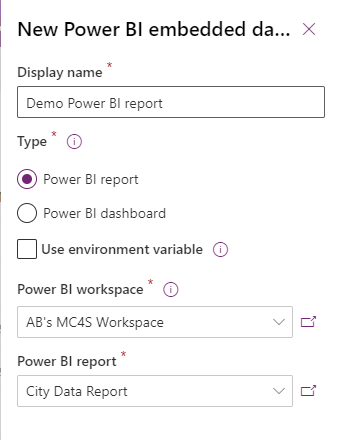
In the right pane, complete the following fields:
Field Description Type Choose either a Power BI report or Power BI dashboard. Power BI workspace Select the shared workspace. Power BI report Select the Power BI report. Select Save.
In the same solution, go to Add existing > App > Model-driven app. Next to the Cloud for Sustainability Preview app, select the ellipsis, select Edit, and then select Edit in preview.
On the left navigation, go to Navigation > Overview > Add > Subarea.
On the New subarea page, complete the following fields:
Field Description Content type Select Dashboard. Dashboard Select Demo Power BI report. Title Enter a title for the dashboard. Select Add.
Select Save, and then publish the model-driven app.

