Environmental metrics and analytics (preview)
![]() Microsoft Cloud for Sustainability
Microsoft Cloud for Sustainability
Important
Some or all of this functionality is available as part of a preview release. The content and the functionality are subject to change.
The Environmental metrics and analytics (preview) capability allows you to directly connect your environmental data from Microsoft Sustainability Manager to the data lake as tables without the need to reingest it. You can process this data according to your sustainability needs to create custom environmental notebooks and build insights to better understand your carbon, water and waste emissions.
The items deployed in this capability include notebooks and data lakes that compute and store analytical datasets and metrics required for building insights. This capability also includes dashboards to visualize and analyze the metrics.
This capability deploys the following data lakes:
IngestedMSMData: Stores Sustainability Manager data.
AggregatedMSMData: Stores aggregated datasets and metrics for analysis.
All resources that this solution deploys are prebuilt and deployed into your Fabric workspace. The resources are open, and you can customize them to meet your needs.
The Environmental metrics and analytics (preview) capability includes the following features:
Integrate data
You can use the Fabric shortcut functionality to link the data from an Azure Data Lake Storage container that has Microsoft Sustainability Manager exported data.
Prerequisites
Deploy ESG data estate (preview) in your Fabric workspace.
You should have Microsoft Sustainability Manager installed and set up in your Dataverse environment.
You should have an Azure Data Lake Storage Gen2 storage account.
You must have the Dataverse system administrator security role.
You must have an Azure Data Lake Storage Gen2 account and Owner and Storage Blob Data Contributor role access. Your storage account must enable hierarchical namespace for both initial setup and delta sync. Allow storage account key access is required only for the initial setup.
Step 1: Set up Azure Synapse Link
In this step, you set up an Azure Synapse Link for the Sustainability Manager environment from which you want to bring data into the Environmental metrics and analytics (preview) capability.
Open the Power Apps portal. On the top right, select your Dataverse environment that has Sustainability Manager installed.
Select Azure Synapse Link from the left pane and select New link. If it doesn't already appear, select More, select Discover all, select Data Management, and then select Azure Synapse Link.
Leave Connect to your Azure Synapse Analytics workspace unchecked. You run the integration and transformation scripts on Fabric, not Synapse.
Enter your storage account and subscription details and select Next. You can only select a storage account located in the same location as your environment. For example, if your environment is in the West US, your storage account should be in West US or West US2.
Select all your Sustainability Manager tables from the list and select Save. You can filter by msdyn_ to view the relevant tables.
An Azure Synapse Link to your storage account is created, and the selected tables are exported to the storage account. You can add or remove the tables in the link by going back to Azure Synapse Link, selecting the link you created, and then selecting Manage tables.
Open your Data Lake Storage Gen2 account that was provided while creating the link in prior steps. A new container starting with dataverse- is created in your storage account with all the selected tables exported in folder structure in CSV format along with a model.json file that contains the schema for all the tables. Your Sustainability Manager data is now available in your own storage account.
Step 2: Link the Data Lake Storage container
In this step, you link the Data Lake Storage container with Sustainability Manager data to the IngestedMSMData lakehouse of the deployed capability using the Fabric shortcut functionality.
Open the workspace in Fabric in which you deployed the Sustainability solution. Select the solution from the list view to open the solution. Select the Environmental metrics and analytics (preview) capability from the Manage deployed capabilities list view to reach the managed capability page.
From the ESG data estate managed capability page, select the IngestedMSMData lakehouse.
Select New shortcut from the ellipses menu of Files. In the New shortcut dialog box, select the Azure Data Lake Storage Gen2 tile, and then provide the following connection details to connect to the Data Lake Storage container that has the exported Sustainability Manager data.
- URL: Go to the Data Lake Storage account and from the left blade select Endpoint. Then copy the end point for Data Lake Storage and paste it in the URL field.
- Connection: Select Create new connection.
- Authentication kind: Select Organization account, sign in to your Data Lake Storage account, and then select Next.
For the shortcut name, enter MSMData, set the sub path as the container name that contains the Sustainability Manager data prefixed with /, and then select Create. The Sustainability Manager data is successfully integrated with the data lake under Files.
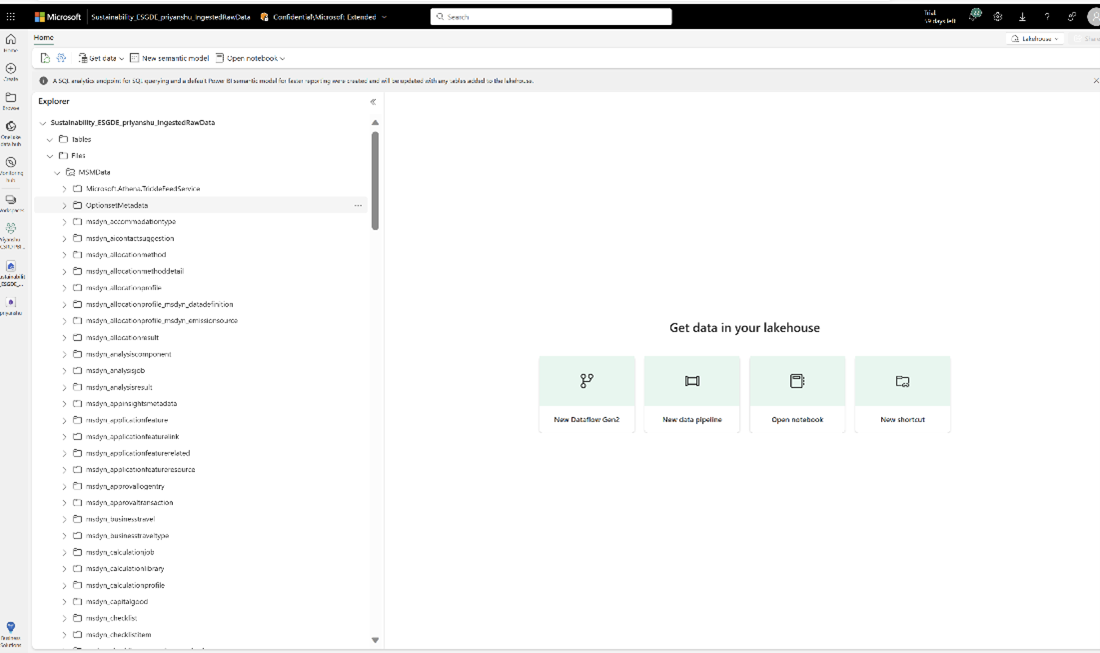

After the data integrates in the Files section of the IngestedMSMData lakehouse, load the Sustainability Manager data as tables by using the LoadMSMDataToLakehouseTables notebook. After this notebook runs, Sustainability Manager tables appear in the table section of the IngestedMSMData lakehouse. You can now use them for computing metrics and analytical datasets.
Compute analytical datasets and metrics
After the Sustainability Manager data integrates in the IngestedMSMData lakehouse, compute analytical datasets and custom metrics required for analysis. This capability deploys the GenerateAggregatedMSMData notebook in your Fabric workspace. You can use it to generate specific environmental metrics. You can update the notebook if you want to update the computation logic for specific metrics or want to compute other metrics.
Prerequisite
Ensure that your Sustainability Manager data is integrated to the IngestedMSMData lakehouse and is loaded as tables. If you want to explore the functionality, you can also load the demo data into the IngestedMSMData lakehouse and use that for computing metrics.
After the notebook runs successfully, required metrics are created as tables in the AggregatedMSMData lakehouse.
Note
This preview version only supports full snapshot refresh of Sustainability Manager data and not incremental delta data refresh. The prebuilt transformation notebooks deployed with the capability also support only full snapshot refresh. Also, if you update other data into those tables populated by these notebooks and then run them, the data is overwritten.
Visualize data and analytics
After the metrics are computed and stored as tables, you can use the prebuilt Power BI dashboard to analyze the metrics.
Open the MetricAnalysisReportDataset semantic model from your workspace or from the Environmental metrics and analytics (preview) capability detail page.
On the top left, select your file, and then select Settings. In the Data source credentials section, Select Edit credentials.
Provide your Fabric credentials in the dialog box for authenticating the AggregatedMSMData lakehouse data source. Select the following values:
- Authentication method: OAuth2
- Privacy level setting for this data source: Organizational
Select Sign in.
After you successfully sign, go back to the semantic model home page and select Refresh now from the Refresh menu option. After the refresh completes, the dataset is refreshed with data from the AggregatedMSMData lakehouse.
If there are any errors in the refresh, you can find the error details by viewing the Refresh history option under the Refresh menu.
Open the MetricAnalysis report from the capability detail page or from your workspace. The report should appear with specific environmental metrics and statistic charts.
Note
Metrics data only appears if the data exists in the AggregatedMSMData lakehouse. Currently, the prebuilt Power BI report only supports metrics for Water. In future releases, the report will expand to cover other environmental metrics.


